The Market is in a Bubble? Another Reason to Compare Growth and Value
Many analysts and investors have reported that the market is in a bubble and due for a reckoning. Since there are many markets that make up global equities, it’s important to note that most of these reports are referring specifically to the S&P 500, and it is hard to argue with those assessments. By many measures, the S&P is certainly overvalued and might be due for a wicked pullback, but when the bubble will burst and how much of a decline is anyone’s guess. One thing seems certain, the market has been pushed into bubble territory by Growth stocks. In fact, most if not every time the S&P 500 reaches bubble levels, it’s driven by Growth stocks, and this time it has been driven by an unusually small number of meg cap growth stocks.
The top three stocks in the S&P 500 are Apple (AAPL), Microsoft (MSFT), and Amazon (AMZN), which make up 15% of the index and whose performance over the last year was 65%, 32%, and 67%, respectively. With the S&P generating just 17% over the same period, we can assume that there were plenty of stocks in the index with less than bubbly performance.
If we further divide the performance of the S&P 500 into Growth versus Value, we can see that performance has been skewed by the performance of Tech, mainly because of the three stocks mentioned. They make up over 30% of the S&P 500 Growth Index. But while the S&P 500 might look like it’s in bubble territory, a more detailed analysis of growth vs value might reveal otherwise.
Definitions of Growth and Value
Before getting into a discussion about growth versus value, we should first make sure we understand the definition of both as they are being used. After all, there are as many definitions of growth and value as there are investors with an opinion.
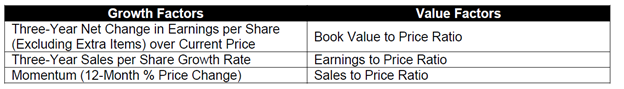
The S&P 500 uses three factors to determine the construction for the S&P Growth and Value indices. A raw value is calculated for each stock in the S&P Total Market Index universe. The values are then further standardized and a Growth score and Value score is computed for each company. The index constituents are then sorted in ascending order of the ratio of Growth Rank/Value Rank. Companies at the top of the list that comprise 33% of the index are designated as the Growth basket while those at the bottom are designated the Value basket. Those in the middle third exhibit some combination of Growth and Value characteristics. Because some of the stocks in the middle third exhibit combinations of growth and value, the S&P 500 Growth and S&P 500 Value indices might have some overlap.
Consider that the S&P 500 Growth has 239 constituents, and the S&P Value index has 439 names – indicating that a greater number of stocks with high Value factors also have some level of Growth factors.
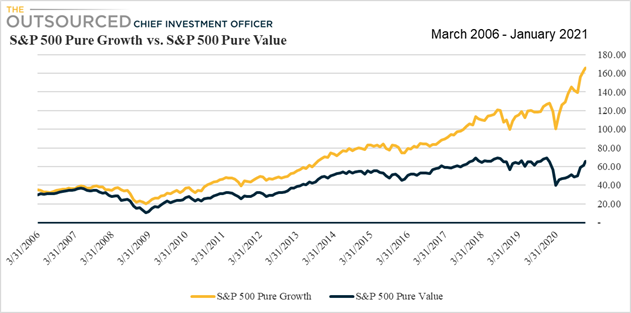
Only the Pure Growth and Pure Value Style Index Series for the S&P has no overlap and we will look at those in more detail later.
The Russell indexes use their own set of variables to determine growth and value besides using a universe of 1000 stocks that make up the Russell 1000 for it’s Large Cap indices. However, while the specific methodology differs, the focus on earnings growth and valuation as key variables is similar across both indices.
My definition of a growth stock versus a value stock is quite simple. A growth stock investor would likely be willing to pay to invest in a stock with a higher PE provided the earnings for that company are expected to grow rapidly. In this case, the investor assumes the PE ratio would remain at the same level, while earnings would increase, providing the investor a return based on the price increase that would maintain the current PE ratio. For example, an investor might buy a stock with a PE ratio of 40 at a price of $80 with earnings per share of $2. If earnings are expected to grow by 25% to $2.50, a PE ratio of 40 would indicate a price of $100, and the return on the $80 investment would be 25%.
A Value stock, on the other hand, is a stock whose price has declined to a point where the intrinsic value of the company is higher than the price indicated by the stock. The PE multiple on this stock is likely depressed based on being out of favor with investors. A value investor might be willing to pay a price equal to a PE multiple of 15 for a stock that is currently trading at a PE multiple of 12. Putting potential earnings growth aside, if the investor is correct, a PE multiple of 15 without any change in earnings would result in a return of 25%. Reasons for the multiple expansion might include a solid balance sheet, stable earnings, an attractive dividend, etc., but not necessarily rapid earnings growth.
Either approach can result in outperformance depending on the specific time frame evaluated, but which one is better?
Which is Better?
Growth stocks, in general, have the potential to perform better when interest rates are falling and company earnings are rising. However, they may also be punished more harshly when results fall short of expectations. If their valuations are driven by expected earnings growth, any sign of slower growth would cause investors to sell.
Value stocks, on the other hand, are often stocks of cyclical industries that tend to do well early in an economic recovery but lag in a sustained bull market. Since we’ve had a 10 year sustained bull market until Covid pandemic hit, it’s not surprising that Growth has outperformed Value. But as both Value and Growth recovered throughout 2020, it has been Growth stocks’ surge that has pushed the S&P 500 to multiple new records with the three largest companies each now exceeding $1 trillion in market cap. As the vaccine for Covid was approved and started to be distributed, Value stocks have become more attractive with expectations of a return to normal.
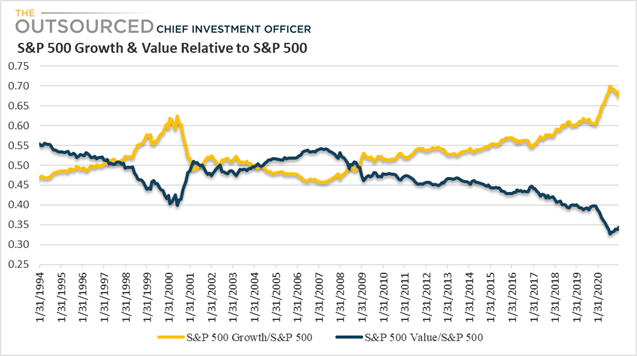
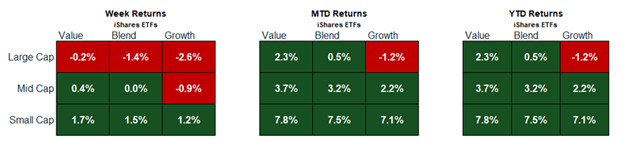
Which one is better depends on many factors including the economic environment, the sector or industry exposures sought, or even the level of diversification we are looking for. Since 2009, the S&P 500 Growth index has outperformed the S&P 500 Value index, but looking back to 1994, there are several periods where Value stocks shined. One thing is certain, however, from looking at the chart below. The gap between the level of the S&P 500 Growth and S&P 500 Value relative to the broader index hasn’t been this wide in decades.
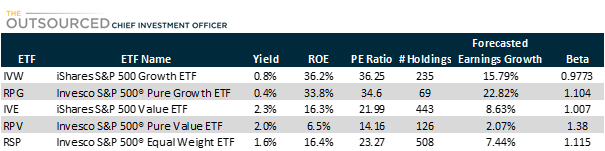
As I mentioned earlier, many of the stocks in the S&P 500 Growth Index are also included in the S&P 500 Value Index, even if their weights are relatively small. However, the S&P also provides a Pure Growth and Pure Value index. These indices not only eliminate overlap between the two indices, they are also style-weighted, so that companies with a higher growth score would have a higher allocation regardless of it’s market cap. The performance comparison of these two indices also shows growth outperformance but a close look at the Pure Value index performance hardly seems like a bubble. In fact, while the S&P Pure Growth index is 30% higher than it was at the end of 2019, The Pure Value index is still 5% below that level.
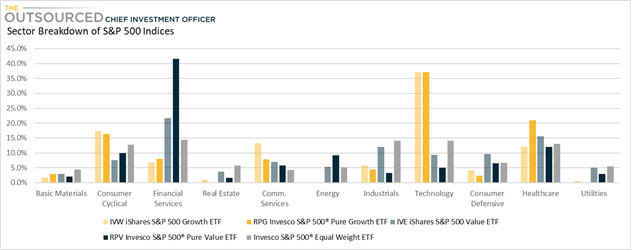
If the S&P 500 Growth Index is in a bubble but the S&P 500 Value Index is not, wouldn’t it be prudent to reallocate from Growth to Value? A shift from Growth to Value will undoubtedly mean a rotation out of Technology, Healthcare, and Consumer Discretionary stocks and into Financials, Industrials, Consumer Staples, and Utilities. The extent of that rotation depends on whether the shift is into the S&P 500 Value index, which as discussed earlier, has considerable overlap with the S&P 500 Growth, or if capital goes into the S&P 500 Pure Value index. One glaring drawback of the S&P 500 Pure Value Index for investors looking for diversification is that the index has a disproportionally high allocation to Financials – over 40%.
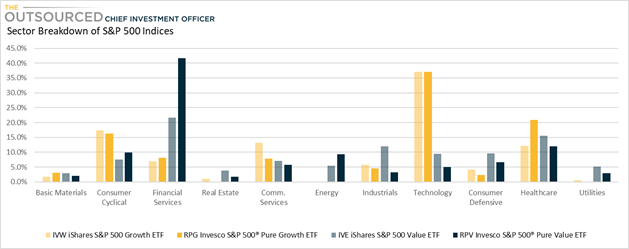
Yet another option that would provide greater diversification while still resulting in a rotation into sectors with less lofty valuations is to reallocate large cap exposure into the Invesco S&P 500 Equal Weight ETF (RSP). This move will also decrease exposure to Technology while increasing some of the sectors deemed to have a greater Value tilt, but without having disproportionate exposure to any one sector. The sector allocation of the equal weighted index is shown in gray below.
Risks
The risk of investing in one style versus another is not dissimilar to investing in one sector vs. another. By overweighting towards a specific style, you risk that style underperforming for an extended period of time. It’s hard to argue that the S&P 500 is in a bubble or that the S&P 500 Growth Index is in a bigger bubble. But stock prices of the stocks that make up these indices could continue to rise along with those sectors that have driven performance thus far. The last time the relative PE ratio of Growth versus Value was this high, Growth stocks continued to climb, and it is possible it could happen again – see chart below.
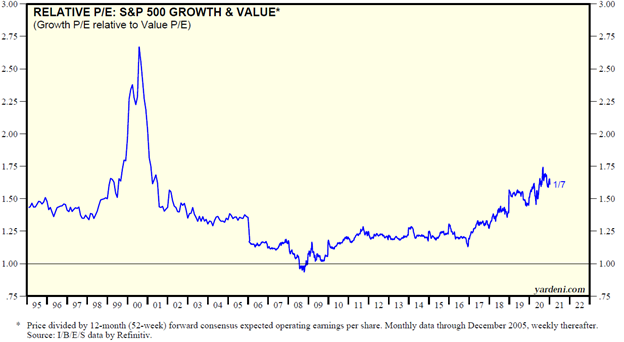
Source: Yardeni Research
An overweight to Value in that case would therefore result in underperformance, at least until the bubble bursts, and even then, Value stocks might still sell off along with Growth stocks. I would argue that they would likely decline less.
Conclusion
Other than going to cash, which I don’t recommend (other than expecting to be fully invested with the funds clients confide in me to invest, many reports have been published regarding DIY investor underperformance because of the difficulty of timing the market), there are tactical allocations investors can make right now to be better positioned for the eventual bubble burst. Value has already started outperforming Growth in anticipation of a recovery in sectors and industries most hurt by the effects of the pandemic.
In our portfolios, we are reallocating our Large Cap exposure into the Invesco S&P 500 Equal Weight ETF (RSP), to increase diversification across sectors and more evenly distribute large cap exposure across a greater number of stocks. And we are also slightly tilting towards Value using the Invesco S&P 500 Pure Value ETF (RPV).
© The Outsourced Chief Investment Officer