Some Data May Be Showing Signs of a Short-Term Pause in Home Sales
As existing home sales reach a 14-year high, it’s easy to feel a sense that housing will lead an economic recovery. Housing has been a catalyst for economic growth in the past and it is one of the few bright spots in an economy that has suffered through a pandemic and the lingering effects of business closures, social distancing measures, and consumer cautiousness both of the virus and the vaccine that is supposed to help halt the spread.
Despite positive news around both new and existing home sales, however, there are cracks starting to show in some of the underlying data that leaves the impact of housing on future economic growth somewhat suspect.
The recent surge in home sales has helped the homeownership rate recover back up to a 10-year high of 68% but it wasn’t long ago that millennials were thought to prefer the urban lifestyle, postponing a home purchase for years beyond the age when previous generations became homeowners. But the pandemic along with historically low mortgage rates has driven urbanites to give up their apartments and condos downtown and move to the suburbs in search of single family homes in good school districts, with basement office space, and generally more space to move around in.
The Fed Has Been a Big Catalyst
The process has been helped by the accommodative policies of the Fed, with Jay Powell continuing to claim that rates will remain low for the foreseeable future even if inflation does start to creep up. This time, according to Powell, we will overshoot on inflation in order to bring the average inflation rate to 2%. With inflation having remained below 2% for years, it will take a long time of above trend inflation to get the long-term average back to 2%.
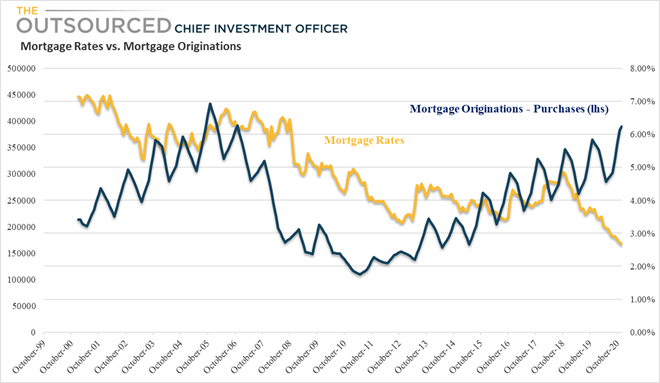
With the Fed keeping rates so low and it’s purchase of more than a trillion dollars worth of mortgages, mortgage rates have declined to historic lows, reaching 2.67% in December 2020 and increasing affordability for many homebuyers that otherwise might not be able to buy a home. As the mortgage payment to rent ratio has declined, the financial benefit of owning versus renting has become much more attractive.
New Home Sales Still Well Below Previous Peak
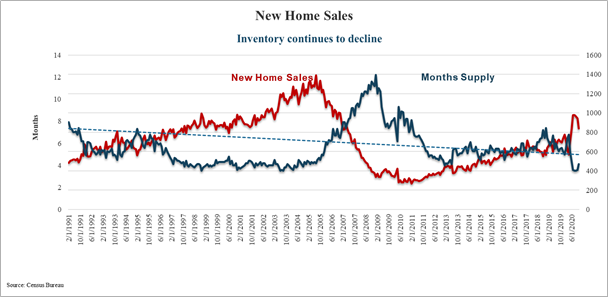
New home sales fluctuate based on building activity, which is driven by current and anticipated demand for housing. With inventory levels of homes for sale at historic lows, builders have been stepping up activity. We witnessed a similar increase in new home sales that occurred at a much faster pace in the run up to the housing collapse that preceded the Great Recession. In the rise towards the 2005-2006 housing market bubble, new home sales had increased from just above 400K homes in 1991 to 1.4 million homes by mid-2005. The months of inventory supply in 2005 when new homes sales peaked at that time was at around 4 months. That figure indicates that at the current pace of sales, current inventory of homes for sale would be sold in 4 months. The current level of supply stands at 4.1 months, but the level of new home sales has yet to surpass the one million mark. The current level might initially indicate plenty of runway remaining before sales reach their previous peak, but other data shows the trend may not be sustainable.
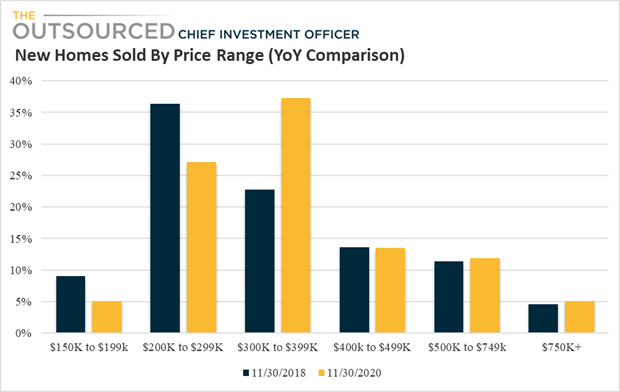
The average price of new homes sold has crept up in the last couple of years and this shift to higher priced homes, particularly in the lower price categories, is a strong indication of where builders are focused and where the biggest price increases may be occurring. In November 2020, 36% of new homes sold were priced between $300K and $399K, a sharp increase from two years ago, when most new homes sold were in the $200K to $299K range.
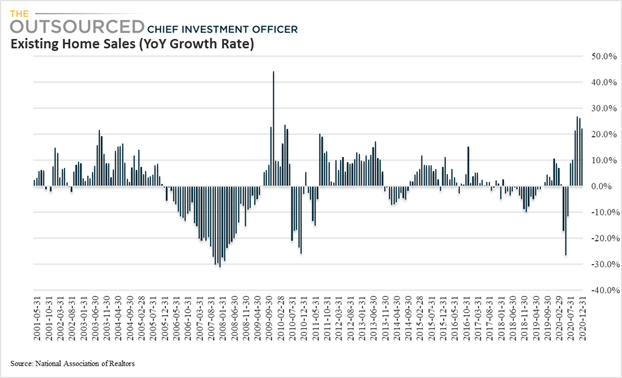
Existing Home Sales Spike to Within Reach of Historic High
Existing home sales, on the other hand, are quickly approaching an annualized rate of 7 million homes, much closer to levels reached during the previous housing boom. The supply of existing homes for sale, however, is even lower than the inventory of new homes, at just 1.9 months. The low inventory is causing many buyers to pay above asking, driving up prices and impacting affordability even while mortgage rates hover at historic lows.
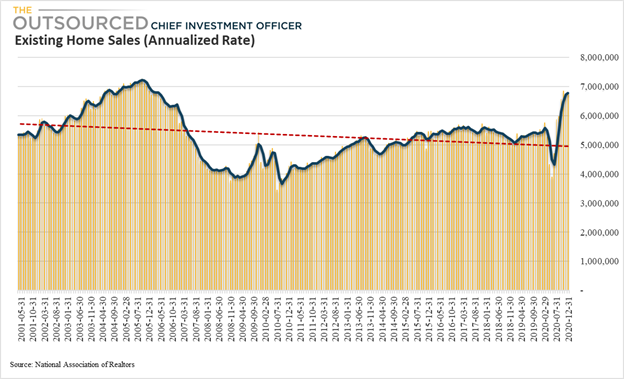
Before the pandemic, the annualized rate of existing home sales was around 5.5 million and only after the initial decline caused by the pandemic, did demand spike up to current levels. Recent growth has surpassed 20% for four consecutive months.
Looking Forward Can This Pace of Sales Continue?
While the recent home sales data has been positive, there are indications that the party may be closer to last call than the sound of the first bottle being popped open.
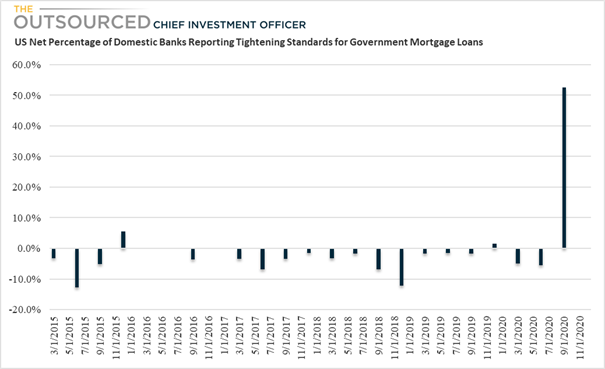
Banks are starting to report tightening standards for government backed mortgage loans and similar tightening is being reported for subprime mortgages. Tightening standards means that even willing home buyers may no longer qualify for financing under the newer guidelines, muting any impact of an improvement in affordability. For the past 5 years, the net percentage of banks reporting tightening standards has remained low or been negative, until Q3 2020, when the net percentage jumped to 53%. Borrowers looking for financing had best ensure they have enough saved for a down payment, adequate debt/income ratios, and a reasonable credit score.
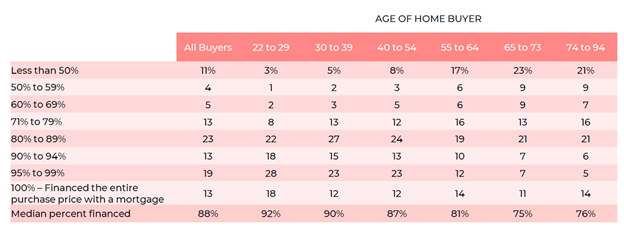
These are some of the primary reasons many borrowers are not qualifying for mortgages. In a 2020 NAR Home Buyer and Seller Generational Trends Survey, 78% of all borrowers surveyed required financing of at least 80% of the purchase price.
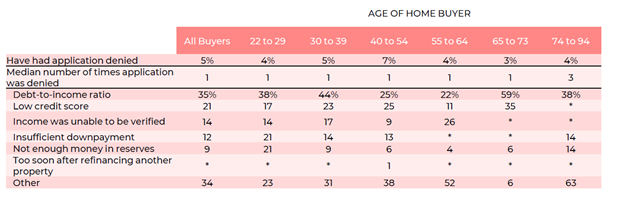
Buyers surveyed were also asked about denials of applications and the reasons why lenders declined their loans. A full 35% of all buyers did not meet required debt/income ratios while another 21% had a credit score that did not qualify. The top 4 reasons were rounded out by income that could not be verified and an insufficient down payment. So while a 20% down payment on the average new home price of $390K is only $78K, 12% of borrowers didn’t have enough. Based on more recent trends in tightening underwriting standards, qualifying for a mortgage could be even more difficult than the survey would indicate – as it was completed before the recently reported tightening standards by banks.
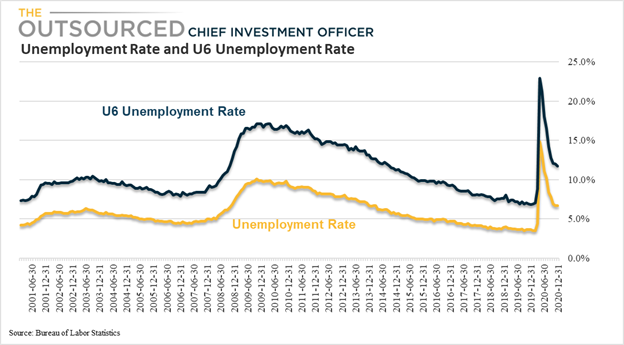
The situation for housing is not helped by the stagnation in the labor market. Despite a rapid decline in the unemployment rate as many businesses started reopening, the unemployment rate is still sitting at 6.7%. At last estimate, that was approximately 10 million workers. With so many consumers out of work and banks requiring higher credit scores to qualify for both conventional and subprime mortgages, it might be hard to sustain the current trend in home sales.
No Jobs No Buying Stuff
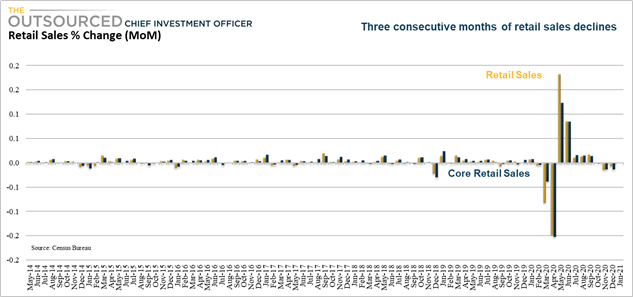
And while the stimulus checks and expanded unemployment benefits may have propped up part of the economy, Retail sales have now declined for three consecutive months, confirming several reports that much of the stimulus funds have been allocated to either paying bills or savings.
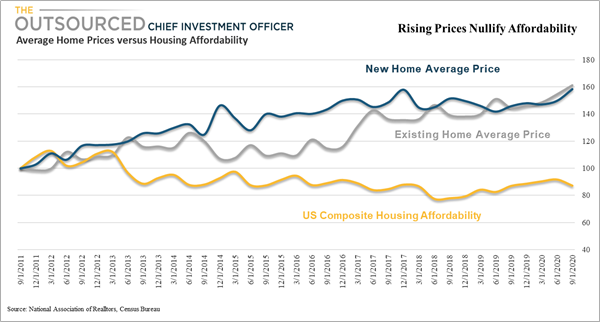
From a consumer’s standpoint, affordability is higher than it otherwise would be if mortgage rates were higher, but affordability has been declining since 2012, partly due to the disproportionate rise in the average sales price of both existing and new homes. While the average sales price of new and existing home prices has increased by 53% and 61% since 2012, the US Composite Housing Affordability Index has declined by 13%.
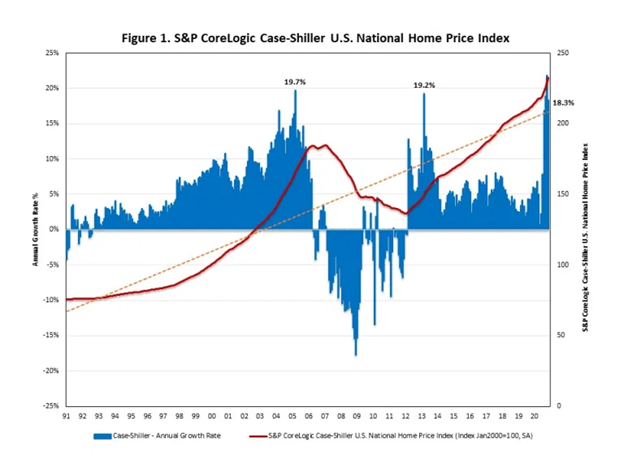
This trend doesn’t seem to be reversing any time soon and this week’s release of the S&P Core Logic Case-Shiller US National Home Price Index confirms it. It rose at a seasonally adjusted annual growth rate of 18.3% in November, after a 21.9% increase in October. With inventory levels even lower now than they were in October, another double digit increase in December is likely.
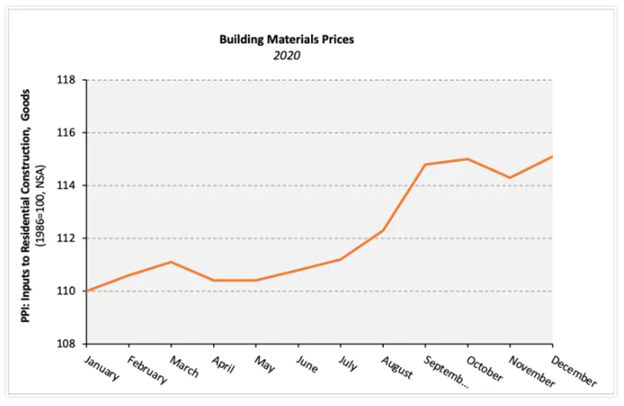
In addition to prices being driven up by strong demand combined with little inventory, home builders are reporting an increase in prices of building materials that will eventually make it’s way through the supply chain and will also lead to higher asking prices for new homes still not completed. PPI Inputs related to Residential Construction have accelerated throughout the year, including gypsum, concrete, and other construction materials. Lumber prices alone were up over 35% in 2020.
Builder confidence also declined slightly last month and banks reported the first annual decline in commercial real estate loans since 2014.
The iShares US Home Construction ETF (ITB), which holds approximately 46 stocks of companies involved in home construction, from home builders to home improvement retailers to materials, to flooring, etc, is up another 11% in 2021 after a 26% return in 2020. The price is driven by many of the fundamentals mentioned here regarding demand for homes and low inventory levels as well as the increase in building permits which forecasts more construction. But if rates rise, banks tighten standards, and jobs are fleeting, demand may fall short of expectations. That would be bad for both builders and the economy.
There is some hope. According to an analysis by Berenberg Economics mentioned in the Wall Street Journal, Americans saved $1.4 trillion through the first three quarters of 2020, about twice as much as they saved in the prior year. If those funds are eventually used on goods and services or continuing demand for home buying, the economy and housing may continue to expand.
I have always been a long-term bull on real estate but the level of uncertainty around a return to normalcy and increasing difficulty for would be buyers to qualify for mortgage financing dampens my enthusiasm for further gains in homebuilders and other housing related themes.
© The Outsourced Chief Investment Officer