Risks of High Equity Valuations Present Tactical Opportunities
Despite patchy distribution of the vaccine and a labor market that is only modestly improving, the S&P 500 continued it’s ascent to new records until last week. Until then, investors seemed to be more focused on the increase in the number of vaccines being provided and the hope that a return to normal will come sooner rather than later – but equity valuations are looking stretched for the S&P 500 even after this week’s Tech-led pullback, fueling concern that the index is in bubble territory and could fall further. Our view is that the S&P 500 IS overvalued, but prudent tactical shifts in allocations might still provide investors with decent returns.
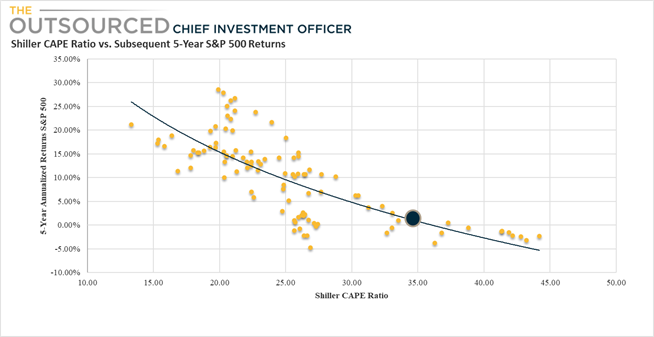
The current level of equity valuations is important for investors because history suggests that valuations have a noticeable impact on returns in subsequent years – when valuations are high, subsequent returns suffer, and vice-versa. For example, when the Shiller CAPE ratio has historically been at levels similar to the 34.5 it is today, the subsequent 5-year annualized returns on the S&P 500 have never been more than 5% – and may likely fall below even those lowered expectations. Rarely does the S&P 500 have 5-year returns greater than 5% when the Shiller CAPE ratio hits 30.
However, with interest rates at historical lows, equity valuations can arguably be higher than they were at prior peaks. After all, the value of equities are based on expected future cash flows discounted at the required rate of return – so as interest rates decline, equity valuations rise.
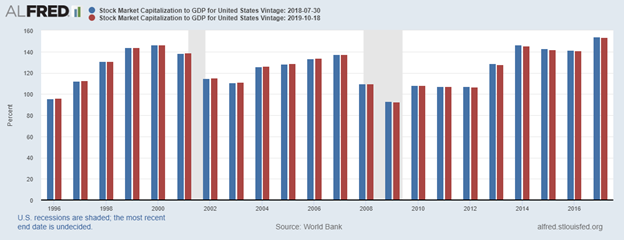
A recovery in earnings growth might also provide downside support in the event of a market pullback. Analysts are forecasting earnings to rise to record levels in 2021 and 2022 and these forecasts could be conservative considering analysts tend to underestimate earnings coming out of recessions. On a forward PE ratio basis, the S&P 500 looks less frothy but still overvalued at 22 times. Another well-known valuation metric and one favored by legendary investor Warren Buffett, also suggests valuations are at extreme levels. On two of the three prior occasions when the market cap to GDP ratio reached current levels, the stock market entered a prolonged bear market and the US economy entered recession. However, investors holding out hope for considerably more upside can point to 2014 – market cap to GDP what was at the time an all-time high, yet the market continued to rise for 7 more years even after disappointing 2015 and a modest decline in 2018.
Vaccine Roll Outs Drive Optimism for Return to Normal
The roll out of the vaccine, with it’s own set of challenges of distribution and the question of who should be prioritized to receive the vaccine, is in itself a harbinger of hope that a return to normal is approaching. The pace of inoculations trails the number of doses being delivered by vaccine providers so if we can get the logistics right, we could potentially reach herd immunity by this Summer. As the average number of vaccines per day approaches 1.5M, the date targeted for the US to reach herd immunity gets closer and closer.
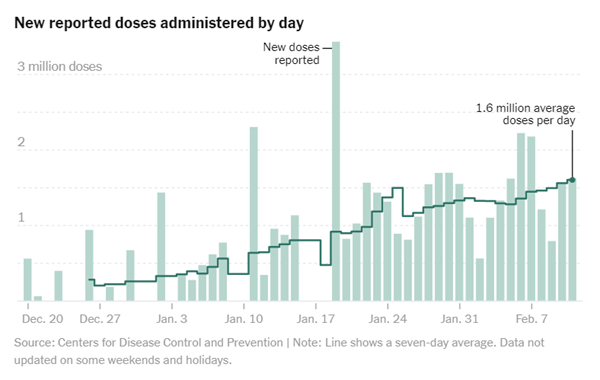
The administration of vaccines is not consistent across States however, so while we could see a gradual normalization – the pace of economic improvement will be uneven.
As temperatures begin to warm up, the combination of vaccines and outdoor activities could lead to an accelerating decline in new cases.
There is still the threat of the South African strain and others that are more easily transmittable as well as the question of the efficacy of any of the vaccines against the new strains, but early reports suggest the vaccines are still highly efficient even if not as effective on the new strains as the strain they were designed to prevent.
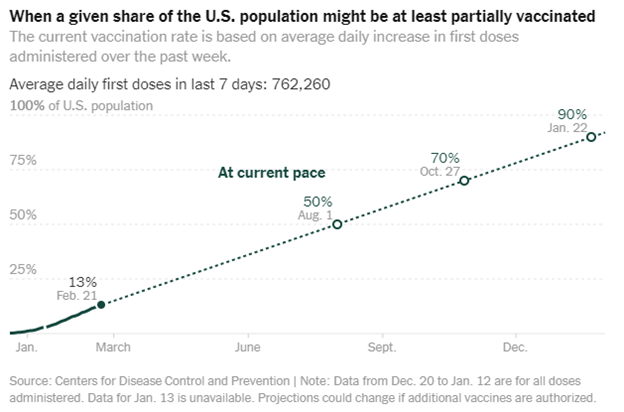
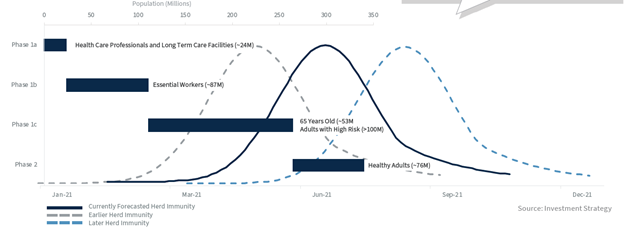
At the current pace of vaccinations, 50% of the population in the US could have the vaccine by late June and 70% by the start of September. Of course, the daily pace of vaccines may accelerate further as logistics improve and additional vaccines get FDA approval.
An estimate by Raymond James seems a bit optimistic – suggesting that 300 million people in the US will be inoculated by June in their base case scenario, with earlier herd immunity potentially being reached by April-May. In the most pessimistic scenario, herd immunity will be reached by September.
Are Equity Valuations Justified? CAPE vs. 10-Year Rates
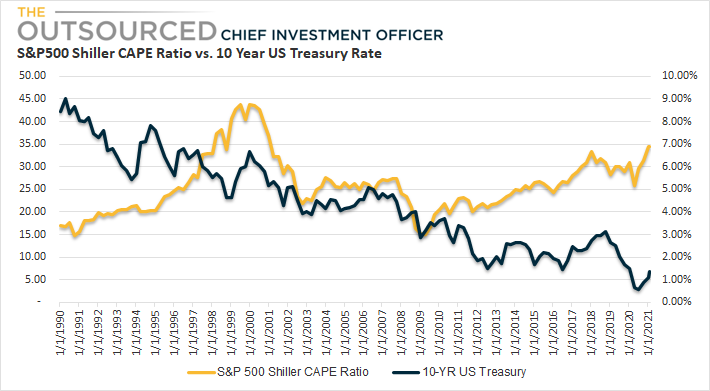
With a return to normal on the horizon, it’s not surprising to see optimism being expressed within equity markets. But what of the seemingly high equity valuations? While the Shiller CAPE ratio is at extreme levels to the upside, interest rates are at extreme levels to the downside. Even with the recent rise in 10-year US Treasury rates, rates remain within 50bps of all-time lows.
Investors relying on a discounted cash flow approach to value securities, therefore, might argue that lower interest rates justify the higher valuations. The 10Yr Treasury was above 6% at the height of the market in 1999-2000 and just below 5% before the Great Financial Crisis in 2008. Since then, rates have continued to decline while the S&P 500 has hit record after record.
It’s worth pointing out, however, that performance of the constituents within the S&P 500 was anything but uniform over this period. Stocks of the top 25th percentile returned 20% annualized over the last 10 years, while those in the bottom 25th percentile returned a respectable but less enthusiastic 8%. The top 5th percentile outperformed the average of the index constituents by 2 to 1. (29% vs. 13.7%). Helping the market-cap weighted index reach new highs were the 5 largest companies by market cap with annualized returns in excess of 20%. So while the overall index looks overvalued, not all stocks participated in the current bull market to the same degree – and are far from being overvalued.
Dividend Yield Spread – Potential Shifts to Fixed Income
If ‘headline’ equity valuations aren’t enough to spook investors out of stocks, there are some risks that investors recently buying dividend paying stocks in their search for yield may soon reverse course. Interest rates are on the rise and where income investors were previously willing to take on some volatility in stocks in exchange for dividends, higher rates and a steeper yield curve allow them to refocus their efforts on traditional fixed income investments, including bond laddering to minimize the duration effect of further rate increases.
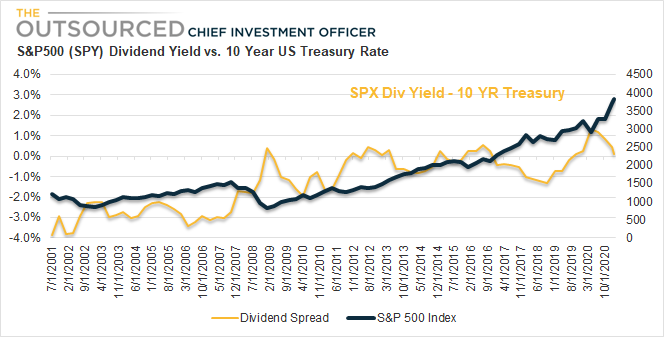
The spread between the dividend yield on the S&P 500 and 10-Year Treasury rate exceeded 1% before the pandemic hit, but has since disappeared as the market continued to rise along with rates – while dividends remained relatively flat or were cut. For some income investors, the dividend yield on the S&P 500 may still be more attractive than 10-year rates, but it is becoming increasingly less so.
If the trend continues, we may see a rotation back into fixed income – which would further limit upside in equities or exacerbate a sell-off.
Consumer Sentiment Diverges from S&P 500
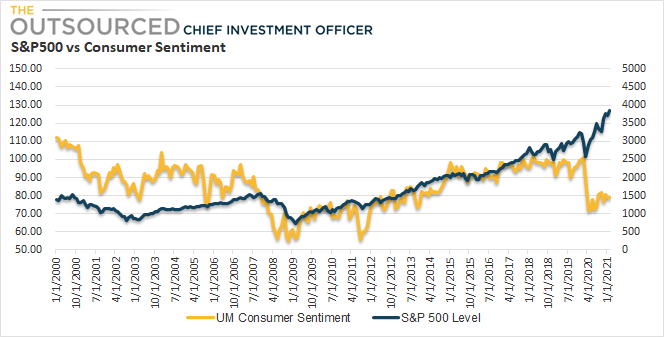
Yet another metric that points to pressure on the S&P 500 is the relationship between Consumer Sentiment (CS) and the index. The S&P 500 has closely tracked the CS Sentiment index going back to 2000 but has diverged over the last 3 years as CS remained elevated. With the recent sharp decline in CS, the gap between the two has become a chasm – and although a quick recovery in sentiment could close the gap, it’s quite possible that the S&P 500 would decline as well.
Tactical Active Management Is Back
When referring to an overvalued market, the reference is to the S&P 500, which, as it’s name suggests, is made up of 500 stocks. Naturally, not all stocks have set multiple new records in the last 12 months and most aren’t as expensive as the overall index might suggest. The returns on the S&P 500 over the last several years have been driven by the returns of several of the largest mega cap tech companies in the world – and they do look like they are in bubble territory.
However, good stock picking might uncover attractive companies that may have been victims of the impact of the pandemic and could readily return to stable if not pre-pandemic levels in the intermediate term. These stocks might be undervalued – if not deeply undervalued – and could be poised for both earnings growth and multiple expansion as the economy recovers.
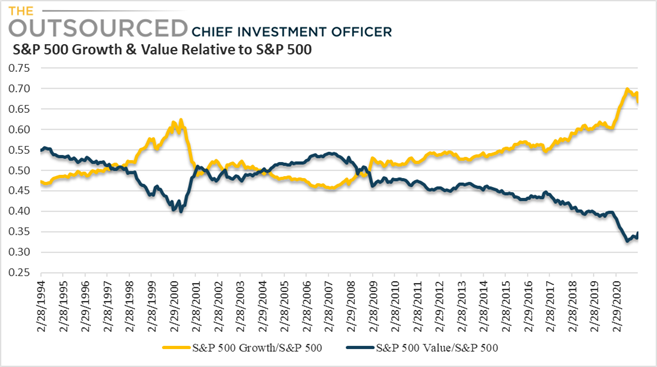
In fact, the stocks that have driven the index’s outperformance have been growth stocks, while laggards have primarily been in the value style. Going back to 1994, there have been periods of both Value and Growth outperformance and while previous cycles of outperformance have shifted every 3-5 years, the current period of growth outperformance is 12 years. It might be time for that trend to reverse.
We concur that there are indications that the S&P 500 is overvalued, but don’t see the ‘irrational exuberance’ that leads to asset bubbles. There are certainly some stocks trading at prices that might not reflect fundamentals, but despite our opinion that not all stocks in the index are pricey, a pullback would likely result in price declines across many of the index constituents, including both growth and value stocks.
We believe the hardest to fall will be stocks whose prices reflect continued strong revenue and earnings growth that will likely fall short of expectations. When these companies fail to meet unrealistic growth rates, fundamentals will come back into focus, and investors will begin to cut and run.
Conclusion
There is no doubt that the S&P 500 index looks overvalued at current levels and further upside could be limited. However, there are components of the S&P 500 that still have attractive risk/return characteristics. A passive allocation to the S&P 500 results in a 20% allocation to the largest 5 companies in the index – all of which fit squarely in the ‘overvalued’ category. Our approach to US Large Cap exposure is to move away from the top holdings in the index and the following tactical allocations:
- Reduce overall exposure to US Large Caps and increase exposure to Small Caps and non-US equities.
- Within US Large Caps, overweight Value over Growth
- For broad exposure to the S&P, use an equal-weighted ETF, not market-cap weighted.
© The Outsourced Chief Investment Officer