The long-awaited repricing may finally be upon us but it’s not for the reasons anyone expected this market selloff. With the CAPE Shiller Ratio above 34, US large caps were looking stretched after a strong 2020 and the word ‘bubble’ started appearing frequently in stock market commentaries. Valuations were particularly disturbing within Tech stocks, which have led the run up in the S&P 500 to multiple new records and now make up almost 1/4th of the index.
Earlier this year it seemed there would be a smooth transition in market leadership from Growth to Value and from Large Cap to Small Caps as the economy showed signs of renewed growth, but then as rates spiked, equities sold off across the board.
Sparking the market selloff was an increase in rates due to expectations of stronger economic growth and reiteration by the Fed that it would maintain rates at accommodative levels indefinitely – leading to fears of higher than expected inflation levels that would undermine the resumption of another bull market. In other words, the market is calling the Fed’s bluff.
While we are positive on equities overall, we appreciate the sensitivity of the market and the fact we are in uncharted territory as it relates to the size of the Fed’s balance sheet and the potential disruption an unwinding would cause or an unmanageable spike in inflation.
We believe the repricing was imminent but did not expect it to occur with such violent force nor did we expect it to coincide with a selloff in fixed income as well.
Inflation will Run Higher Than Recent Trends
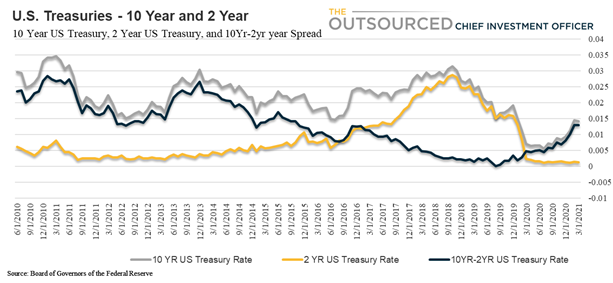
With inflation expectations surfacing and short-term rates anchored, rates on the long end spiked – further steepening the yield curve. The spread between the 10 year and 2-year Treasury is now at it’s widest since December 2016, but this time it has been driven entirely by the rise in the 10-year.
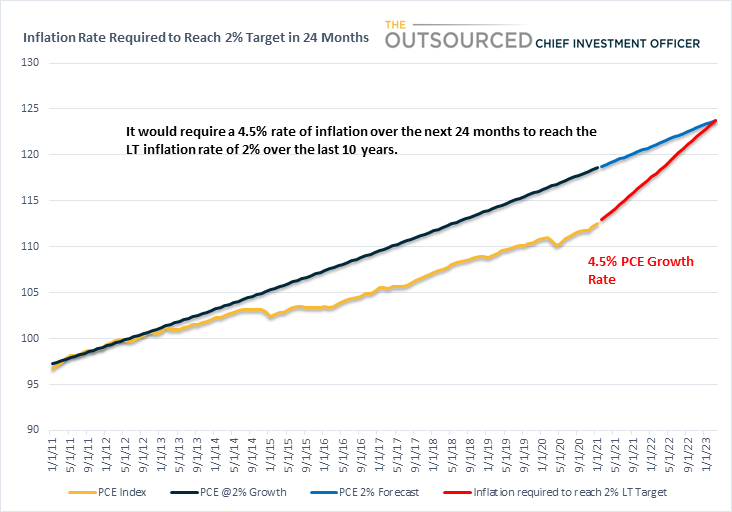
A spike in inflation would normally cause the Fed to react by raising rates, but the Fed’s current approach is a marked difference from years past when it would start to raise rates in anticipation of, not the presence of, inflation. With inflation remaining well below target levels for years despite accommodative policy, the Fed has changed it’s approach to allow for inflation to run above 2% for as long as necessary to bring the level of pricing up to trend. Just how high inflation must run to bring the 10-year average inflation rate to 2%? It depends on the time-period considered, but our analysis shows that inflation must run high for at least a couple of years to bring the long-term inflation rate up to 2%.
We arbitrarily picked the last 10-year period and calculated the PCE index at a 2% annualized inflation rate versus the current level of the PCE index. We then extrapolated the 2% rate for the next 24 months and calculated the level of inflation required for the PCE index to reach the level required to average 2% annually. Over a two-year period, it would take a 4.5% rate of inflation for the PCE index to close the gap. A 4.5% level of inflation would be high by recent historical comparison, but should not be unmanageable. So perhaps the market is expecting inflation to be even higher.
The increase in the 10-Year was in reaction to the Fed’s reiteration of staying the course despite the potential of higher inflation down the road. While inflation remains muted (below 2%) there are underlying factors that suggest prices are increasing and it’s a matter of time before it filters through to the more popular measures of inflation. As we discuss later, the spike in Personal Income and the high level of savings is seen as an additional boost to prices as those savings are spent.
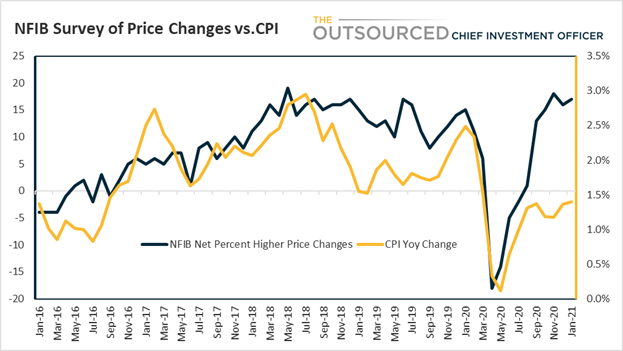
The NFIB survey last month suggested that small businesses are likely to increase prices this year and that input price increases are running higher than output prices. Input price increases usually make their way through the supply chain with a lag until they reach the consumer, as businesses increase prices to maintain profitability. The current level of NFIB owners suggesting higher price changes implies a CPI growth rate of closer to 3%.
There are other noticeable increases in prices such as lumber, oil and gas, shipping rates, and food prices.
No Premium for Growth and a Shift to Fixed Income
Better economic growth is generally positive for equities but the market selloff is indicative of discounting the uncertainty of a negative inflation surprise curtailing further upside. With government stimulus flooding the economy with liquidity, there are concerns about how this all gets unwound without leading to chaos.
We believe there were two primary reasons for the sell off and particularly the underperformance of growth versus value stocks. Broad economic growth benefits a wider swath of the economy and with growth prevalent, investors are less inclined to pay a premium for earnings growth. With the PE ratio of the S&P 500 Growth index at 35, Value stocks trading at just 22 times earnings in a high growth environment are much more attractive and the higher rates hurt valuations of growth stocks more than value stocks. Furthermore, the multi-year outperformance of growth over value has extended far longer than anticipated and a shift in market leadership was long overdue.
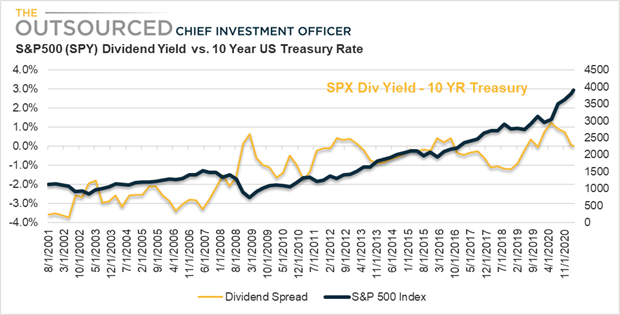
Yet another driver of the market selloff is that with a rise in longer term rates, the 10-Year Treasury rate is now back to the same levels as the Dividend Yield on the S&P 500. Income investors will be less inclined to accept the inherently higher volatility of stocks in their search for yield when they can now obtain it from risk-free bonds. For years income investors have had no other alternative to generate income from their portfolios with rates remaining at historically low levels.
Improving yields available in the fixed income market may prove to be additional headwinds for further upside to equities, although we’ve mentioned before that value stocks look fairly valued.
Personal Income Increase Is Misleading
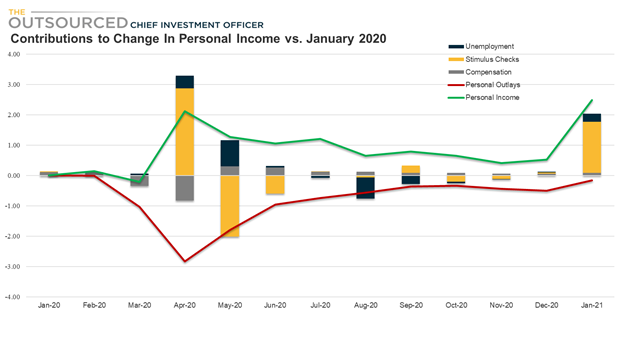
We mentioned earlier that the spike in Personal Income may also have contributed to estimates of economic growth with expectations of savings coming off the sidelines and into goods and services. These revised growth estimates are despite a still tepid labor market. A look at the details, however, reveals that all of the increase in Personal Income was due to government stimulus checks and unemployment benefits and, in our opinion,, these are not the types of personal income increases that compel consumers to spend.
With another stimulus bill likely to get passed in some form, another boost to personal income is likely in the near-term, and a good portion of any additional stimulus or unemployment benefits will likely go into savings, as it has over the past year. Some of the funds will be spent, of course, but last month the Savings rate increased to 20%, as consumers make sure they put money away in the event their job prospects remain bleak or government assistance ends.
Personal Income only leads to increases in spending when the income comes primarily from compensation. As previously mentioned, the increase in personal income over the last 12 months compared to January 2020 is entirely due to temporary payments. Compensation, which is represented by the Gray bars below, has been inconsistent and is barely at pre-pandemic levels. Interestingly, the level of Personal Outlays is still below levels from early in 2020, indicating that despite the sustainability of Personal Income, consumers have been reluctant to spend. Savings rates have ranged from 13% to 34% since March 2020 and as a percent of compensation, the savings rate has been as high as 60% and has averaged 45% in months where either stimulus checks or unemployment benefits were high.
Contrary to some opinions that Savings will flood the market for goods and services, we believe Savings as a result of fear and uncertainty will remain put away until the pandemic is under control and the labor market shows sustainable signs of a recovery. Savings will eventually get spent, but it is much more likely to trickle out than flood the economy as the unemployment rate declines and the 10 million people that are currently out of work today start receiving regular paychecks.
Conclusion
We believe the economy is recovering and will lead to further equity upside as earnings growth reaches record levels, even as long-term rates continue to rise. This will lead to further yield curve steepening as well as a shift in leadership within equities towards cyclicals with more attractive relative valuations. We have already started seeing this trend and are only in the beginning innings of a multi-year period of Value outperformance.
We remain optimistic on further equity gains but are cautious on stocks with stretched valuations and high expectations. As rates rise, valuations decline, and any earnings miss could lead to aggressive sell offs in some of the stocks that have led the market higher over the last 5 years.
We believe this phase of the cycle warrants an equal-weighted approach and a market selloff is an opportunity to add to companies highly sensitive to economic growth as well as real assets.
Fixed income opportunities will also become more interesting as bond investing strategies come into focus. After years of a relatively flat yield curve and historically low interest rates, a return to more reasonable rates and a higher term premium are welcome news for income investors.
© The Outsourced Chief Investment Officer