With covid cases trending upwards once again, the likely driver of GDP growth over the next few quarters remains the country’s ability to control the spread of the virus and continue to drive down the number of new cases. The same effects apply to equity markets, with the primary driver of stock returns contingent on the number of new cases and the direction of interest rates – which have been reacting strongly to changes in growth expectations.
As cases rise, for example, interest rates decline and growth stocks lead equity markets. But when cases decline and the prospects of a potential resurgence of economic activity drives rates up – value stocks outperform.
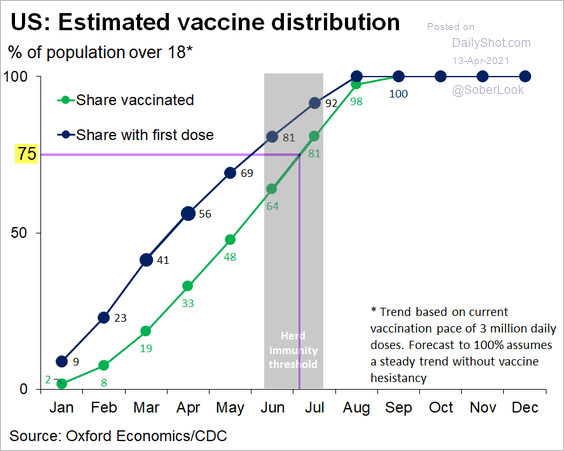
Meanwhile, vaccinations are making their way to those willing to get it and at the current distribution rate, we could potentially have 100% of the population inoculated by September. Unfortunately, the J&J vaccine has now been paused, slowing down the pace of inoculations and extending the time it will take to reach herd immunity.
Once we reach a considerable percentage of the population, the focus then turns to the Fed and inflation and how long the Fed will maintain it’s low-rate stance amid rising prices. It could be a while before inflation starts to impact economic growth or it could happen quickly – opinions vary widely.
Inflation Risk: High or Low?
The latest CPI number suggests inflation is already in the system, with a 2.6% rise in the index on a year over year basis. That is almost a full percentage point higher than last month’s reading and follows a similarly higher than consensus PPI reading earlier in the week. Keep in mind however that both of the recent readings compare to a low base level from last year. The month over month increase, on the other hand, did not have a low base and it did come in a bit hot. With the Fed’s stance to allow inflation to exceed it’s long-term target for a considerable time, it could be concerning if they are already behind the curve.
The counter-argument is that there is still considerable slack in the labor market with many potential workers still not being included in the labor force. The low level of labor force participation means there is still a long way to go to reach full employment and Argus Research suggests the unemployment rate needs to be near 4% before the Fed starts to raise rates again. Will that be too late?
Growth is Ramping Up
With economic growth accelerating, some GDP growth estimates for 2021 have been revised upwards to as high as 8%, with the consensus for this year at around 5.5%. There will be hiccups along the way as the direction of new cases changes, but a general lifting of lockdowns happening state by state should lead to robust growth – even if cases don’t disappear altogether.
We believe the latter will be the key driver of positive economic growth eventually leading to economic acceleration. As vaccines are administered and consumers that have been cooped up resume normal levels of spending it will add fuel to the recovery that has already been jump-started by government stimulus distributed on three prior occasions. Interestingly, distributions have increasingly gone into savings, which will likely result in an initial pop in spending before leveling off.
Personal Income and Components
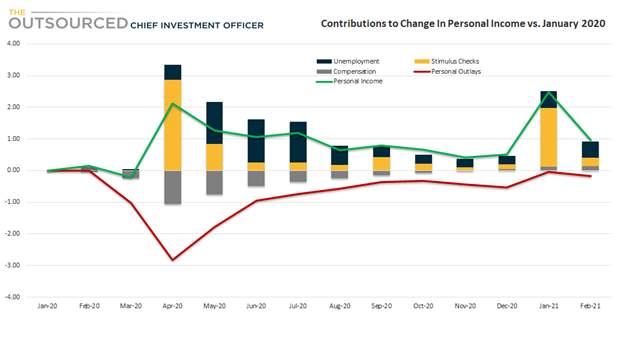
The spike in savings and the sustained level of consumer spending has been driven by an increase in Personal Income. During ‘normal’ recessions, personal income typically declines and takes several quarters to return to pre-recession levels – once fiscal policies are enacted and a recovery in the job market begins. During the pandemic recession, Personal Income declined more than 8.5% but was back to pre-recession levels within a few months. The drop was the biggest in history and could have been worse had in not been for the massive amount of government stimulus in the form of direct payments and unemployment benefits.
In fact, the 8.5% decline was from a historic Personal Income high set by the increase propelled by the first government stimulus in April. From April to December, Personal Income kept declining until a new round of stimulus propped it up again. But at no point during 2020 was Personal Income below the January 2020 levels.
As income from compensation declined in 2020, income from government transfers more than compensated for these losses, which led to the dramatic spike in savings and robust spending. It took until December 2020 for compensation to return to pre-pandemic levels as workers started going back to work. When combined with the amount of liquidity in the economy and consumer savings, the forecast for consumption growth is promising.
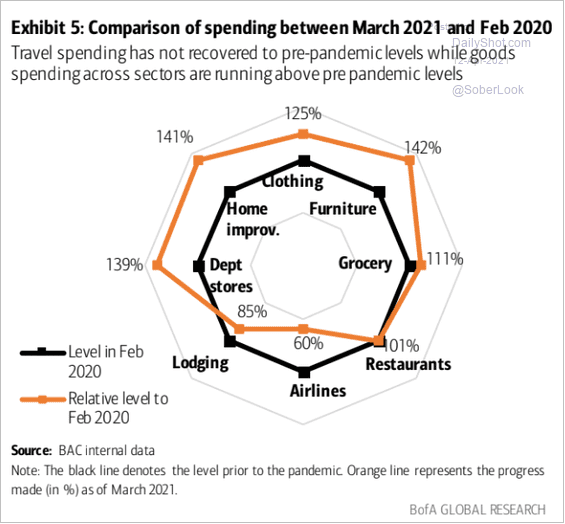
Spending has shifted, however, driven by the inability of consumers to spend on certain goods and services due to business closures, social distancing measures, and government lockdowns. With travel bans in place and restaurants closed or operating at less than full capacity, consumers couldn’t spend on those types of products and services. Instead, spending went towards products and services purchased online or related to activities at home. Whether it was for groceries, home improvement projects, or new furniture, spending on these categories was 40% higher in March 2021 than in February 2020.
Meanwhile, spending on lodging and airlines remained at just 85% and 60% of Feb 2020 levels, respectively. As the labor market improves along with economic reopening, spending on these categories are likely to spike before normalizing.
Not included in the consumer spending data is the amount of capital from stimulus checks that went into financial assets. Some of these funds have made their way into financial assets either as legitimate investments or for speculative behavior, such as the Gamestop frenzy.
As a result, the S&P 500, a barometer of US equity markets, continues to set new records. Equity markets have been giving mixed signals, however. On the one hand, some metrics suggest further upside for the markets, while other data points to an imminent reversal.
It’s true that overstretched valuations lead to poor future performance but prices can also continue to go up further. The dilemma for investors is whether to stay invested to benefit from further upside at the risk of a sudden pullback – or rotate out of expensive asset classes in favor of less glamorous but less risky ones.
The Bullish Case for Equity Markets
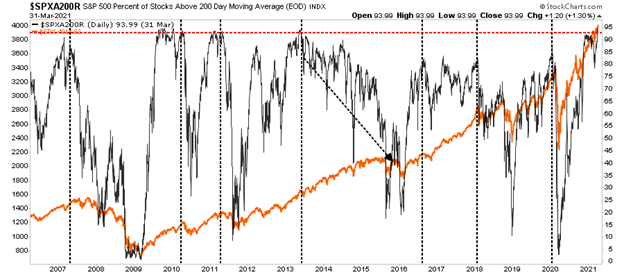
The bullish case for equity markets is that economic growth is accelerating, which will drive earnings growth and continue to propel stock prices. The market now has over 95% of it’s constituents trading above their 200-day average. When a market has breadth as it’s moving in one direction, as is the case today, there are technical analysts that suggest it will continue to move in that direction. Unlike 2020, when the S&P 500 was being powered by a select few companies – 2021 thus far has seen broad participation. Broad market participation in a rising market is typically bullish for stocks.
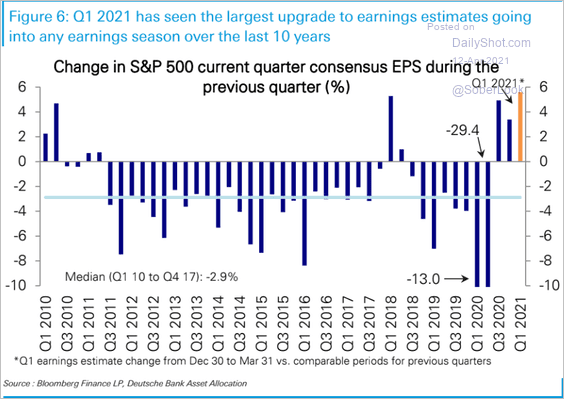
S&P 500 earnings estimates are also at record levels with EPS expected to reach $44.10 in Q42021. If analysts estimates are accurate, S&P earnings would reach $158.97 in CY2021 and $183.76 in CY2022. That’s a 69% increase from a low base in 2020 and another 16% growth in 2022. That puts the forward PE ratio at just under 26 times at the end of 2021. Furthermore, consensus EPS estimates have been upgraded by the highest percentage in over 10 years – indicating that current estimates may be understated.
The amount of liquidity currently in the markets may also serve as downside support while potentially driving the market higher despite already high valuations. With fewer short-sellers now than there used to be and even fewer after the Gamestop situation, markets may not get a big spike from short squeezes but a slow slog higher is possible.
The Bearish Case for Equity Markets
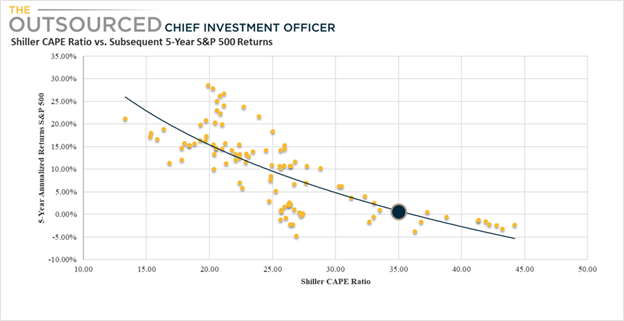
The bears have just as strong of an argument regarding the S&P 500. Many point to the Shiller CAPE ratio, which smooths the earnings per share of the previous 10 years to reduce volatility in earnings at cycle extremes and takes into account inflation. The Shiller CAPE ratio currently stands at roughly 34x, which is at extremely high levels. Based on an analysis of the Shiller CAPE ratio and subsequent returns, we can confirm Jeremy Grantham’s assessment that valuations drive future returns and that current valuations call for muted returns returns over the next five years. Only once in the past has the S&P 500 generated a positive return in the 5-year period after the ratio was at the current level or higher.
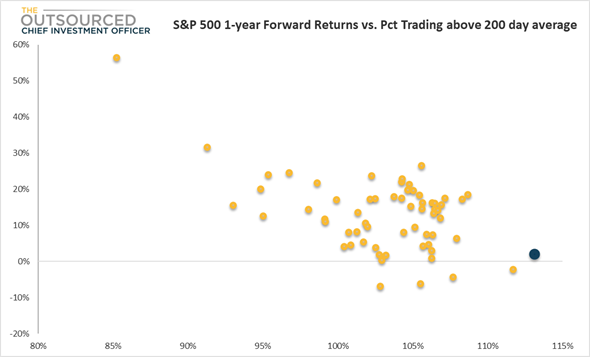
We also looked at the price of the S&P 500 itself relative to it’s 200-day moving average. This differs from an analysis of the breakdown of its constituents. At the time of publishing, the S&P 500 index was trading 13% above it’s 200-day moving average. A price above the 200-day is typically bullish for equity markets until it gets to extremes – 13% is extreme.
When looking at subsequent one-year returns compared to the indexes trading level relative to it’s 200-day moving average, we get similarly low potential returns. The analysis doesn’t hold as well for 5-year returns but is still directionally similar. Both on a valuation and absolute pricing level, therefore, expected future S&P 500 returns are unimpressive.
The Equity Reversal of Income Investors
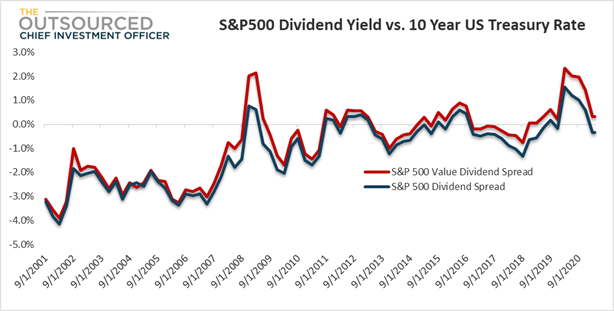
For years, income investors have accepted higher levels of volatility inherent in equity markets because the dividend yield on large cap equities was higher than what they could earn on bonds. That relationship has finally reversed with the 10-year yield now above the dividend yield of the S&P 500.
True income seeking investors could now take profits from their gains and move into more conservative bonds that offer more comparable yields with much less volatility. There is interest rate risk as rates rise, but we don’t believe these risks to be comparable to those of a potentially dramatic equity market pullback.
A point to note is that the S&P 500 Value Index dividend yield is still above the 10-year Treasury. So while a general migration from equity to fixed income is expected, a larger proportion of the reallocation will come from growth stocks, not value.
We agree with the view that the S&P 500 valuation is stretched but breaking it down into components reveals attractive opportunities. The value vs. growth play is one example. But there are sectors that have been beaten up during the pandemic and have not shared in the economic recovery that is starting to take hold.
A prudent strategy would be to reduce overall US equity exposure based on stretched valuations and their implications for flat returns over the next 1 to 5 years. But our FOMO (Fear of missing out) urges us to stay invested in order to squeeze out an additional 5,10, or 15% return.
We agree with the bears that the S&P 500 is generally too expensive and that earnings per share growth for 2021 and 2022 are reflected in the current price. Instead of passive exposure to the S&P 500, our positioning reflects a rotation into cyclical or value stocks, and sectors whose earnings growth is equally compelling but with much more reasonable valuations.