Globally reverberating shocks this past year demonstrate the wisdom of Greek philosopher Heraclitus who said that “the only constant in life is change.”
These words offer perspective at a time when volatility and change have affected almost everyone on the planet. Global financial markets are no exception as their shifting dynamics are influenced by demographic and economic trends, a changing climate, and the disruption caused by the COVID pandemic. For investors, navigating these transformations and ascertaining the associated opportunities and risks can be challenging. Digging into the data, we find that investing in sustainable bonds, globally and across currencies, can offer an advantageous risk-adjusted return profile.
Current market trends point to emerging economies experiencing a higher rate of economic growth and a greater presence in the global markets which ultimately means a larger contributing role in investors’ portfolios. Despite a majority of the world’s population living in emerging market countries, they currently comprise only 16% of the global bond market. Several of these economies may overtake developed economies in size over the next 30 years. As investors, the flexibility to invest in these regions will be key to value creation in bond portfolios. Global bond strategies provide this flexibility and can typically diversify investments across currencies. This diversification ability offers a compelling advantage over constrained strategies such as international funds, which invest only in non-US securities. A portfolio strategy that allocates among emerging market bonds or foreign currencies carries some risk, but a global bond allocation can offer compelling risk-adjusted returns that can be an excellent addition to overall asset allocation.
When combined with environmental, social, and governance (ESG) integration, a global bond strategy can be on the cutting edge of sustainable finance by investing in companies and sovereign nations that embrace increasingly better policies and provide unique opportunities for positive impact. With the whole world to choose from, the discussion of global debt cannot be separated from the discussion of sustainability — climate-related risks, water, and carbon emissions are all factors to consider. We look at where the markets are going — which asset classes, including bonds, equities, and currencies, show the best risk-adjusted returns — and then use ESG integration to find the best names within those markets. This strategy also affords investors the opportunity to put money to work where sustainable policies and debt can be particularly impactful.
Global-Fixed Income Landscape
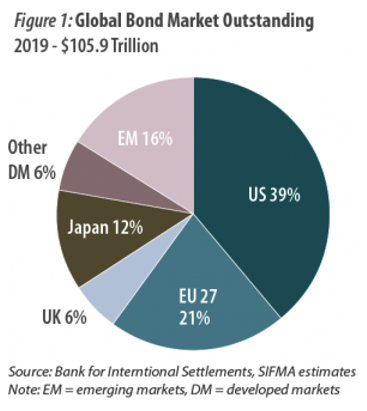
As of 2019, the United States represented 38.9% of global fixed-income securities outstanding. Although the $41.2 trillion US bond market is sizeable, an investment strategy constrained to the US ignores more than 60% of all bonds.1 Diversifying globally provides opportunities that would be otherwise unavailable to a US-only investor.
Figure 1 presents a breakdown of the global fixed-income market. What stands out, from an investor’s perspective, is that emerging markets comprise only 16% of the total. Emerging markets’ third place ranking garners our interest for three reasons. First, more than 85% of the world’s population lives outside of North America and EU.2 The United States only represents 4.25% of the world’s population, and yet it has the largest share of debt outstanding.3 Second, a significant portion of global economic activity is taking place outside of the US and the EU. This activity is projected to represent the largest share of global gross domestic product (GDP) in the next few years. Third, emerging markets are often overlooked as an important complement to a diversified fixed-income portfolio. As a result of their growing share of global economic activity, expanding population, improvements in standard of living, and rising presence in the world’s debt markets, emerging markets should warrant investors’ attention.
A Quiet Tectonic Shift
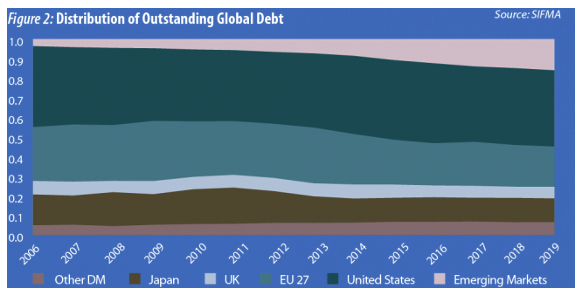
The movement of geographic debt distribution demonstrates that this shift toward emerging markets is already happening. Figure 2 shows that while US debt has retained a dominant presence since 2006, averaging 38.8% of the world’s outstanding debt, the EU’s share of outstanding debt has declined. Japan and the UK have also experienced a decline since 2006. Emerging markets, which increased from 3.7% in 2006 to 16.0% in 2019, was an outlier. China, which has experienced a five-year compound annual growth rate (CAGR) of 18.1%, has been a main driver of this growth. Meanwhile, the EU and the UK have each experienced a declining five-year CAGR of -4.6% and -9.3%, respectively.
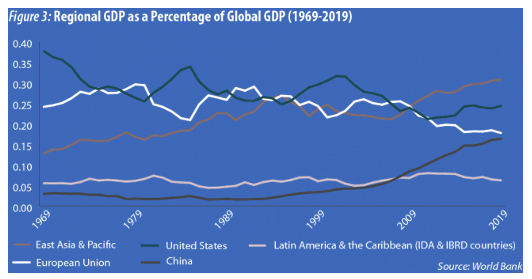
Rising economic activity explains, in part, the growth in emerging market debt. Figure 3 shows regional shares of global GDP over time, including the decline of the US and EU portions of global GDP over the past five decades. Between 1969 and 2019 the US lost 13.3% of its share of global GDP while Europe lost 6.4%. In contrast, China and the region identified as East Asia & Pacific have shown significant growth in percentage of global GDP; China gained 13.5% while East Asia & Pacific gained 18.0%.
International accounting and consulting firm PwC published a study in 2017 outlining how the global economy may look in the future. They incorporated population growth patterns, historical and forecasted GDP trends, government investment rates, developments in education, and socioeconomic patterns. While there is plenty of room for debate on what the future outcome will be, it is evident that emerging market economies can be expected to move up the ranks relating to their share of global GDP. In their study, PwC used GDP Purchasing Power Parity (PPP) to compare country rankings. GDP comparisons using PPP are arguably more useful when assessing a nation's domestic market, because PPP takes the relative cost of local goods, services, and inflation rates of the country into account, rather than using international market exchange rates, which may distort the real differences in per capita income.4
“It's tough to make predictions, especially about the future,” said Yogi Berra. With this quip in mind, we refer to the data with a balanced view. The rankings in Figure 4 show a material “shakeup” of the top 10 countries by 2050; emerging market economies are expected to overtake developed market economies.5
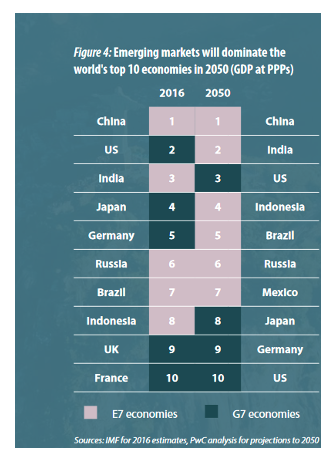
Sources: IMF for 2016 estimates, PwC analysis for projections to 2050
According to PwC, the world economy will double in size by 2042, growing at an annual average rate of 2.6% from 2016 to 2050. They expect global growth to be driven largely by emerging markets and developing countries, with the economies of Brazil, China, India, Indonesia, Mexico, and Turkey growing at an annual average rate of almost 3.5% over the next 30 years, compared to just 1.6% for Canada, France, Germany, Italy, Japan, the UK, and the US.
Uncovering the Devil in the Details: Assessing Risk-Adjusted Returns
The future shape of the global bond market and GDP projections offer investors incentives to look worldwide for opportunities. However, evaluating the risk and return attributes of a global strategy is an important component of this analysis. The Sharpe ratio provides an especially powerful assessment of risk relative to returns. The ratio measures a security’s return compared to the risk-free rate, adjusted for the security’s per-unit of volatility or total risk. The higher the Sharpe ratio, the more attractive the risk-adjusted return.6
Figure 5 compares the investment characteristics of emerging market debt and equities with those of the developed world using a basket of 29 different indices. The Sharpe ratios were calculated over a 12-year period, starting when most emerging market benchmark data began being compiled.
If the indices were investible, seven of the top 10 would only be available to an investor who invests outside the United States, while all 10 of the top indices would be accessible to a global investor. Among the top performers, emerging market-related fixed-income securities offered the highest risk-adjusted return.7 Specifically, Gulf Cooperative Council (GCC) fixed-income securities, including bonds and sukuk that originate from the region, have offered the highest risk-adjusted returns. US high-yield fixed income earned second place, followed by US investment-grade fixed income. Emerging market US dollar-denominated debt earned respectable rankings among the universe of benchmarks, capturing the fourth through seventh place positions. Note that investors cannot invest directly in an index.
What are Sukuk?
Sukuk is the plural of sak, an Arabic word translated as deed, instrument, or legal document. Sukuk are financial certificates having characteristics similar to conventional bonds. Generally sukuk:
- have a stated maturity date;
- offer a stated annual investment income rate, similar to a coupon offered by a conventional bond; and
- may obtain a credit rating from well recognized credit rating agencies, such as Moody’s and Standard & Poor’s.
It is important to note that while sukuk may share similar features with conventional bonds, unlike conventional bonds, they typically reflect an undivided beneficial ownership interest in an underlying asset, similar to a stock. The returns of the underlying asset provide the investment return, and sukuk holders share in the underlying asset’s profits as well as potential losses.
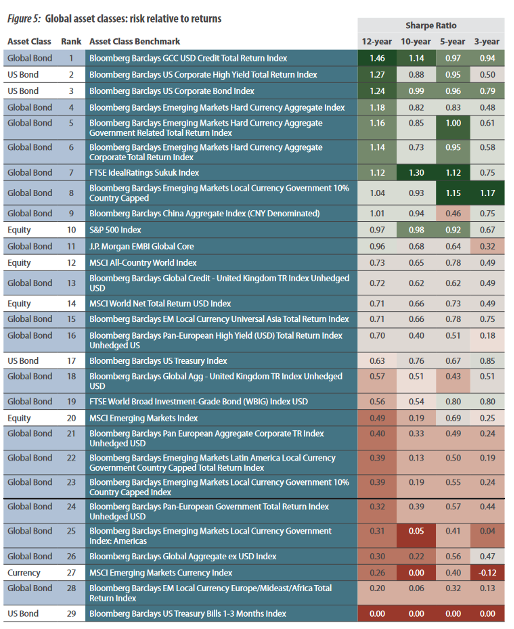
Figure 5 demonstrates the need for strong discernment in the global markets. There are a variety of factors that can affect the Sharpe ratio of some emerging market equity and emerging market currency-based indices. These benchmarks typically incorporate a large geographic region and many different economies around the world. Some of the poor performances can be attributed to higher risk premiums, greater sensitivity to foreign investment flows, or substantial differences in liquidity when compared to developed world markets. Additionally, there is a tendency of emerging market economies to have greater dependence upon global commodity price trends. Examples include the MSCI Emerging Markets Equity Index and the Emerging Markets Currency Index. Active management is a valuable tool for determining factors that influence each of these benchmarks on both the positive and negative sides.
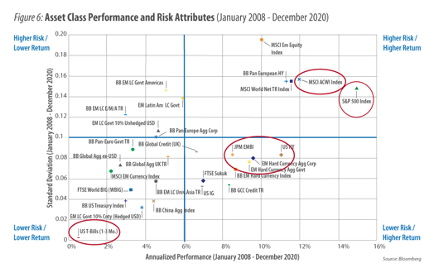
Perhaps the most useful representation of risk versus return can be seen in Figure 6. Return is charted on the horizontal axis, and standard deviation as a measure of risk is represented on the vertical axis. We believe an ideal asset allocation would have a combination of lower risk/ lower return assets such as Treasury bills, higher risk/higher return assets such as equities, and lower risk/higher return securities that would be accessible through a global bond strategy. The quadrant to avoid is higher risk/lower return.
An allocation to equities gives an investor access to higher risk/higher return securities. The S&P 500 experienced the highest annualized return of 15.0% but also had a relatively high measure of risk. As the saying goes, success with equities can be best defined as “time in the market rather than timing the market.” Equities can experience pronounced volatility but also offer opportunity for higher returns to those with the patience to withstand the swings in valuations. For example, if an investor missed the best five days of being fully invested in the S&P 500 from 1980 through 2018, their overall return would be reduced by 35%. Missing the best 10 days would have cut the investor’s long-term results by more than half.8
One important takeaway, from a global bond perspective, is the difference in risk between emerging market equities and bonds. It’s understandable that risk-averse investors could be wary of these investments when both the MSCI Emerging Markets Equity Index and MSCI All Country World Equity Index had high rates of volatility. However, emerging markets fixed income offered competitive returns with measurably less risk. The Emerging Markets Hard Currency Aggregate Corporate Index and the J.P. Morgan Emerging Market Bond Index were some of the top performers on a risk-adjusted basis, as shown in the Sharpe ratio table (Figure 5). The ability to allocate a bond portfolio in the lower risk/ higher return and lower risk/lower return quadrants, therefore optimizing risk and return globally, can be a tremendous advantage for a global strategy. Emerging market debt can be an excellent way to get exposure to that higher return/lower risk quadrant, which can be used in combination with US bonds for an optimized portfolio.
It is interesting to note that US T-bills and the FTSE Sukuk benchmark were the only two asset categories that did not realize a negative annual return over the 12-year period. The evidence indicates that investors can benefit from a more globally diversified fixed-income portfolio allocation.
ESG Landscape in a Global Context
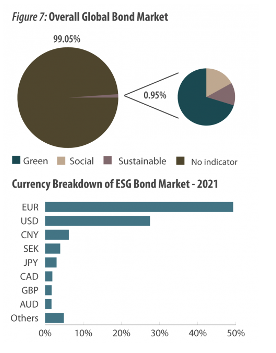
ESG integration is a critical component of a global strategy, and the conversation around the case for global bonds must include consideration of sustainability. This is especially true when choosing the best risk-adjusted returns from around the globe. Referring to Figure 6, we believe that ESG integration is critical to avoid the upper left quadrant of higher risk/lower return. This also enables an investor to focus on risk reduction in areas such as climate and governance while also taking advantage of opportunities in growing markets. A strong internal process for ESG integration is of paramount importance given the data challenges, changing markets, and lack of uniform standards governing what can be defined as “green” or ESG-linked bonds. Currently, only about 1% of total debt outstanding is specifically labeled as ESG debt (defined in Figure 7 as Green, Sustainable, or Social).
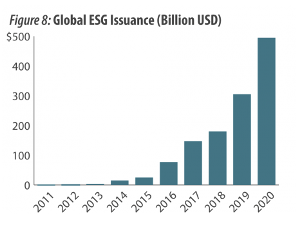
Figure 7 details the ESG and currency breakdowns of the current bond market. Even within the small ESG bond market, US dollar denominated bonds account for only 27.5% of total debt outstanding. If an investor is seeking bonds with sustainable use of proceeds, a global strategy would have access to a much larger pool of debt securities. Issuance in the space is growing rapidly, with both 2019 and 2020 seeing growth of more than 60%. Europe and the US account for most issuance, but we expect that green, social, and sustainable bonds will track the overall global bond market with emerging market economies issuing more debt with specific use of proceeds.
In the meantime, a sustainability-minded investor must look outside of the labeled ESG market for investment opportunities, not only due to the relatively small size of the market, but also for the lack of consistency in standards for what constitutes an ESG-linked bond. Even issuers of green bonds can have serious governance or social detractors that could ultimately impact their underlying creditworthiness and subsequent returns.
Evaluating ESG Opportunities: Gender in a Global Landscape
ESG standards vary across the globe. Gender equality and gender-related disclosure have a foothold in nations such as the UK, where companies are required to disclose gender pay gaps. In the US, more companies are adding women to boards and acknowledging the research showing a positive link between gender representation and improved profitability.9 However, in many other parts of the world, this change is just starting and needs investment with specific gender equality goals in mind. In Cambodia, the literacy rate for women is only 75%, while the literacy rate for their male counterparts is more than 10% higher.10 The US and other developed nations have literacy rates around 99% for both genders.11 The opportunity for economic growth, better corporate governance, and improved climate for business likely will flourish alongside improvements in gender equality and equality in education.
Organizations such as Impact Investment Exchange Asia (IIX), a Singapore-based organization focused on the empowerment of women, the environment, and underserved communities, can provide an ESG investor with fixed-income impact opportunities and portfolio diversification benefits. These cutting-edge bonds offer institutional investors the ability to invest in securities that fund loans for woman-owned enterprises and micro-finance organizations in Cambodia, India, the Philippines, and Indonesia. These bonds offer diversification across geographies, beneficiaries, and organizations, as well as a partial-credit guarantee from the US Agency of International Development. While many of these bonds face "junk bond" ratings, the opportunities they present can allow a global investor risk mitigation, impactful investment, and participation in furthering gender equality.
The GCC – Overlooked Opportunities in ESG
It is fair to assume that the growth of emerging market debt may not be on the radar for most investors. However, capital market growth, along with diversification opportunities, are available outside of the developed markets. Over the past decade, these debt markets have gained in size, depth, and liquidity. In fact, debt markets of regions such as the Middle East rival the size of some segments of the developed markets. By August 12, 2019, the size of the Europe's high-yield market was estimated at €432 billion (~$485 billion).12 At the same time, the size of the GCC fixed-income market was $506 billion, with US dollar-denominated securities representing 87% ($365 billion) of the total outstanding securities.13
The GCC region's attractiveness to institutional investors has played a part in facilitating growth in the region's debt market. Many of the GCC members retain credit ratings that are more commonly found in developed countries. The United Arab Emirates has an “AA” rating from S&P, on par with the US and UK. Saudi Arabia is rated “A-,” only two notches away from China’s “A+.”14 Relatively strong credit characteristics contribute to the appealing risk-adjusted return profiles discussed earlier. The favorable investment attributes have not gone unnoticed by global benchmark providers, such as J.P. Morgan. At year-end 2020, the GCC region represented 20.7% of the Emerging Market Bond Global Index and 16.9% of the Emerging Markets Bond Global Diversified Index, up from 2.1% and 6.2% at year-end 2018, respectively.15
Within this region there are compelling ESG opportunities relating to the environment and the transition toward a low-carbon economy. The region is known for its extremely hot summers, where temperatures can rise above 120 degrees Fahrenheit (49 degrees Celsius)! Demand for air conditioning during the summer accounts for up to 70% of the overall electricity consumption in the UAE.16 The National Central Cooling Company PJSC, often referred to as Tabreed, offers a unique solution to reduce carbon emissions and energy demand. Tabreed builds and operates utility-sized central plants to cool water, which is then distributed through a dedicated network of insulated pipes to customers’ buildings, known as a cooling district. The company has a 30-year operating history and currently runs 86 cooling plants in five countries.17 As of year-end 2020, management reported a reduction in CO2 emissions by 1.35 million tons, which is equivalent to removing 293,192 passenger vehicles off the road for an entire year.18
Conclusion
An allocation to global bonds offers investors an important opportunity for portfolio diversification and risk-adjusted returns. With 60% of the bond market located outside the US, the opportunities available to investors are greatly amplified in a global strategy. From a sustainability viewpoint, a global strategy also offers opportunities for impact in developing nations and unique ESG names. Positioning assets for the future of economic growth, while focusing on optimizing risk relative to return, is a hallmark of a global sustainable bond strategy.
Footnotes
1 Kolchin, Katie, Ali Mostafa, and Justyn Podziemska. Capital Markets Fact Book, 2020. SIFMA. September 29, 2020. https://www.sifma. org/resources/research/fact-book/
2 Al Gergawi, Mishaal, and Afshin Molavi. The 85 World. Emerge85, October 3, 2016. https://emerge85.io/Insights/the-85-world/
3 United States Population. Worldometers. https://www.worldometers.info/world-population/us-population/
4 Applications and Limitations of ICD Data. African Development Bank Group. http://www.afdb.org/fileadmin/uploads/afdb/ Documents/Publications/4-Applications%20and%20Limitations%20of%20ICP%20Data.pdf
5 The World in 2050. Price Waterhouse, February 2017. https://www.pwc.com/gx/en/research-insights/economy/the-worldin- 2050.html#downloads
6 Fernando, Jason. Sharpe Ratio. Investopedia. April 10, 2021. https://www.investopedia.com/terms/s/sharperatio.asp
7 The six members that form the Gulf Cooperative Council (GCC) include Bahrain, Kuwait, Oman, Qatar, Saudi Arabia, and the United Arab Emirates (UAE).
8 Houseman, Drew. Why Mistiming the Market Can Be Disastrous. The Simple Dollar, September 1, 2020. https://www. thesimpledollar.com/investing/stocks/tempted-to-sell-missing-just-a-handful-of-the-best-stock-market-days-can-tank-yourreturns/
9 Dixon-Fyle, Sundiatu, Vivian Hunt, Sara Prince, and Lareina Yee. Delivering Through Diversity, January 18, 2018. https://www. mckinsey.com/business-functions/organization/our-insights/delivering-through-diversity
10 Cambodia. UN: Women. https://data.unwomen.org/country/cambodia
11 UNESCO Institute for Statistics. Literacy rate, adult female (% of females age 15 and above). The World Bank, September 2020. https://data.worldbank.org/indicator/SE.ADT.LITR.FE.ZS
12 Jessop, Simon, and Abhinav Ramnarayan. Demand for junk bonds grows, and so do liquidity worries. Reuters, August 12, 2019. https://cn.reuters.com/article/instant-article/idUKKCN1V217C
13 Bloomberg.
14 Credit Ratings. Trading Economics. https://tradingeconomics.com/country-list/rating
15 First Abu Dhabi Bank, GCC Fixed Income Chart Book, FY 2020 Review, January 21, 2021.
16 Pamuk, Humeyra. UAE’s mission impossible: Cooling the desert. Reuters. July 13, 2011. https://www.reuters.com/article/uspower- emirates/uaes-mission-impossible-cooling-the-desert-idUSTRE76C1OI20110713
17 About Us: Our Story. Tabreed. https://www.tabreed.ae/about-us/
18 Tabreed eliminates over 1.35 million metric tons of CO2 emissions in 2020. Tabreed, March 17, 2021. https://www.tabreed.ae/ news/tabreed-eliminates-1-35-million-metric-tons-co2-emissions-2020/