Dear fellow investors,
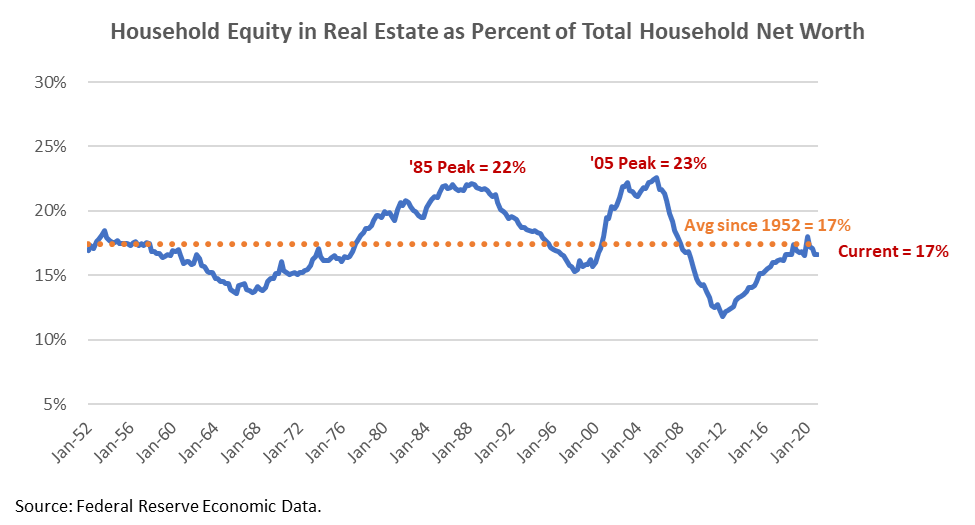
We have been in many discussions with our investors, people in the media and the investment management industry on where housing is today. While certain investors had taken a practical approach to housing, some have voiced objections around the price movement we’ve seen in housing since the lockdowns ended in the spring of 2020. Looking at price movements out of context could plausibly make anything sound insane. However, the question is whether we are at an extreme relative to the past. Below is a chart that we put together from St. Louis Federal Reserve data. The chart is US home equity as a percentage of household net worth.

The first thing you can take away from this chart is that we are nowhere near an extreme of net worth sitting in housing today. Prior extremes were 1985: the average boomer then was at a home buying age of 25 or greater. Followed by 2005: boomers thought they needed a second or third home, but there were far fewer Generation Xers buying homes to create an encore.
The other way to look at this chart is to think about housing priced in net worth. Why did we go to an intense low on housing relative to net worth? Stocks and bonds did very well as interest rates went to the floor, while housing languished from the bottom in 2008-2009. The other assets households owned did far better than the houses themselves and have continued their historical strength relative to housing.
We continue to warn investor investors of the likelihood of stock market failure over the next 10 years. There are a few reasons for this: the percentage of household net worth in stocks (all-time high), the effects of interest rates on stock investors decisions (buy the dip) and the psychology of financial euphoria that is present today. In our opinion, these are the S&P 500’s failures. At some point, the bond market has to deal with inflation and interest rates.
The chart also explains that when housing does well and stocks don’t, housing soars in net worth. Housing didn’t appreciate like the stock market did during the 1960’s, so it found a low during that decade. Stocks and bonds were a train wreck in the 1970’s. Housing didn’t have this train wreck. We explained how housing beat inflation during the worst period in US history (1968-1981) in our recent piece, Inflation: It’s Just the Start. In our minds, housing has an uncanny opportunity cost relative to stocks today like the 1960’s to 1970’s.
Wealth sits at a poor juncture today as interest rates have affected many assets like stocks and bonds. The extremes of this are Jeff Bezos, Elon Musk and Bill Gates, as they are included in US household data. This skews net worth today as the largest growth in net worth has come from the stock market. Think of people that gain stock-based compensation from their employer as an example to where the growth of net worth has been the highest in the US.
The average employee in the US economy doesn’t work for a company that is publicly traded. Housing is something that average people own. In an era where housing is not at an extreme, and the stock market is, in comparison. The breadth of wealth will grow (average people) while the intensities of wealth (Bezos, Musk, Gates) will decline. For stock investors this will be tough, but you can see why our investors, and we, are interested in housing. It is a different game than the stock market.
As I’ve often quoted in our conversations with investors lately, Buffett said in the 1998 Berkshire Hathaway Shareholder Meeting that to beat Bobby Fisher you have to play him in any game but chess. To beat the S&P 500 or bonds looking out over 10 years, we believe housing provides our investors a game to win. Housing drives average wealth. We theorize that home equity as a percentage of total net worth will go to higher highs than we have ever seen in the data! All this will be driven by the supply shortage and the demographic bump of millennials succeeding. Wall Street gets no such bump.
Fear stock market failure,
Cole Smead, CFA
The information contained in this missive represents Smead Capital Management's opinions, and should not be construed as personalized or individualized investment advice and are subject to change. Past performance is no guarantee of future results. Cole Smead, CFA, President and Portfolio Manager, wrote this article. It should not be assumed that investing in any securities mentioned above will or will not be profitable. Portfolio composition is subject to change at any time and references to specific securities, industries and sectors in this letter are not recommendations to purchase or sell any particular security. Current and future portfolio holdings are subject to risk. In preparing this document, SCM has relied upon and assumed, without independent verification, the accuracy and completeness of all information available from public sources. A list of all recommendations made by Smead Capital Management within the past twelve-month period is available upon request.
©2021 Smead Capital Management, Inc. All rights reserved.
This Missive and others are available at www.smeadcap.com.
© Smead Capital Management
Read more commentaries by Smead Capital Management