Real Treasury Bond Yields
Real Treasury bond yields fell into deeply negative territory in 2021. In elementary economic models, this event, taken in isolation, would qualify as a plus for economic growth in 2022 and would be consistent with the strength indicated by fourth quarter 2021 tracking models. In theoretical discussions in introductory and intermediate economic texts, economic relationships are explained under what is known as the ceteris paribus condition, where only one variable is moving while all others are being held constant. An economy has many moving parts however and is more precisely described by the phrase mutatis mutandis which means that all the variables are moving at the same time. With this in mind, the negative real yields of 2021 add to the already numerous economic headwinds for 2022.
This assessment is based on four considerations. First, the history of negative real yields for the past century and a half indicates that the downward risk to economic activity is significant, a sharp contradiction to the importance of economic gains in late 2021. Second, the theory of real interest rates and how they are determined confirm the historical analysis. Third, historical analysis indicates that negative real yields, combined with extreme over-indebtedness are an even greater negative for growth as is confirmed by scholarly research. Fourth, increasing obstacles to growth will encourage subsiding inflation.
History
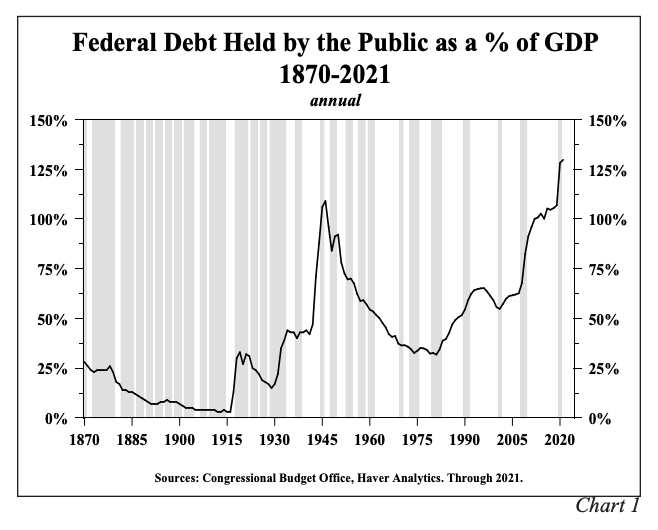
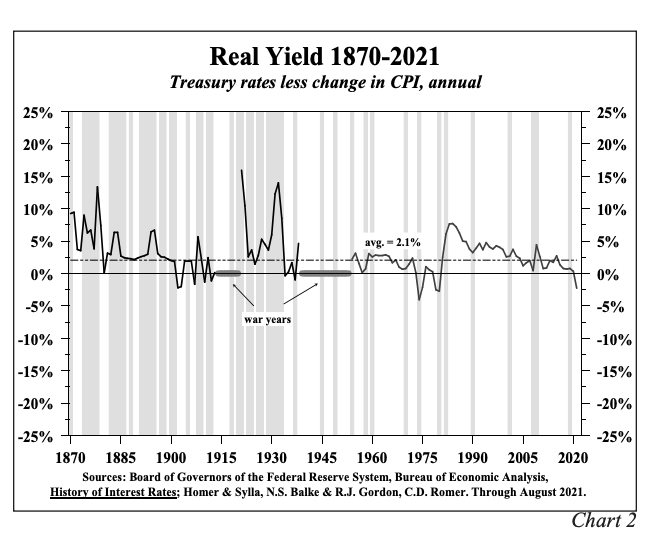
Real 30 year Treasury yields averaged a negative 2.3% in 2021, the lowest annual average since the recessions of the early 1980s. While not unprecedented, negative real yields at this level are extremely rare. Since 1870, the starting point of reliable data, only 24 full yearly averages were negative, or just 16% of the 152 readings over this time span. Detailed parsing of the series reveals that 12 of those occurrences fell in the spans from 1914 to 1920 and 1939 to 1953, both of which were dominated by major military engagements and their subsequent demobilization – World Wars I and II and the Korean War. The World Wars began in Europe and Asia prior to the U.S. entry, but our initial noncombatant status gave the U.S. a major economic boost that was in no way cyclical. The start of the Korean War and the end of World War II were four years apart, but the interest rate controls that were initiated in 1942 continued into the 1950s and the Korean War ended in 1953. Thus, the War years should be excluded since one of the most critical issues for the economy is not just extreme over-indebtedness, but the length of time that the high debt levels are sustained. Academic research has focused on high debt levels that lasted longer than five years. Short-term increases in debt do not have the severe deleterious effects on economic growth as sustained levels of high indebtedness. The World Wars fail to meet the sustained debt overhang criterion. Prior to the World Wars, the U.S. economy was very lightly indebted. During the military engagement debt levels surged dramatically, but as soon as they ended, the debt levels came down and precipitously so (Chart 1). In contrast, when the Pandemic hit in 2020, the U.S. economy was already suffering a massive debt overhang, with debt levels surging even more dramatically during the Pandemic and importantly, with the Pandemic’s effect on the economy winding down, the debt levels are continuing to advance even higher because of U.S. fiscal policy.

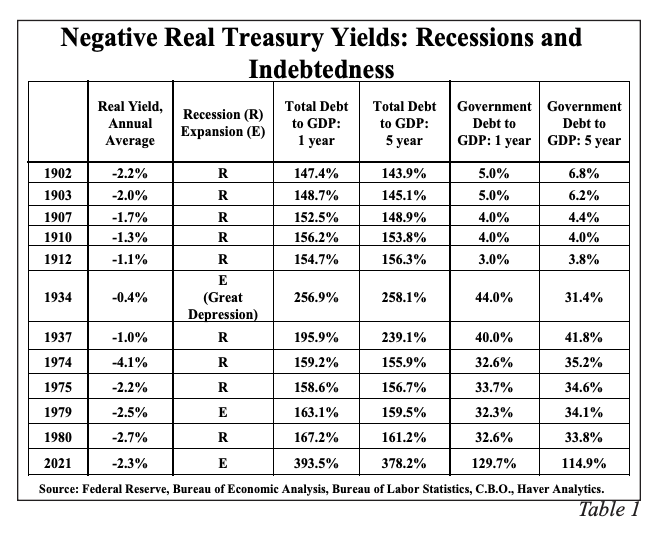
Excluding the 1914-20 and the 1939-53 periods from the post 1870 sample still leaves a robust sample of 130 readings (Chart 2). During this lengthy span, cyclical and secular economic conditions resulted in a negative yearly average for real Treasury bond yields twelve times, or just 8% of the time. In the eleven cases prior to 2021, nine of the negative real yield periods coincided with recessions – 1902-03, 1907, 1910, 1912, 1937, 1974-75, and 1980. Real long maturity yields were negative in 1934, which while not a recession year, happened during the horrific conditions of the Great Depression (1929-1939). In only one case, 1979, does the negative real yield happen during an economic expansion when the economy is not in a highly depressed state. Filtered by the five year sustained level of indebtedness criteria, the 2021 negative real yield was a singular event (Table 1).
Theory
The Fisher equation (i = r + πe) defines the long-term risk-free rate (i) as being equal to the real rate (r) plus expected inflation (πe). The equation calls for inflationary expectations, not actual inflation. However, over long periods of time realized inflation must equal expected inflation since if this were not the case, then investors, on average, would lose on their investments, which is an untenable assumption. For a century plus span as just described, the real interest rate is a marketbased variable just as if it were traded since it can be algebraically rearranged to r = I – πe.
Based on the Fisher equation and acting under ceteris paribus, lower real yields are described as a boost for economic growth. However, by allowing all variables to move at the same time, lower real yields carry an alternative implication that is far more negative for economic growth. A negative real yield points to the fact that investors or entrepreneurs cannot earn a real return sufficient to cover risks. Accordingly, the funds for physical investment will fall and productivity gains will erode which undermines growth. Attempting to counter this fact, central banks expand liquidity but the inability of firms to profitably invest causes the velocity of money to fall but the additional liquidity boosts financial assets. Financial investment, however, does not raise the standard of living. While the timing is uncertain, real forward financial asset returns must eventually move into alignment with the already present negative long-term real Treasury interest rates. This implied reduction in future investment will impair economic growth.
Debt Overhangs and Real Interest Rates
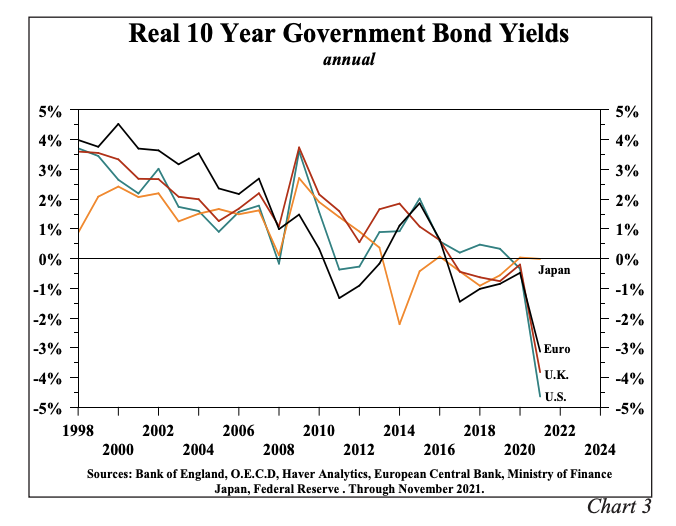
Staying within the context of mutatis mutandis analysis, the level of indebtedness of the economy is another of the critical moving parts in assessing future economic growth. Based on empirical evidence, theory and peer reviewed scholarly research, the massive secular increase in debt levels relative to economic activity has undermined economic growth, which has in turn, served to force real long-term Treasury yields lower. This pattern has been evident in both the United States and the more heavily indebted Japanese and European economies (Chart 3).
Economic research provides additional insight and evidence as to why interest rates fall to low levels and then remain in an extended state of depression in times of extreme over-indebtedness of the government sector. While differing in purpose and scope, research has documented that extremely high levels of governmental indebtedness suppress real per capita GDP. In the distant past, debt financed government spending may have been preceded by stronger sustained economic performance, but that is no longer the case. When governments accelerate debt over a certain level to improve faltering economic conditions, it actually slows economic activity. While governmental action may be required for political reasons, governments would be better off to admit that traditional tools would only serve to compound existing problems. For a restless constituency calling for quick answers to economic distress and where inaction would be likened to an uncaring and insensitive attitude, this is a virtually impossible task.
Carmen Reinhart, Vincent Reinhart and Kenneth Rogoff (which will be referred to as RR&R), in the Summer 2012 issue of the Journal of Economic Perspectives linked extreme sustained over indebtedness with the level of interest rates. In this publication of the American Economic Association, they identify 26 historical major public debt overhang episodes in 22 advanced economies, characterized by gross public debt/GDP ratios exceeding 90% for at least five years, a requirement that eliminates purely cyclical increases in debt as well as debt caused by wars. They found that the economic growth rate is reduced by slightly more than a third, compared when the debt metric is not met. This result is highly consistent with the actual experience in the U.S. since 2000 as the U.S. growth rate has fallen 50% below the trend rate from 1870 to 2000. This research has clearly met the test of time and has been confirmed and expanded upon by several other economic scholars. The passage of time also confirms RR&R’s findings on debt overhangs and real interests. In 2012, they write “Contrary to popular perception, we find that in 11 of the 16 debt overhang cases, real interest rates were either lower or about the same as during the lower debt/GDP years. Those waiting for financial markets to send the warning signal through higher (real) interest rates that governmental policy will be detrimental to economic performance may be waiting a long time.”
Persistent Global Weaknes
Advanced Economies (AD)
In 2021, the Japanese, Euro Area and Chinese economies, in comparative terms, underperformed the U.S. economy. This pattern should continue this year. Due to more massive debt overhangs and poorer demographics, real GDP in Japan and the Euro Area in the third quarter of 2021 was still below the pre-pandemic level of 2019. The U.S. in this time period managed to eke out a small gain. The dispersion between the U.S., on the one hand, and China and Japan, on the other hand, may be even greater. Scholarly forensic evaluations have found substantial over-reporting of GDP growth in China and now, similar problems have been revealed in Japan. Prime Minister Fumio Kishida said on December 15, 2021, that overstated construction orders had the effect of inflating the country’s economic growth figures for years. Consequently, the marginal revenue product of debt is even lower than reported therefore so is the velocity of money for both Japan and China. Interestingly, Bloomberg syndicated columnist and veteran Wall Street research director Richard Cookson makes a strong case that “China looks a lot like Japan did in the 1980s.”
Emerging Market Economies (EM)
The sharp surge in inflation in 2021 has resulted in far greater damage to the EM economies than the U.S. for three reasons. First, a much higher proportion of household budgets are allocated to necessities than in the United States since real per capita income levels are much lower than in the U.S. Second, numerous EM central banks increased interest rates in 2021. According to Cornerstone Macro, more than 100 central bank policy rate hikes occurred in EM economies last year. Third, the dollar rose in 2021, with the DXY trade weighted dollar index closing at the highest level in almost a year and a half. Since many essential commodities are priced in dollars, the cost of these items rose more rapidly in EM than in the United States, thus creating a heavier incremental burden on modest and moderate-income households.
Many EM countries including Brazil, Argentina, Mexico, South Africa, Chile and Turkey all experienced slower growth last year than the U.S. Several, including Chile, Argentina and Turkey, have seen their currencies fall to a record low against the dollar. As an interesting on the ground fact, the black-market Argentina peso recently fell to half the official exchange rate. Also in our hemisphere, the Columbian, Peruvian and Brazilian currencies have slumped to near record lows versus the dollar.
As a prelude to future events, 2021’s pattern was very similar to that of the Arab Spring of a decade ago. As these disruptions unfolded, world economic growth in 2011 was pushed sharply lower by the EM countries. U.S. Treasury bond yields fell from 4.33% at the 2010 close, or the approximate start of the Arab Spring, to a 2011 close of 2.89%, when the Arab Spring ended. Any eventual EM disruptions of 2021 will likely have a more severe impact on global economic conditions than did the Arab Spring since the current economic and Covid related turmoil was still going on as 2021 ended and EM economies debt to GDP ratios are higher than ten years ago, making the group even less resilient. The higher debt levels trigger the law of diminishing returns – debt increases may initially boost real GDP, but further debt increases become neutral and subsequent debt additions result in negative growth. Another problem emerges as most of the EM debt is denominated in dollars. When EM currencies slump as in 2021, the external costs of servicing and amortizing debt add an additional burden on their borrowers. The current situation is a far cry from 2009 and 2010 when the EM changed from lightly to overly indebted.
Growth Obstacles
In 2022, several headwinds will weigh on the U.S. economy. These include negative real interest rates combined with a massive debt overhang, poor domestic and global demographics, and a foreign sector that will drain growth from the domestic economy. The EM and AD economies will both serve to be a restraint on U.S. growth this year and perhaps significantly longer. The negative real interest rates signal that capital is being destroyed and with it the incentive to plough funds into physical investment.
Demographics continue to stagnate in the United States and throughout the world. U.S. population growth increased a mere 0.1% in the 12 months ended July 1, 2021. This was the slimmest rise since our nation was founded in the 18th century, along with two other firsts: (1) the natural increase in population was less than the net immigration, and (2) the increase in population was less than one million, the first time since 1937. The birth rate also dropped again. Covid explains the jump in the death rate but not the fall in births since many predicted that confinement would lead to increased births which did not happen. Poor demographics retard economic growth by lowering household, business and state and local investment. This keeps intact the observable trend in numerous countries - extreme over-indebtedness reduces economic growth which, in turn, worsens demographics, which reinforces the weakness emanating from the debt overhang. William Stull, Professor of Economics at Temple University, makes the case that for nations’, “demographics is destiny” (a phrase coined by Ben Wattenberg and Richard M. Scammon), highlighting the importance of its critical secular growth in determining economic fortune.
Although fourth quarter numbers are not yet available, the global debt to GDP average for 2020-21 is almost certainly the highest on record for any two-year period. Transitory growth spurts, like the one Q4 2021, are unlikely to be sustained. The sporadic but weakening growth trend evident before the pandemic hit in 2019 will return, reinforcing the debt trap.
Inflation
Inflation has been one of the most widely reported and discussed economic factors in the past year. Surging energy, rents, building materials, automotive, food and supply disruptions have boosted the year-over-year rise in the inflation rate to the fastest pace in decades. While some see this increase as a good economic sign, its increase actually had the effect of reducing real earnings by 2%. Even though unemployment fell in 2021, consumers became more alarmed by the drop in real wages according to surveys. The faster inflation shredded the budgets of about 75% of our households. In November, the level of real per capita disposable income equaled the year ago level which was also the lowest level since March of 2020. Consistently, The University of Michigan indicates consumer sentiment in the fourth quarter was worse than during the height of the 2020 pandemic and at the levels of the beginning of the very deep 2008-09 recession. Consumers cut back significantly on their buying plans as expectations for increases in future income slumped. To fund the sharply higher cost of necessities, households have been forced to reduce the personal saving rate in November to 6.9%, or 0.4% less than in December 2019. Needing to tap credit card lines undoubtedly contributed to the erosion in consumer confidence measures. Without the sizable cut in personal saving, real consumer expenditures were barely positive in the fourth quarter. With money growth likely to slow even more sharply in response to tapering by the FOMC, the velocity of money in a major downward trend, coupled with increased global over-indebtedness, poor demographics and other headwinds at work, the faster observed inflation of last year should unwind noticeably in 2022.
Due to poor economic conditions in major overseas economies, 10- and 30-year government bond yields in Japan, Germany, France, and many other European countries are much lower than in the United States. Foreign investors will continue to be attracted to long-term U.S. Treasury bond yields. Investment in Treasury bonds should also have further appeal to domestic investors, as economic growth disappoints and inflation recedes in 2022.
Disclosures Hoisington Investment Management Company (HIMCo) is a federally registered investment adviser located in Austin, Texas. HIMCo is not registered as an investment adviser in any other jurisdictions and is not soliciting investors outside the U.S. HIMCo specializes in the management of fixed income portfolios and is not affiliated with any parent organization. The Macroeconomic Fixed Income strategy invests solely in U.S. Treasury securities. Information herein has been obtained from sources believed to be reliable, but HIMCo does not warrant its completeness or accuracy; opinions and estimates constitute our judgment as of this date and are subject to change without notice. This memorandum expresses the views of the authors as of the date indicated and such views are subject to change without notice. HIMCo has no duty or obligation to update the information contained herein. This material is for informational purposes only and should not be used for any other purpose. Certain information contained herein concerning economic data is based on or derived from information provided by independent third-party sources. Charts and graphs provided herein are for illustrative purposes only. This memorandum, including the information contained herein, may not be copied, reproduced, republished, or posted in whole or in part, in any form without the prior written consent of HIMCo. To receive more information about HIMCo please call (800) 922-2755, or write HIMCo, 6836 Bee Caves Road, Building 2, Suite 100, Austin, TX 78746.
© Hoisington Investment Management
Read more commentaries by Hoisington Investment Management