A tale of different EMs
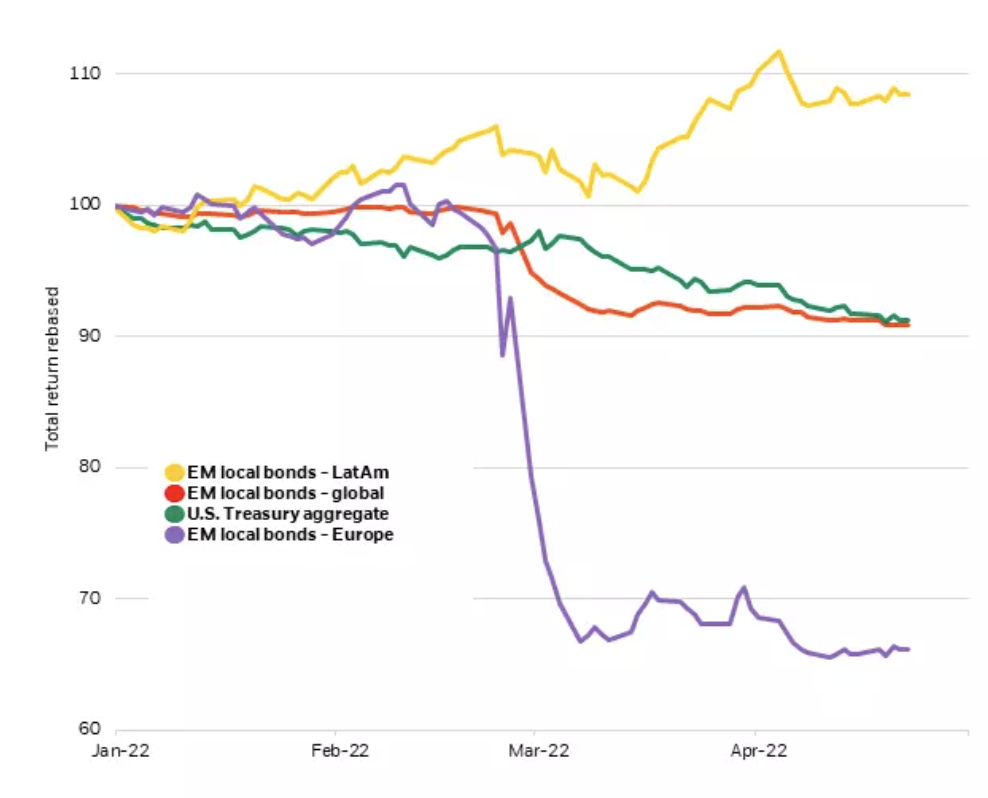
Emerging market local debt vs. U.S. Treasuries total returns, 2022

It’s been an annus horribilis for bonds everywhere this year – except in some corners of the emerging world. Why? Scarcity inflation has arrived. Supply shocks have created shortages of goods, energy and food that are driving up prices. This has spurred DM central banks to signal faster policy normalization than markets expected and resulted in bond yields rocketing upward. Local-currency EM debt (the red line in the chart) has suffered alongside U.S. Treasuries (green line) so far this year. It’s key to realize broad EM indexes hide a lot of differentiation. Local-currency debt of commodities producers such as Latin America (yellow line) and the Middle East & Africa have actually posted gains this year, outperforming debt of commodities-consuming Asia and Europe (purple line). The latter was directly hit by the fall-out of Russia’s invasion of Ukraine.
Rate hike risk
How about the risk of the Fed’s upcoming rate hikes? This has often spelled trouble for EM assets. Investors have tended to demand a higher risk premium for holding them. Fed tightening also has frequently come with a stronger U.S. dollar, pressuring EM entities with hard-currency borrowings. We see the Fed’s impact as more limited this time. First, the Fed is rightly racing to normalize policy, but we believe it won’t fully deliver on its hawkish rate hike plans in the end. Second, we expect the sum total of rate hikes to be historically low given the level of inflation.
We also see a strong starting position for EM debt, given cheapened EM currencies, improved external balances, decreased foreign ownership and attractive coupon income. The main reason: Many EM central banks have been ahead of the curve in raising interest rates to fight inflation, as we noted in Liftoff? EM has already taken off of November 2021. This means they are much further along on the path to policy normalization than DM central banks. Real yields, or inflation-adjusted yields, have been edging into positive territory in some countries.
What are the risks? DM central banks could push rates to levels that destroy growth in an effort to rein in inflation. This would deal a blow to EM countries already struggling with high import prices of commodities and rising debt piles as a result of COVID relief programs. Alternatively, some EM countries could see runaway inflation, forcing their central banks to slam the brakes. And some could face social unrest in the face of fast-rising prices of food and other basic goods.
It’s important to realize broad EM indexes hide a lot of differentiation. EM equity indexes, for example, are heavily weighted toward Asia. The benchmark GBI EM Diversified local-currency index has a 10% cap on any one sovereign issuer, giving more diversification and exposure to commodities exporters. It also means investors may need to go beyond indexes to get the exposures they are bullish on – and avoid the ones they have little confidence in. EM assets tend to offer fertile ground for security selection, we find, compared with heavily researched asset classes such as DM large-cap equities.
Our bottom line
We maintain a modest overweight to EM local-currency debt amid an overall underweight to bonds. Much monetary tightening is already done, and valuations are compelling. We are neutral hard-currency EM debt. It is sensitive to rising U.S. rates, and valuations are now less attractive vis-à-vis U.S. credit. We prefer to take EM risk in debt, rather than equities. We prefer DM stocks because of EM’s challenged restart dynamics, inflation pressures and tighter policies.
Market backdrop
Yields on 10-year U.S. Treasuries rose to near 3% last week, levels not seen since late 2018. Equities ended down as the first-quarter earnings season gathered steam. We still think stocks can perform even as yields rise in the inflationary backdrop. The IMF forecasts much higher inflation and weaker growth, especially in Europe, due to the supply shock emanating from the Ukraine war. We believe downside risks to growth in China have increased amid Covid lockdowns.
This week’s highlights will be U.S. and euro area inflation and GDP data releases that further reveal the growth impact of the stagflationary supply shock from the war in Ukraine. We expect Europe to feel the hit more than the U.S. China manufacturing data will likely reflect how a spike in COVID cases is restricting activity.
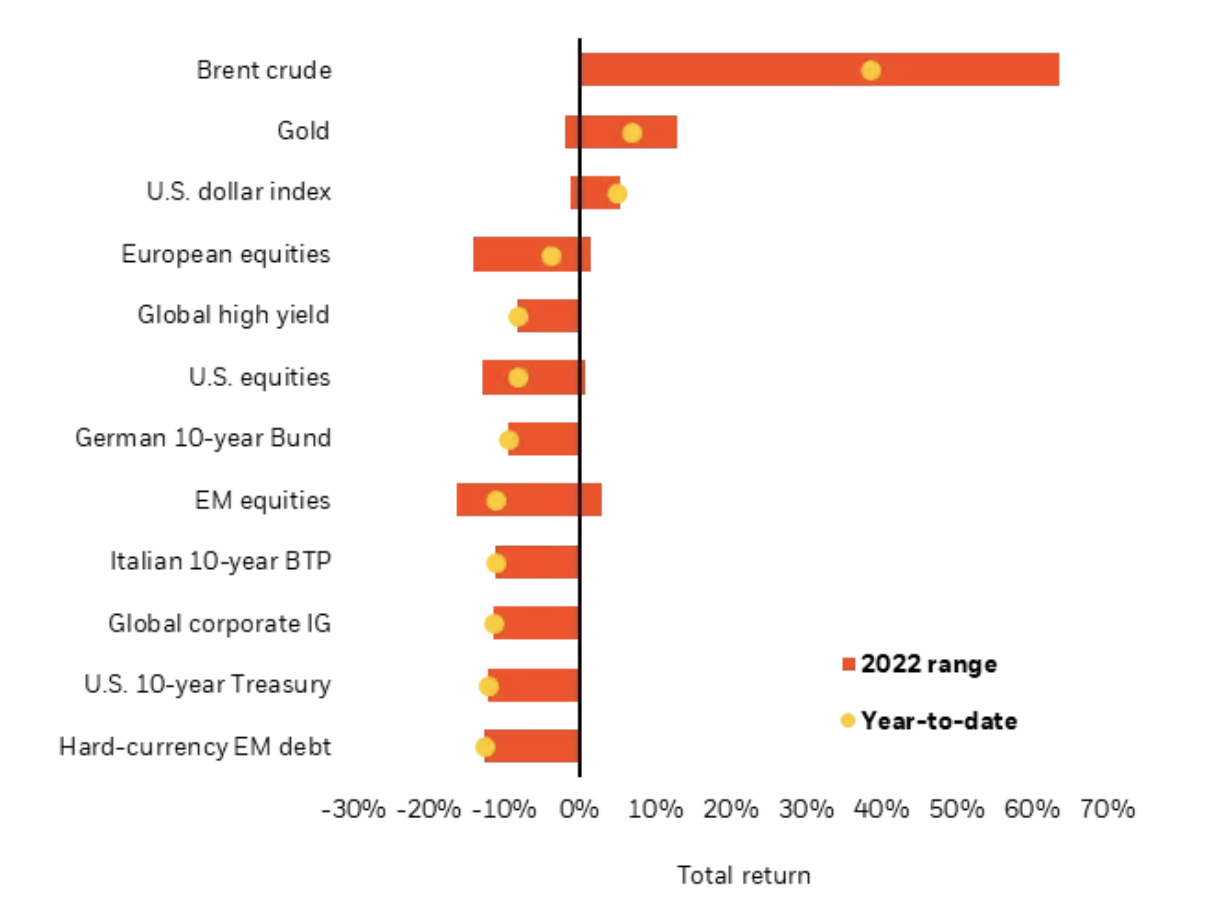
Past performance is not a reliable indicator of current or future results. Indexes are unmanaged and do not account for fees. It is not possible to invest directly in an index. Sources: BlackRock Investment Institute, with data from Refinitiv Datastream as of April 22, 2022. Notes: The two ends of the bars show the lowest and highest returns at any point this year to date, and the dots represent current year-to-date returns. Emerging market (EM), high yield and global corporate investment grade (IG) returns are denominated in U.S. dollars, and the rest in local currencies. Indexes or prices used are: spot Brent crude, ICE U.S. Dollar Index (DXY), spot gold, MSCI Emerging Markets Index, MSCI Europe Index, Refinitiv Datastream 10-year benchmark government bond index (U.S., Germany and Italy), Bank of America Merrill Lynch Global High Yield Index, J.P. Morgan EMBI Index, Bank of America Merrill Lynch Global Broad Corporate Index and MSCI USA Index.
© BlackRock
Read more commentaries by BlackRock