We are excited to start sharing the thought process of Erlanger Research on Advisor Perspectives as perspectives and unique views are something that there is no shortage of in our shop. This year a common theme of financial advisors, portfolio managers, strategists and traders is,”… why didn’t I sell that stock sooner? There has to be a better way to improve my sell discipline???”
There is. We feel that bias as a component of your risk control as well as stock selection process is something that all managers need to contemplate.
What is bias in the stock market? The answer is pretty simple. Bias defines whether one wants to be long (own stocks) or short/sell (sell or short shares). How one defines bias can be arrived at through a variety of tools, but it is one of the most important measures to be a successful investor.
Our favorite tool to determine bias is the Displaced Moving Average (DMA) Channel. Whatever period we are looking, from three minute to monthly, the channel is a six period moving average that is shifted four periods into the future, i.e. displaced. There is an upper moving average that is taken from the high over the six period range as well as a lower moving average that is taken from the low over the six period range.
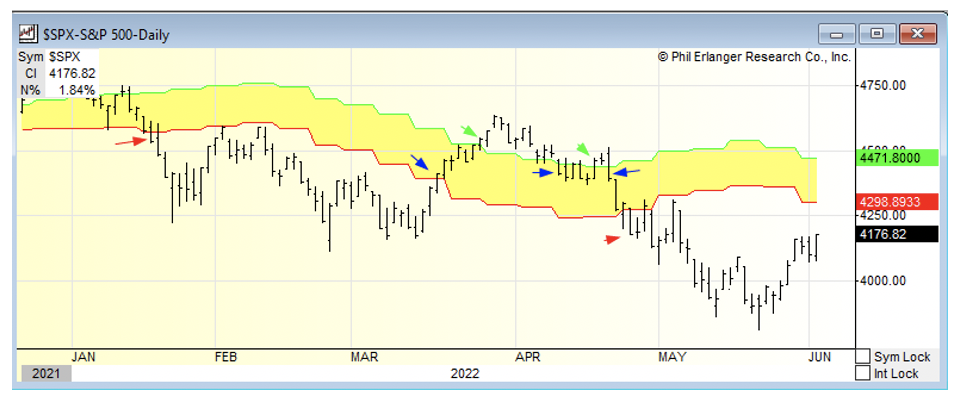
Here is a good example of a weekly DMA Channel on the S&P 500 that shows if you are above (green), in (yellow) or below (red).
Favorite DMA Channels of mine include a weekly and monthly that provide signals that work without whipsawing the trader. The daily tends to have a bit too much whipsaw impact and acts more as a trigger indicator that we will discuss in an upcoming article.
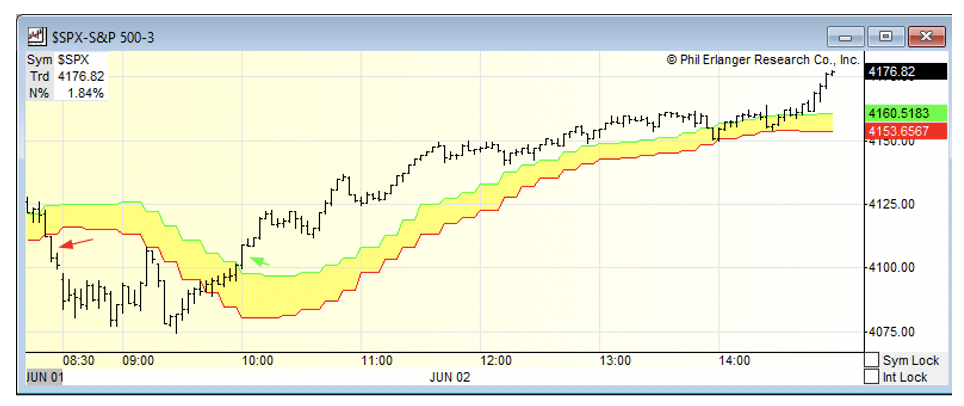
As an intraday trader, I love using my intraday DMA Channel to catch a rally like we saw hit the market on Thursday, June 2nd. Sometimes like in the chart below the DMA Channel makes it very clear what the outcome will be.
Back to the Weekly Chart, the S&P 500 first broke below the weekly DMA Channel on the 19th of January at 4532.76 and did not get back into the channel at 4411.67 on March 17th. Then it struggled to stay out of the channel until falling back into it and then breaking back below it on April 26th at 4175.20. Going into week’s end on June 3rd, the S&P 500 is basically at that level 4176.82.
However, the weekly DMA Channel is still higher with a range of 4298.89 (lower DMA Channel) to 4471.80 (upper DMA Channel). This is telling us that the all clear signal has yet to get the green light. In early trading on Friday, June 3 the S&P 500 is back at 4115 showing the usefulness of the channel.
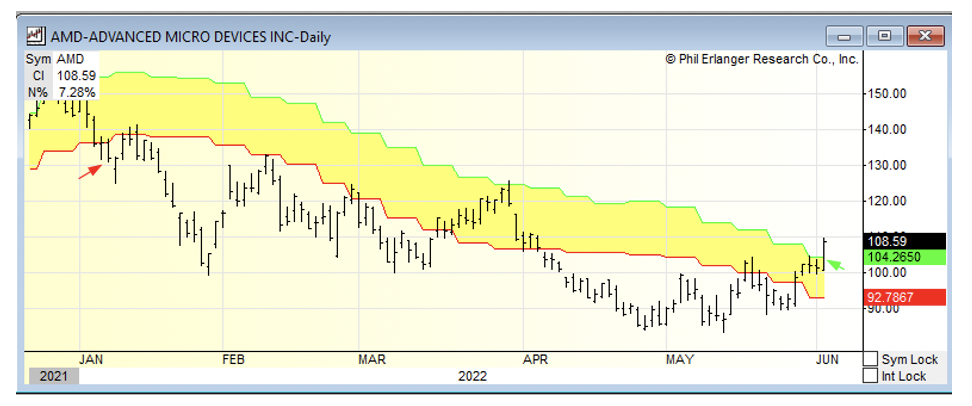
An interesting buy signal of a recent weekly DMA Channel breakout is Advanced Micro Devices (AMD) that just broke back above its weekly DMA Channel on June 2nd close at $108.59. Note that the chart also shows you where it broke the weekly DMA Channel on January 7th at $132.00.
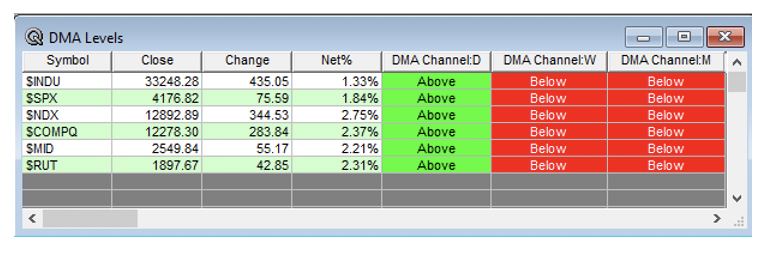
Besides seeing the DMA Channel in a chart another great way is to see it in a quote sheet. Our charting program Erlanger Chart Room allows us to see the DMA Channel on multiple periods at the same time. Instead of flipping through a daily, weekly and monthly chart we can see in the quote sheet all time periods.
Currently, the indexes have only been able to clear their daily levels. It is going to be hard to get positive without seeing the indexes have their weekly DMA Channels bias improve. Make sure to check back next week as we will show this table again.