War continues to rage in Ukraine. Inflation continues to run rampant. Gas prices are at record highs. Food prices are eating into consumers' pocketbooks. Mortgage rates have skyrocketed. Gross Domestic Product fell in the first quarter of 2022. The Fed is in the midst of a major tightening cycle. When you add all of this together, it seems obvious why many believe that we are headed into a recession, defined as a drop in GDP for two successive quarters.
Given all of this, it’s no wonder that the stock market has been in the grips of a serious sell off thus far in 2022. From their peaks, the S&P is down 21% and the Russell Small Cap Index is down an even more significant 33%.
The question for investors though, is when to become optimistic on the market again and, as a result, begin adding risk to portfolios. Since nobody rings a bell to signify that the market has hit bottom, we decided to look back at previous recessions to see what history could tell us.
Dating back to the Great Depression there have officially been 15 recessions. They have obviously varied significantly in both length and severity. That said, the average recession has lasted a little over one year. This includes the aforementioned Great Depression as well as the more recent 2008 subprime mortgage triggered recession, both of which lasted significantly longer. No economist currently expects the current recession, if it even comes to pass (so far, we only have one negative quarter of GDP), to be anywhere near as bad as those two events. When we remove those two downturns from the data, the average term of the remaining 13 recessions drops to around 10.5 months.
The interesting aspect, foreshadowed by the title of the piece, is the point during a recessionary cycle when the market has historically bottomed out. On average, for the 15 recessions dating back to the Great Depression, the stock market has hit its lowest point when 40% of the recession still remains. In other words, if a recession ends up lasting 10 months, the market bottom would occur at approximately the six-month point.
This number goes to just under 50% when you take out the small recession (GDP only contracted 0.3%) back in the early 2000’s that was triggered by the dotcom bubble. That sell-off was clearly exacerbated by the unprecedented multiples that the market was trading at then. For reference, the S&P was trading at a multiple 47x price to earnings ratio on 1/1/2001 vs 23x on 1/1/2022.
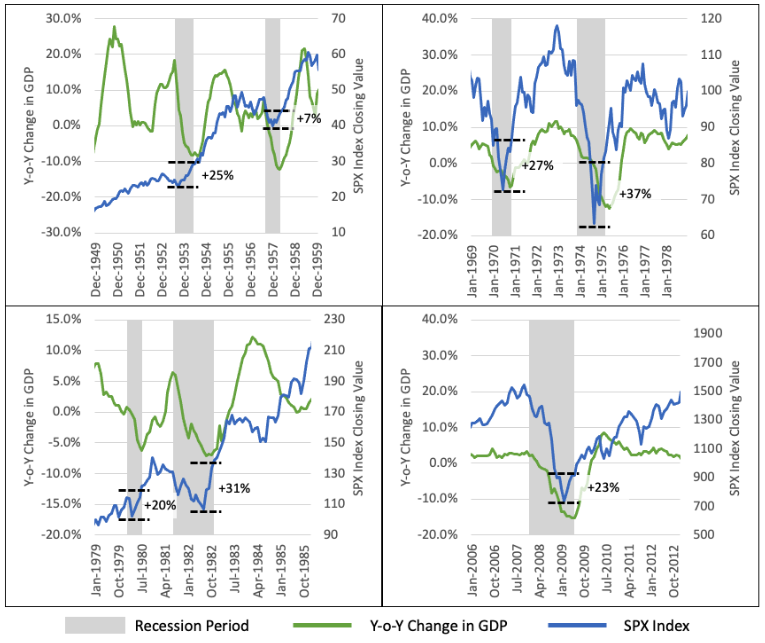
These trends are shown on the following charts for four periods in history that encompass seven recessionary periods.
 Percent change is from the bottom of the SPX in a recessionary period to the end of that recessionary period.
What does this analysis tell us about the current market situation? Assuming we are in the midst of a recession, then when economists look back, they will likely peg its beginning to somewhere in the fourth quarter of 2021. If we use 12/21 as a starting point for the current downturn, then we would already be seven months into the current recession. If the current downturn ends up lasting an entire 12 months (the historic average for the length of recessions), then we are slightly over halfway through it. Further, we are inching up on the historic 60% point where the market has historically bottomed out before beginning a positive trajectory (often a significant one).
Clearly, timing the bottom is a very difficult exercise at best. That said, it seems reasonable that combining market history with some positive data (attractive valuations, improving supply chain, early signs of disinflation among others), presents an interesting case that we may, in fact, be near what will end up being the bottom of this bear market. One final historical point; there is a wide disparity for how long it has taken the market to return to its pre-bear market highs. For example, in the Great Depression in the early 1930’s, it took the market 258 months to recover to its previous high, and in the 2008 recession it took 45 months. In many other periods (e.g., the 1950’s, 1991, 2020) it took less than 5 months. Much depends on the severity of the recession and the amount of leverage in the system at the time. While the market has crashed to levels depicted in the Great Depression and the 2008 economic equivalent of Pearl Harbor, this doesn’t feel like an “end of the world” recession to us. For example, the US just created close to 400,000 jobs in the month of June!
While we never know how long these recessions (if we even have one) will last, the one thing we know from history is that when the newspapers and media outlets declare the recession to be over, the market is already well off its lows and real money has been made for investors.
© 180 Degree Capital
Read more commentaries by 180 Degree Capital
 Percent change is from the bottom of the SPX in a recessionary period to the end of that recessionary period.