Our last update was on August 15th. The S&P 500 peaked the next day. Stocks are now down -4.65% since that high through 12:30 p.m. EDT on Friday, August 26th. The S&P 500 rose 9.11% in July after dropping -8.39% in June. August sees the S&P 500 now down -0.54%.
Year to date now the S&P 500 is down -13.75% through Friday’s noon time noted above. The low on the S&P 500 was -23.07% on June 16th. So the S&P 500 had been in rally mode since mid to late June and now the downside is being tested.
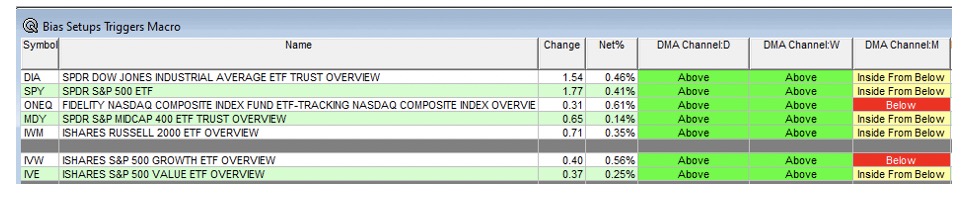
In our last Bias Indicator update on the major equity indexes, the only periods that had strength were the Daily and Weekly (see July 29th Table). Now the Monthly is starting to see U.S. Equity Indexes move back into their DMA Channels (see August 15th Table).
August 15th Table

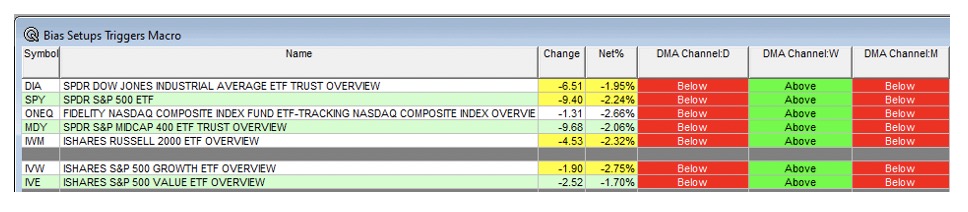
August 26th Table
One month ago we noted, “The trick in August is going to be getting the indexes into their monthly DMA Channel first and then above the channel”. The S&P 500 and the other indexes made it into the Monthly and now have fallen back below the channel.
In our last update we noted, “The reality is that it may take a couple more months to get back above the monthly DMA Channel”. Clearly, that is the case now and we will monitor any changes and keep you aware of further improvements or deteriorations.
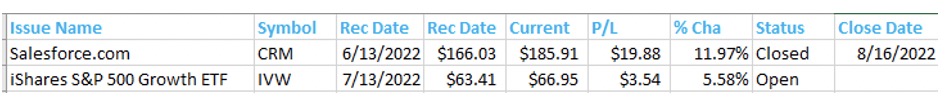
When we make recommendations or shortly thereafter, we will put a stop in play to limit losses or lock in gains before it erodes. We recommended Salesforce (CRM) in an article that was published on June 13th at a price of $166.03. In our last update, we noted, “… remains worth holding but will put in a stop at $185.91” The stock was stopped out after our last article on August 19th.
In our July update, we showed the chart of Growth vs Value ETFs. We suggested to trade IVE for IVW and that has worked out well so far. IVW was at $63.41 on the recommendation and is now at $67.20 down from $71.43 on the 15th. As such, we will put a stop in place at $65.58.
In an ideal world, you buy a stock or ETF and then hold to for two years. Sometimes that is not possible as pullbacks after an advance start to lose too much of the profit. As such, this is why we deploy stops that are built on a technical basis. In our next recommendation, we will detail how we establish the stop on a new position.
We still like grow beating value into year end but with Friday’s Jackson Hole Speech behind us it warrants caution. As several indicator are turning from positive to negative.
Over the last twenty-one weeks, the S&P 500 has now risen seven weeks and is battling a two week losing streak. Next week will be a pivotal week to see if August can rally to close the month higher or the selling continues.
The Erlanger Big Barf (EBB) has fallen to -3.64 on a daily basis after being positive two weeks ago, 14.77. The EBB tracks the relationship of the S&P 500 against the CBOE Volatility Index. It will move higher if the S&P 500 rises and the VIX falls.
The EBB will also fall if the S&P 500 falls and the VIX rises. The VIX has now risen back above 20 and sits at 23.79. Clearly, the S&P 500 and other indexes have taken a couple steps backward after moving forward since June.
Until our next update, start to work on a stop strategy.
© Erlanger Research
Read more commentaries by Erlanger Research