2024 Capital Gains Snapshot: Understanding the Tax Pain Many Investors Will Feel
Membership required
Membership is now required to use this feature. To learn more:
View Membership BenefitsExecutive summary:
- Taxes on capital gain distributions are an annual reality for most investors.
- Distributions aren’t tied to market performance but to trading activity.
- Our review of estimated capital gains distributions shows that every asset class – even municipal bonds – will likely pay capital gains this year that will be subject to taxes.
- Investing with tax management in mind is key to building after-tax wealth
Every year, most investors face a near-certain reality: taxes on their investment portfolio. Those who invested in individual stocks will likely be taxed on the capital gains (as well as investment income) that were realized over the year. Those who invested in either mutual funds or exchange-traded funds (ETFs) will receive a tax bill on the distributions received, which often include capital gains.
And that is the reality of capital gains: they happen. In fact, they happen no matter what the markets do. First, let’s look at what the markets DID do: as of the first week of December, the S&P 500 Index is up for the year by almost 30%; the small-cap focused Russell 2000 Index is up more than 20%. International Developed and Emerging Markets indices are in positive territory for the year. That makes it likely that no matter how your clients are invested, capital gains will be a reality.
A History of Capital Gains
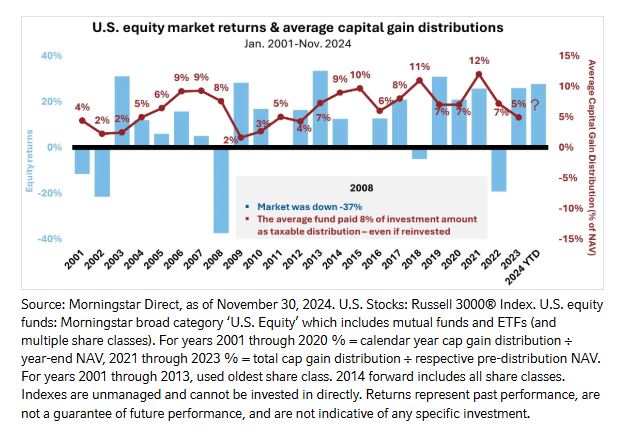
As you can see below in Chart 1, capital gains are distributed annually. In the “good years”, including this year, capital gains are to a degree expected by investors. They may not like it, but it makes sense to them that if their portfolio goes up Uncle Sam will want to take his share. The thing is, when markets are down, capital gain distributions still happen. That’s because capital gains aren’t necessarily tied to the market’s performance, but to activity within the portfolio. In 2008, 2018, and 2022, capital gain distributions were still hefty even though investors may have fallen behind on their investment growth.
Chart 1:
2024 – US Large, Mid, and Small
To help you prepare for what might happen this year, we start compiling data in early fall on what most of the fund industry is expecting when it comes to year-end capital gain distributions. These are generally estimates, with final numbers not known until the actual distributions are announced and made, usually between the second week of December and the end of the year. We update this estimate data frequently, and by the end of November we have a pretty good idea of what investors can expect.
In Chart 2 below, you will see a summary of distribution estimates for the major U.S. Equity asset classes. Overall, U.S .Large Cap Funds are expected to have an average distribution of just over 7% as a percentage of Net Asset Value (NAV). This is moderately larger than the long-term average. Since U.S. Large Cap stocks have posted returns above 20% for the past two years, one might have expected a bigger distribution But volatility has been modest, which puts a lid on some the trading activity that has the tendency to generate larger capital gain distributions. Still, a 7% distribution at a 20% tax rate works out to be 1.4% of the portfolio’s value that needs to be paid to the Internal Revenue Service!
Within the overall U.S. Equities space, growth-oriented stocks have the larger expected average distributions, at nearly 8% of NAV. U.S. Value stocks and Mid-Cap stocks are not too far behind, both with an expected average distribution rate of nearly 7%. Rounding out US equities, small cap equities are expecting to have a distribution rate that falls between 6-7%.
Chart 2:
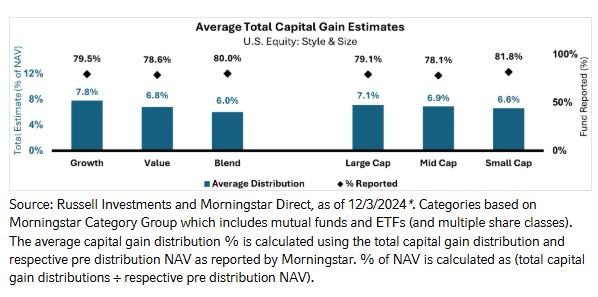
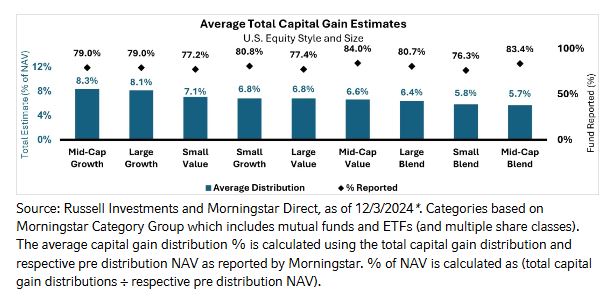
Chart 3 delves a little deeper and shows that growth stocks in both the Large and Mid-Cap segments have the biggest expected capital gain distributions. The story is a little different in Small Cap, where Small Cap Value Funds have a higher expected average distribution rate than Small Cap Growth Funds (7.1% vs 6.8%). Blend Funds, which investors sometimes refer to as Core, have lower expected distributions than their Style compatriots.
Chart 3:
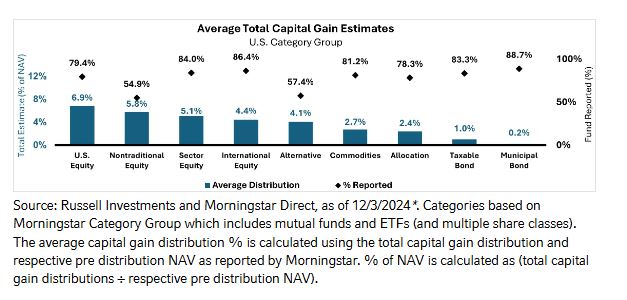
And finally, Chart 4 looks at the full spectrum of asset classes including Fixed Income. Fixed Income funds are typically at the lower end of the distribution range. There is a 1% expected capital gain distribution in Taxable Bond funds, and a greater than zero distribution rate for Tax Free Municipal Bond funds. Since 2022 was an anomalous year as Fixed Income had negative returns, it’s honestly a bit surprising to see Fixed Income funds with capital gain distributions in 2023, especially in the generally lower-tax municipal space. This is why tax management should be a very important consideration when you build an investment portfolio for non-qualified investors.
Chart 4:
Investor and Advisor Action Steps
What can you do about the capital gain distributions that are expected?
Our top suggestion is to stop investing the distributions back into the portfolios they are coming from, especially if the tax bill is unwanted. Why reinvest back into the source of the problem? Instead, redirect the distributions towards a solution that is better suited for the investor’s non-qualified account needs. After-tax wealth growth should be a key priority in for investors who hold non-qualified assets. One of the best ways to accomplish that is to minimize the tax burden, year in and year out.
The bottom line
When it comes to average capital gain distributions, some distributions are higher, some are close to the average and some are lower. But the main take away for 2024 is that the average was HIGH! At Russell Investments, when it comes to capital gains distributions, our goal is not just to come in below average, but closer to zero.
So, faced with such robust capital gains distributions this year, how can you prepare for potentially difficult conversations with your clients? The 1099-DIV tax form can give you insight into the tax efficiency of your clients’ portfolios. It may make sense to transition all (or part) of a portfolio to a more tax-managed approach. Reach out to your Russell Investments representative to find out more about how tax-managed investing can help reduce the impact of taxes on investments.
*Calculated as of 12/3/2024, from publicly available data through Morningstar and formal fund company announcements. All information should be considered an estimate and subject to change prior to the payment date, any information released after this date is not considered. Total number of funds expected to make a distribution is based on the funds that formally announced capital gains estimates. The calculation excludes funds that are not expected to make a distribution.
Disclosures
These views are subject to change at any time based upon market or other conditions and are current as of the date at the top of the page. The information, analysis, and opinions expressed herein are for general information only and are not intended to provide specific advice or recommendations for any individual or entity.
This material is not an offer, solicitation or recommendation to purchase any security.
Forecasting represents predictions of market prices and/or volume patterns utilizing varying analytical data. It is not representative of a projection of the stock market, or of any specific investment.
Nothing contained in this material is intended to constitute legal, tax, securities or investment advice, nor an opinion regarding the appropriateness of any investment. The general information contained in this publication should not be acted upon without obtaining specific legal, tax and investment advice from a licensed professional
Please remember that all investments carry some level of risk, including the potential loss of principal invested. They do not typically grow at an even rate of return and may experience negative growth. As with any type of portfolio structuring, attempting to reduce risk and increase return could, at certain times, unintentionally reduce returns
The information, analysis and opinions expressed herein are for general information only and are not intended to provide specific advice or recommendations for any individual entity.
Russell Investments' ownership is composed of a majority stake held by funds managed by TA Associates Management L.P., with a significant minority stake held by funds managed by Reverence Capital Partners L.P.. Certain of Russell Investments' employees and Hamilton Lane Advisors, LLC also hold minority, non-controlling, ownership stakes.
Frank Russell Company is the owner of the Russell trademarks contained in this material and all trademark rights related to the Russell trademarks, which the members of the Russell Investments group of companies are permitted to use under license from Frank Russell Company. The members of the Russell Investments group of companies are not affiliated in any manner with Frank Russell Company or any entity operating under the “FTSE RUSSELL” brand.
The Russell logo is a trademark and service mark of Russell Investments.
Copyright © 2024 Russell Investments Group, LLC. All rights reserved. This material is proprietary and may not be reproduced, transferred, or distributed in any form without prior written permission from Russell Investments. It is delivered on an “as is” basis without warranty.
Russell Investments Financial Services, LLC, member FINRA (www.finra.org), part of Russell Investments.
If fund is indicated by Morningstar as passive or an ETF, the fund is considered to be passively managed. Otherwise, the fund is considered to be actively managed.
The Morningstar categories are as reported by Morningstar and have not been modified. © 2024 Morningstar, Inc. All Rights Reserved. The information contained herein: (1) is proprietary to Morningstar; (2) may not be copied or distributed; and (3) is not warranted to be accurate, complete or timely. Neither Morningstar nor its content providers are responsible for any damages or losses arising from any use of this information. Past performance is no guarantee of future results.
METHODOLOGY OF CALCULATING AVERAGE CAPITAL GAINS DISTRIBUTIONS OF FUND CATEGORY: The average capital gain distribution as a % of Net Asset Value (NAV) is calculated using long term and short-term capital gain distributions as reported by respective fund families. % of NAV is calculated as ($ capital gain estimate ÷ NAV).
For funds that report estimates as a range a mid-point is used [(low estimate + high estimate) ÷ 2]. It is important to understand the NAV date used in this calculation vary by fund family based on each company’s formal distribution announcement.
MORNINGSTAR CATEGORIES
U.S. Equity Group:
US Equity Funds are mutual funds or exchange-traded funds (ETFs) that invest at least 75% of their total assets in equities, and at least 75% of equity assets in US equities. These funds invest primarily in the equities of US companies across various capitalizations and styles.
MORNINGSTAR CATEGORY DEFINITIONS:
Large Value: Large-value portfolios invest primarily in big U.S. companies that are less expensive or growing more slowly than other large-cap stocks. Stocks in the top 70% of the capitalization of the U.S. equity market are defined as large cap. Value is defined based on low valuations (low price ratios and high dividend yields) and slow growth (low growth rates for earnings, sales, book value, and cash flow).
Large Blend: Large-blend portfolios are fairly representative of the overall U.S. stock market in size, growth rates, and price. Stocks in the top 70% of the capitalization of the U.S. equity market are defined as large cap. The blend style is assigned to portfolios where neither growth nor value characteristics predominate. These portfolios tend to invest across the spectrum of U.S. industries, and owing to their broad exposure, the portfolios' returns are often similar to those of the S&P 500 Index.
Large Growth: Large-growth portfolios invest primarily in big U.S. companies that are projected to grow faster than other large-cap stocks. Stocks in the top 70% of the capitalization of the U.S. equity market are defined as large cap. Growth is defined based on fast growth (high growth rates for earnings, sales, book value, and cash flow) and high valuations (high price ratios and low dividend yields). Most of these portfolios focus on companies in rapidly expanding industries.
Mid-Cap Value: Some mid-cap value portfolios focus on medium-size companies while others land here because they own a mix of small-, mid-, and large-cap stocks. All look for U.S. stocks that are less expensive or growing more slowly than the market. Stocks in the middle 20% of the capitalization of the U.S. equity market are defined as mid-cap. Value is defined based on low valuations (low price ratios and high dividend yields) and slow growth (low growth rates for earnings, sales, book value, and cash flow).
Mid-Cap Blend: The typical mid-cap blend portfolio invests in U.S. stocks of various sizes and styles, giving it a middle-of the-road profile. Most shy away from high-priced growth stocks but aren't so price-conscious that they land in value territory. Stocks in the middle 20% of the capitalization of the U.S. equity market are defined as mid-cap. The blend style is assigned to portfolios where neither growth nor value characteristics predominate.
Mid-Cap Growth: Some mid-cap growth portfolios invest in stocks of all sizes, thus leading to a mid-cap profile, but others focus on midsize companies. Mid-cap growth portfolios target U.S. firms that are projected to grow faster than other mid-cap stocks, therefore commanding relatively higher prices. Stocks in the middle 20% of the capitalization of the U.S. equity market are defined as mid-cap. Growth is defined based on fast growth (high growth rates for earnings, sales, book value, and cash flow) and high valuations (high price ratios and low dividend yields).
Small Value: Small-value portfolios invest in small U.S. companies with valuations and growth rates below other small-cap peers. Stocks in the bottom 10% of the capitalization of the U.S. equity market are defined as small cap. Value is defined based on low valuations (low price ratios and high dividend yields) and slow growth (low growth rates for earnings, sales, book value, and cash flow).
Small Blend: Small-blend portfolios favor U.S. firms at the smaller end of the market-capitalization range. Some aim to own an array of value and growth stocks while others employ a discipline that leads to holdings with valuations and growth rates close to the small-cap averages. Stocks in the bottom 10% of the capitalization of the U.S. equity market are defined as small cap. The blend style is assigned to portfolios where neither growth nor value characteristics predominate.
Small Growth: Small-growth portfolios focus on faster-growing companies whose shares are at the lower end of the market-capitalization range. These portfolios tend to favor companies in up-and-coming industries or young firms in their early growth stages. Because these businesses are fast-growing and often richly valued, their stocks tend to be volatile. Stocks in the bottom 10% of the capitalization of the U.S. equity market are defined as small cap. Growth is defined based on fast growth (high growth rates for earnings, sales, book value, and cash flow) and high valuations (high price ratios and low dividend yields).
RIFIS-26360
A message from Advisor Perspectives and VettaFi: To learn more about this and other topics, check out some of our webcasts.
Membership required
Membership is now required to use this feature. To learn more:
View Membership BenefitsSponsored Content
Upcoming Virtual Events View All


