Our recent webinar on long-term expected returns raised a crucial question: REITs and emerging market (EM) stocks are closely correlated with U.S. large-caps, with most investors intuitively expecting both assets to have a beta near 1, so why are their expected returns so much higher?
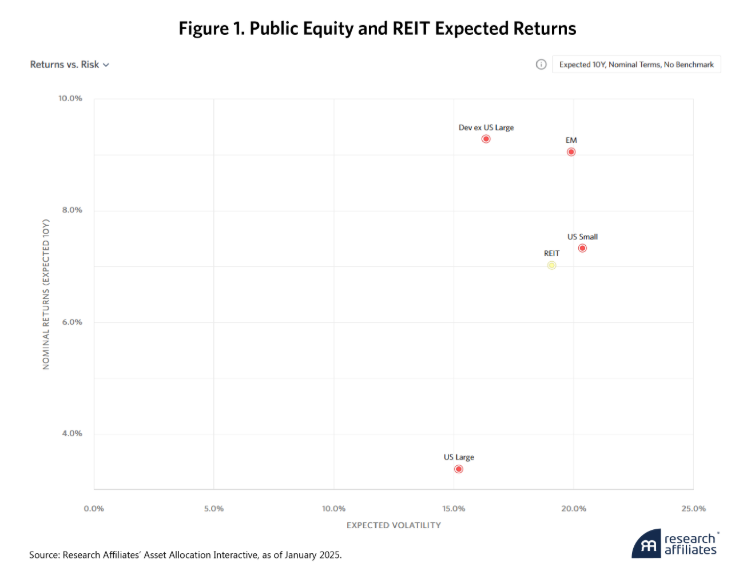
According to Research Affiliates’ Asset Allocation Interactive (AAI) online capital market expectations tool, U.S. large-cap equities are expected to yield 3.4% annually over the next 10 years compared to 9.1% for EM equities and 7% for REITs. This left many webinar participants wondering, How does this extra return square with these assets having similar betas?

To understand the return differences, we should first deconstruct expected returns into underlying components, particularly variations in yield, fundamental (dividend and earnings) growth, and valuations. According to our models, both EM equities and REITs have higher yields than U.S. large caps, and while growth rates differ, both EM equities and REITs are undervalued, while U.S. large caps are overvalued. To be sure, all this may help explain the sizeable difference in expected returns, but it doesn’t yet answer our clients’ beta question.
So, let’s look at the data. The scaled covariance between U.S. large-cap equities and REITs daily since 1998 yields a beta of 0.97. The scaled covariance between U.S. large-cap and EM equities monthly1 since 1998, with all returns in dollars,2 gives us a beta of 1.01. On the face of it, the intuition is correct.
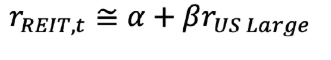
Using the capital asset pricing model (CAPM), we express the relationship between the return of the REIT asset class and its beta to U.S. large caps as follows.3 The same relationship applies to EM.
These ~1 since-inception betas imply that EM equities and REITs would not add much in the way of portfolio diversification benefits to U.S. large-cap equities. But if both assets have a beta of 1, our expected return models are implying the potential for meaningful alpha in the range of 5.7% for EM equities and 3.6% for REITs. So pure, bottom-line-focused investors could enhance their portfolio returns by adding these assets.
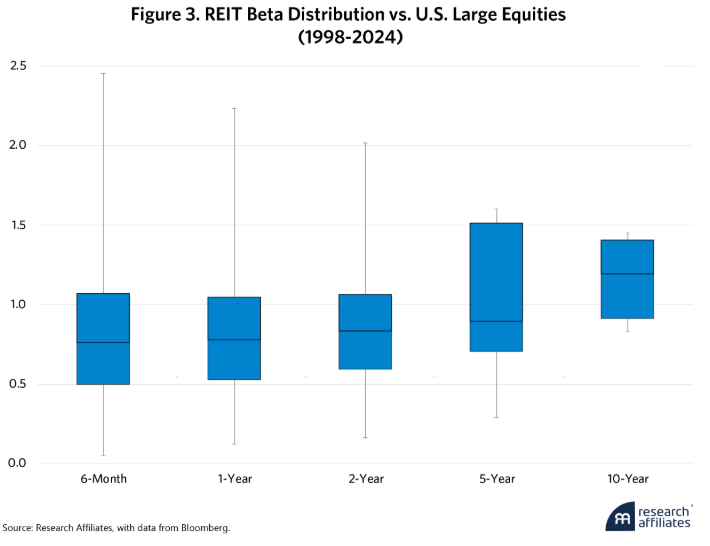
For investors looking to diversify against portfolio risk, however, the since-inception betas are sobering. But they may also be misleading. The beta between REITs and U.S. large caps can diverge from 1, even at long horizons of, say, 10 years. In fact, the median beta over all horizons is not 1 and is often much lower. This implies that while the one 26-year time frame sample shows little diversification benefit,4 shorter intervals within that period tell quite another story, one that investors with different time horizons should bear in mind.
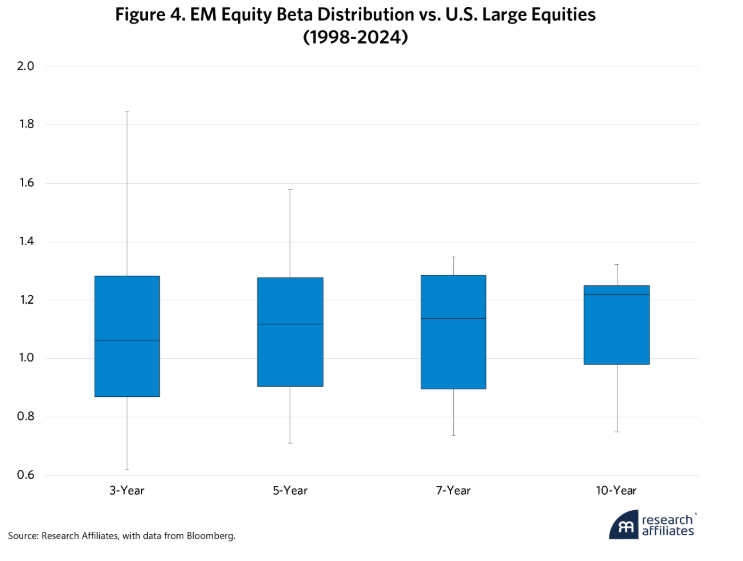
Indeed, EM equities follow a similar narrative, even when using monthly data, albeit with slightly tighter distributions. Both asset classes can, and do, offer diversification to U.S. equities when viewed over time.
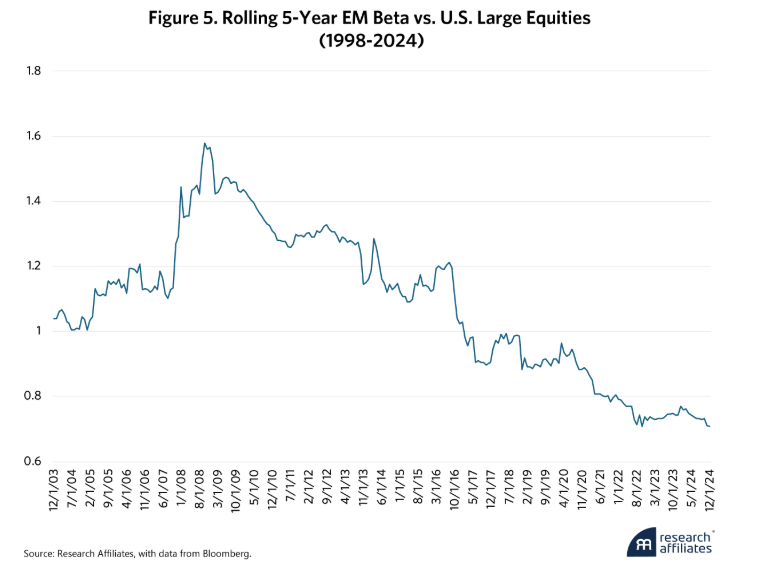
What’s even more surprising, the beta between EM and U.S. large-cap stocks has been falling since the global financial crisis (GFC) in 2008. While the 5-year beta peaked at 1.6 during the GFC, it has plunged to below 0.8 in the years since.
As for the diversification question, these charts show that since-inception betas don’t always tell the full story. Betas can vary greatly depending on the time horizons, so investors must be thoughtful and deliberate when determining theirs.
For purely return-focused investors, on the other hand, AAI is clear: REITs and EM equities now offer significant alpha opportunities.
1 Due to time zone issues, wherein the trading day in one country may overlap with the next day in another country, we must adjust the data adjustments when comparing daily data relationships across countries. As data frequency becomes less granular, those issues become less relevant. Here, for simplicity, we stick with monthly data when comparing across countries, but our findings are even more decisive with daily adjusted data.
2 Here we use dollars as the common currency, though any currency would have sufficed so long as both assets were priced in it.
3 Here we ignore any measurement error term.
4 As more 26-year periods accumulate, even such long intervals will still show distributions that are not always 1.
Please read our disclosures concurrent with this publication: https://www.researchaffiliates.com/legal/disclosures#investment-adviser-disclosure-and-disclaimers.
A message from Advisor Perspectives and VettaFi: To learn more about this and other topics, check out some of our webcasts.
© Research Affiliates
Read more commentaries by Research Affiliates