Key takeaways
-
To determine how much of each stock should be held in a growth equity index, the most popular methods are cap weighting and equal weighting, but these approaches tend to leave investors choosing between a rule that overweights expensive expectations or one that ignores magnitude.
-
A potentially better alternative may be weighting based on realized fundamental growth (i.e., fundamental growth weighting), an approach designed to deliver higher risk-adjusted returns, tighter alignment with growth style, and more resilient performance in higher-stress periods.
-
Investors may want to allocate more capital to companies that are actually growing and less to companies whose growth is more fully priced. Moreover, scalability should not be compromised.
Que Nguyen is the corresponding author.
Every dollar in a growth equity index reflects two decisions: which companies to own and how much of each to hold. Indexes form intricate systematic rules to make the first decision. The second decision—position sizing—is usually determined by market-cap weighting.
That choice may look neutral, but it isn’t.
Cap weighting systematically allocates the most capital to the stocks where expectations (and valuations) are already highest. In a growth portfolio, that means concentrating capital in the names the market has already priced for the most optimistic outcomes. The result tends to be a persistent drag because allocators end up paying the most (in the largest size) for growth that is already embedded in price.
Equal weighting is often presented as the solution. To be fair, it does remove the price bias, but it also discards information about scale. A firm compounding billions of dollars in incremental earnings receives the same weight as one with negligible growth. The price distortion is replaced with a size distortion, introducing implementation challenges and diluting the economic footprint of the portfolio. If cap weighting and equal weighting were the only alternatives, investors would face an unappealing choice between one rule that overweights expectations and another that ignores magnitude. Fortunately, there is a better way.
Fundamental growth weighting is designed to allocate capital based on the growth that companies have actually delivered rather than the market’s expectations for future growth. We measure growth in dollar terms using a composite of sales, profitability, and reinvestment, which is averaged over multiple horizons to reduce noise (For methodology and empirical results, see “Outgrowing Glamour: A Fundamental Approach to Growth Investing"). This approach anchors growth exposure in realized business fundamentals rather than valuation multiples, eliminating the price tilt without introducing the size blind spot. In this article, we address a simple but underappreciated question: Does the way investors size positions reinforce the growth thesis or dilute it? The evidence of the past 56 years of market history suggests a clear conclusion: Cap weighting is not an efficient way to implement a growth strategy, and equal weighting removes one distortion only to introduce another. Moreover, weighting by realized fundamental growth has historically delivered higher risk-adjusted returns, tighter alignment with the growth style, and more resilient performance in the periods that matter most.
Fundamental growth weighting is designed to allocate capital based on the growth that companies have actually delivered rather than the market’s expectations for future growth.
Same Stocks, Different Weights
To isolate the effect of weighting, we construct a simple controlled test that holds the stocks constant and varies only how capital is allocated.
We begin by separating two dimensions that are often conflated in traditional style frameworks: price and fundamental growth. Each stock is classified along these axes using book-to-price (valuation) and five-year sales-per-share growth (realized growth), splitting the universe into four groups:
-
Expensive and fast growing: classic growth stocks.
-
Cheap and fast growing: growth at a reasonable price (GARP).
-
Expensive and slow growing: the glamour trap.
-
Cheap and slow growing: deep value (excluded from this analysis).
This structure allows us to evaluate weighting decisions within economically distinct segments of the growth universe rather than across a blended and ambiguous style definition.
Within each segment, we apply three alternative weighting rules to the same set of stocks:
-
Cap weight: weight by market capitalization (the default behind most indices).
-
Equal weight: Every name gets the same weight, removing price but ignoring scale.
-
Fundamental growth weight: Allocated according to realized dollar growth in the business.
Because stock selection is held fixed within each segment, any difference in performance comes entirely from how capital is distributed across the same names. The exercise is therefore a direct test of our thesis to determine whether the weighting rule reinforces or dilutes the intended growth exposure.
We implement this framework on the 1,000 U.S. companies with the largest market cap, rebalancing annually from March 1970 through April 2026. The result is a clean comparison of three ways to allocate capital within—and across—the growth opportunity set.
Read more: Are Rate Hikes on the Way?
Expensive/High Growth: Where Cap Weighting has Historically Done the Most Damage
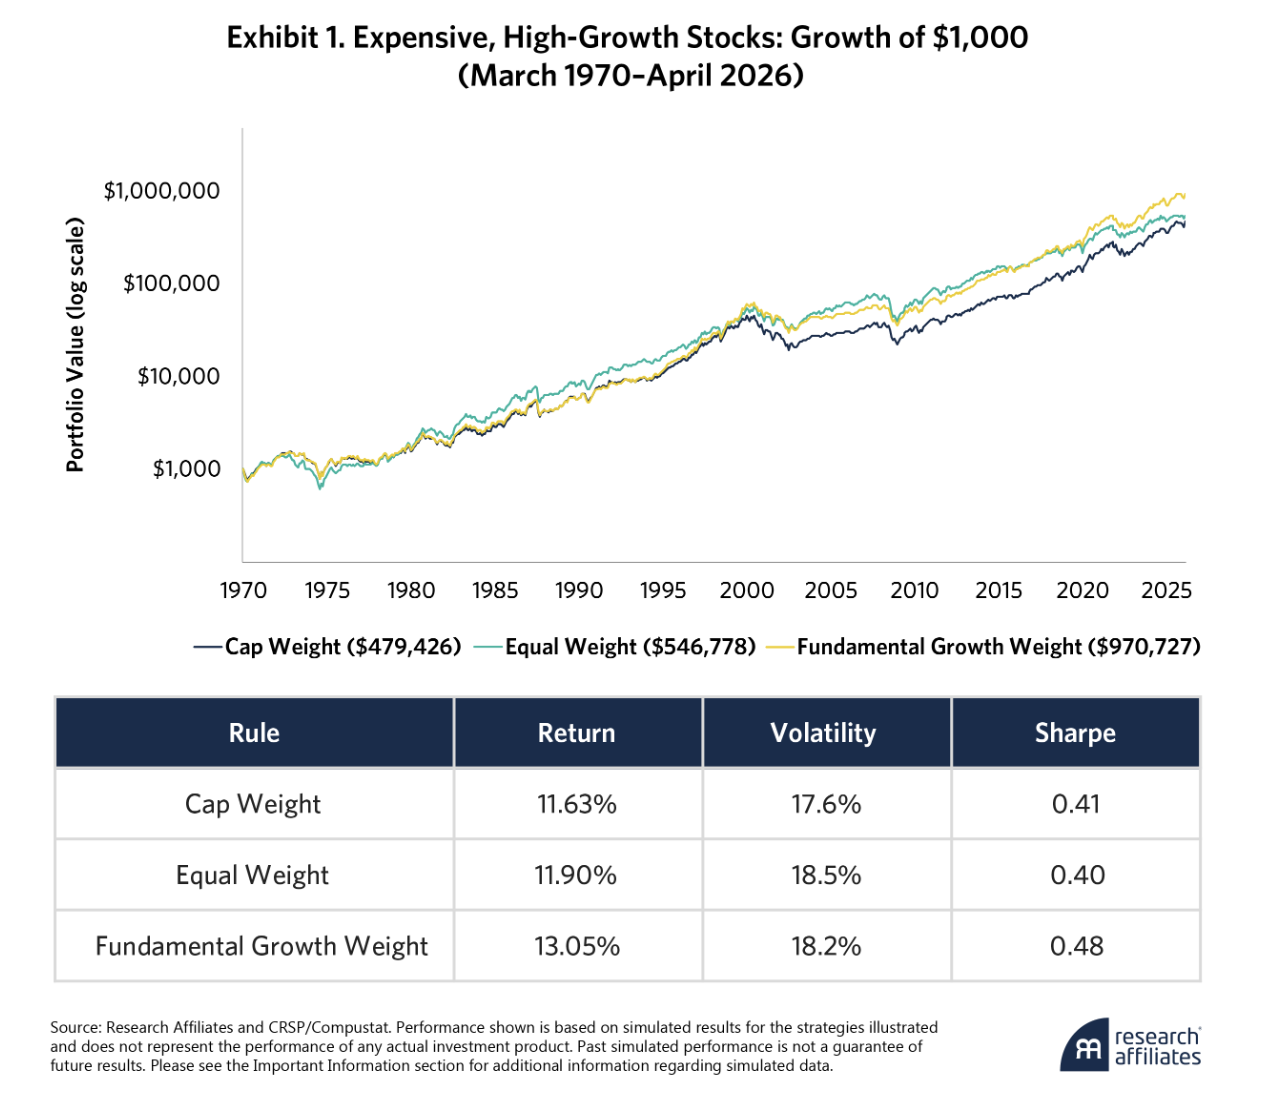
This is the core growth portfolio, consisting of firms that are both richly priced and compounding earnings growth. It is also where the weighting decision has tended to matter most.
This portfolio amplifies cap weighting’s problem, as shown in Exhibit 1. The biggest weights go to the names with the most stretched multiples and the largest market values. As a result, the portfolio ends up doubling down on exactly the stocks that are most likely to be repriced downward when valuations contract.

Equal weighting and fundamental growth weighting both avoid this mistake. While equal weighting boosts performance by 27 bps, it also takes on meaningfully higher volatility, leaving the Sharpe ratio unchanged compared with simple cap weighting. Fundamental growth weighting is the clear winner, adding 142 bps relative to cap weighting with a slightly better Sharpe ratio.
Another disadvantage with equal weighting is that it is difficult to scale to institutional size. Its historical weighted-average market capitalization ($23 billion) is only 11.7% of cap weighting’s ($196 billion) and 12.0% of fundamental growth weighting’s ($189 billion).
The difference compounds dramatically over time, revealing how the mechanisms work. Cap weighting doubles down on market expectations. Equal weighting reduces the mega-cap concentration but treats a firm that is tripling earnings the same as one with flat fundamentals. As a result, in addition to causing the price tilt, equal weighting disregards growth information. Only fundamental growth directs capital toward the firms that are actually compounding while still allowing a larger compounder to carry more weight.
When growth is expensive, cap weighting overpays for it and equal weighting ignores the scale of growth but fundamental growth allocates capital to stocks where growth is actually occurring.
Cheap/High Growth: Similar Outcomes, Different Economics
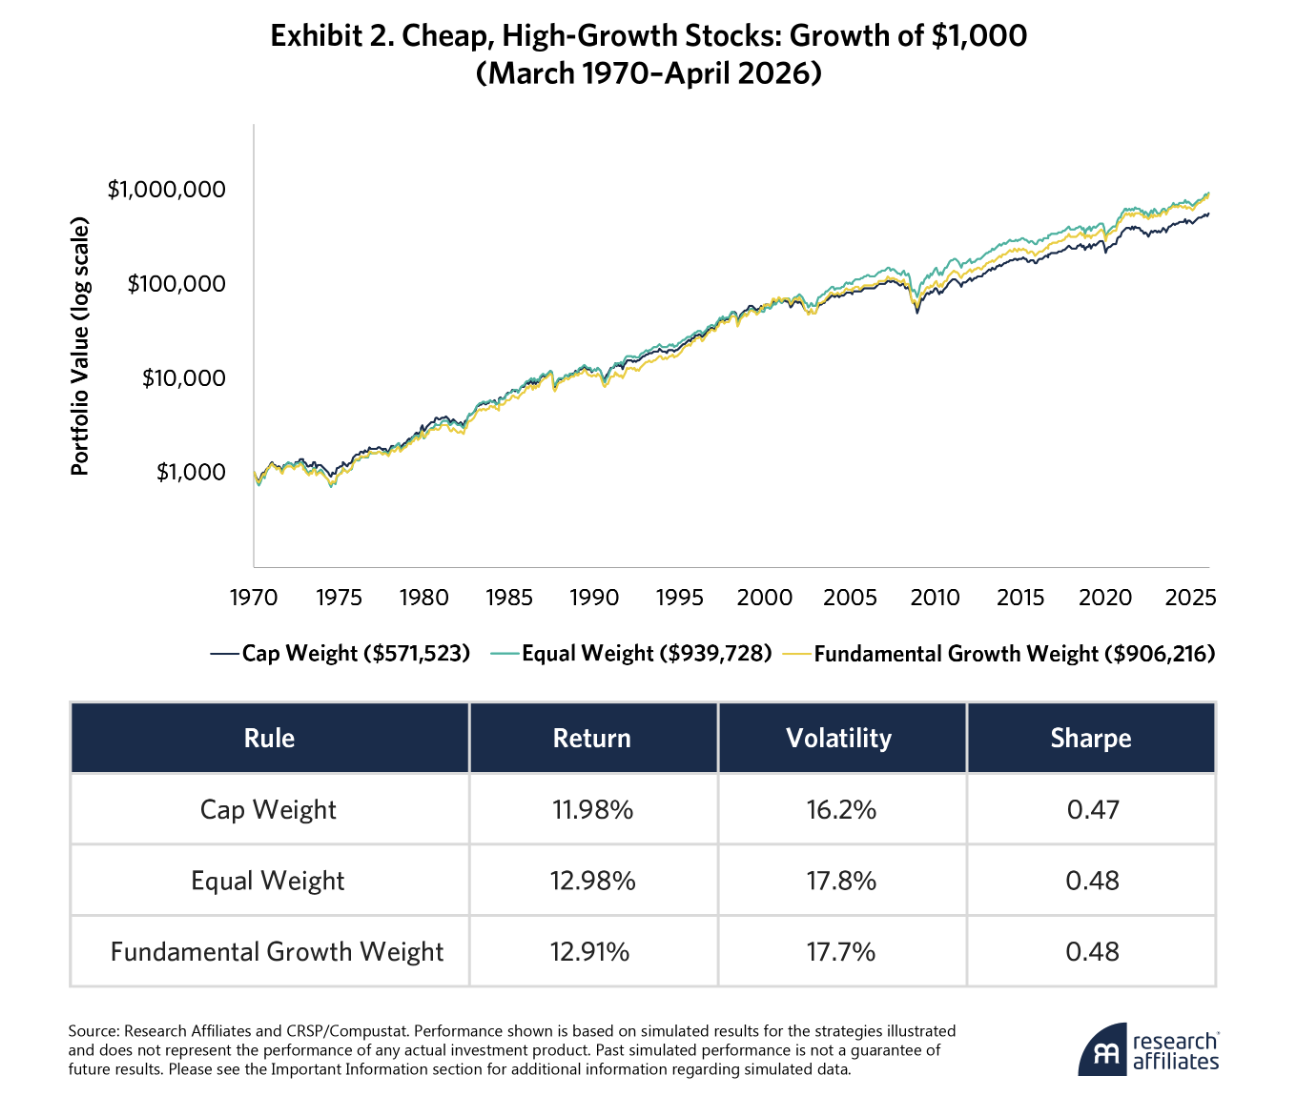
In GARP territory—cheap and growing—the three approaches deliver less distinct results, as shown in Exhibit 2.
Because these stocks have desirable qualities on two dimensions (growing but still cheap), cap weighting delivered stronger results (12%) relative to the cap-weighted portfolio of core growth stocks in the previous example (11.6%). Equal and fundamental growth weighting can improve on cap weighting, but they do so through different mechanisms. Equal gets there by overweighting smaller names that happen to be cheap and growing, resulting in size distortion. Fundamental growth gets there by following fundamentals directly and thus avoids size distortion. The headline returns look the same; the cost of actually implementing the portfolios is not.
Equal weighting actually posts the highest return in this quadrant, but that outperformance comes with a small-cap tilt that may limit scalability for institutional investors. Its historical weighted-average market capitalization ($10 billion) is only 19.1% of cap weighting’s ($55 billion) and 24.3% of fundamental growth weighting’s ($43 billion).
Thus, fundamental growth produces similar returns by following the underlying economics but with a critical difference—its portfolio can scale.
Expensive/Low Growth: The Control That Still Confirms the Mechanism
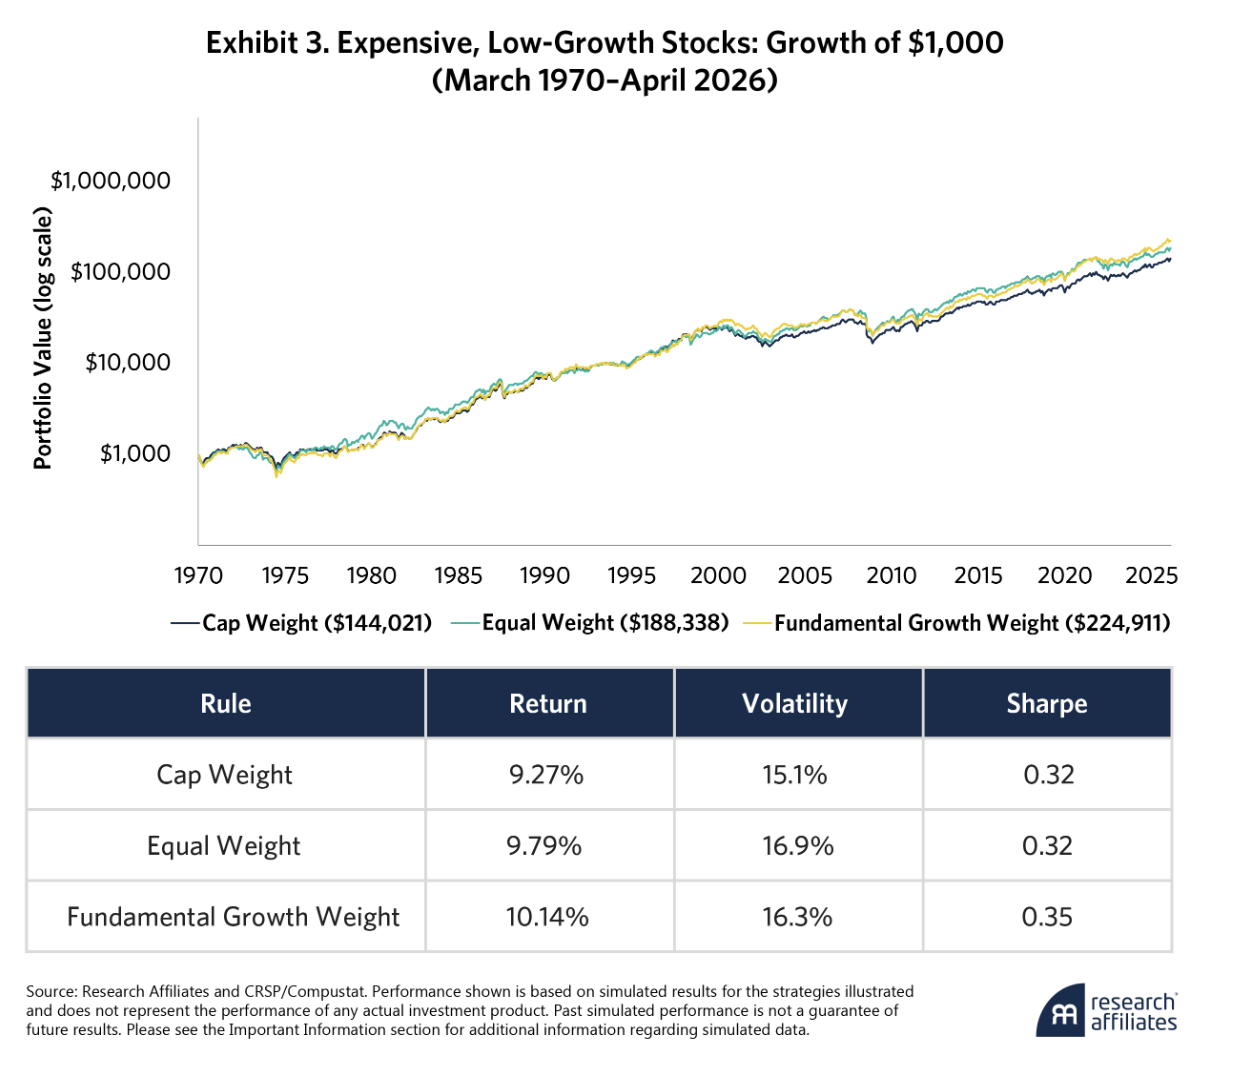
This quadrant—expensive, slow-growing firms—is where growth has disappointed, but valuations still remain elevated. Traditional growth indexes often contain these companies in spite of their lack of growth.
The poor characteristics of these stocks lead to the lowest returns and Sharpe ratio among the three quadrants, as shown in Exhibit 3. Both equal and fundamental weighting improved these results. Fundamental growth weighting delivered the highest return and best Sharpe ratio. Cap weighting concentrates in the largest, most narrative-driven names, and equal weighting spread capital evenly regardless of how weak the underlying fundamentals are.
Even in a basket of expensive, slow-growing stocks the degree of weakness varies across firms. Fundamental growth allocates toward the least-weak companies—the ones where some growth remains—avoiding the worst of the group.
Where Each Rule Sends the Money
So far, we have looked at how each rule weights names within each quadrant. In this section, we examine how each rule distributes capital across quadrants.
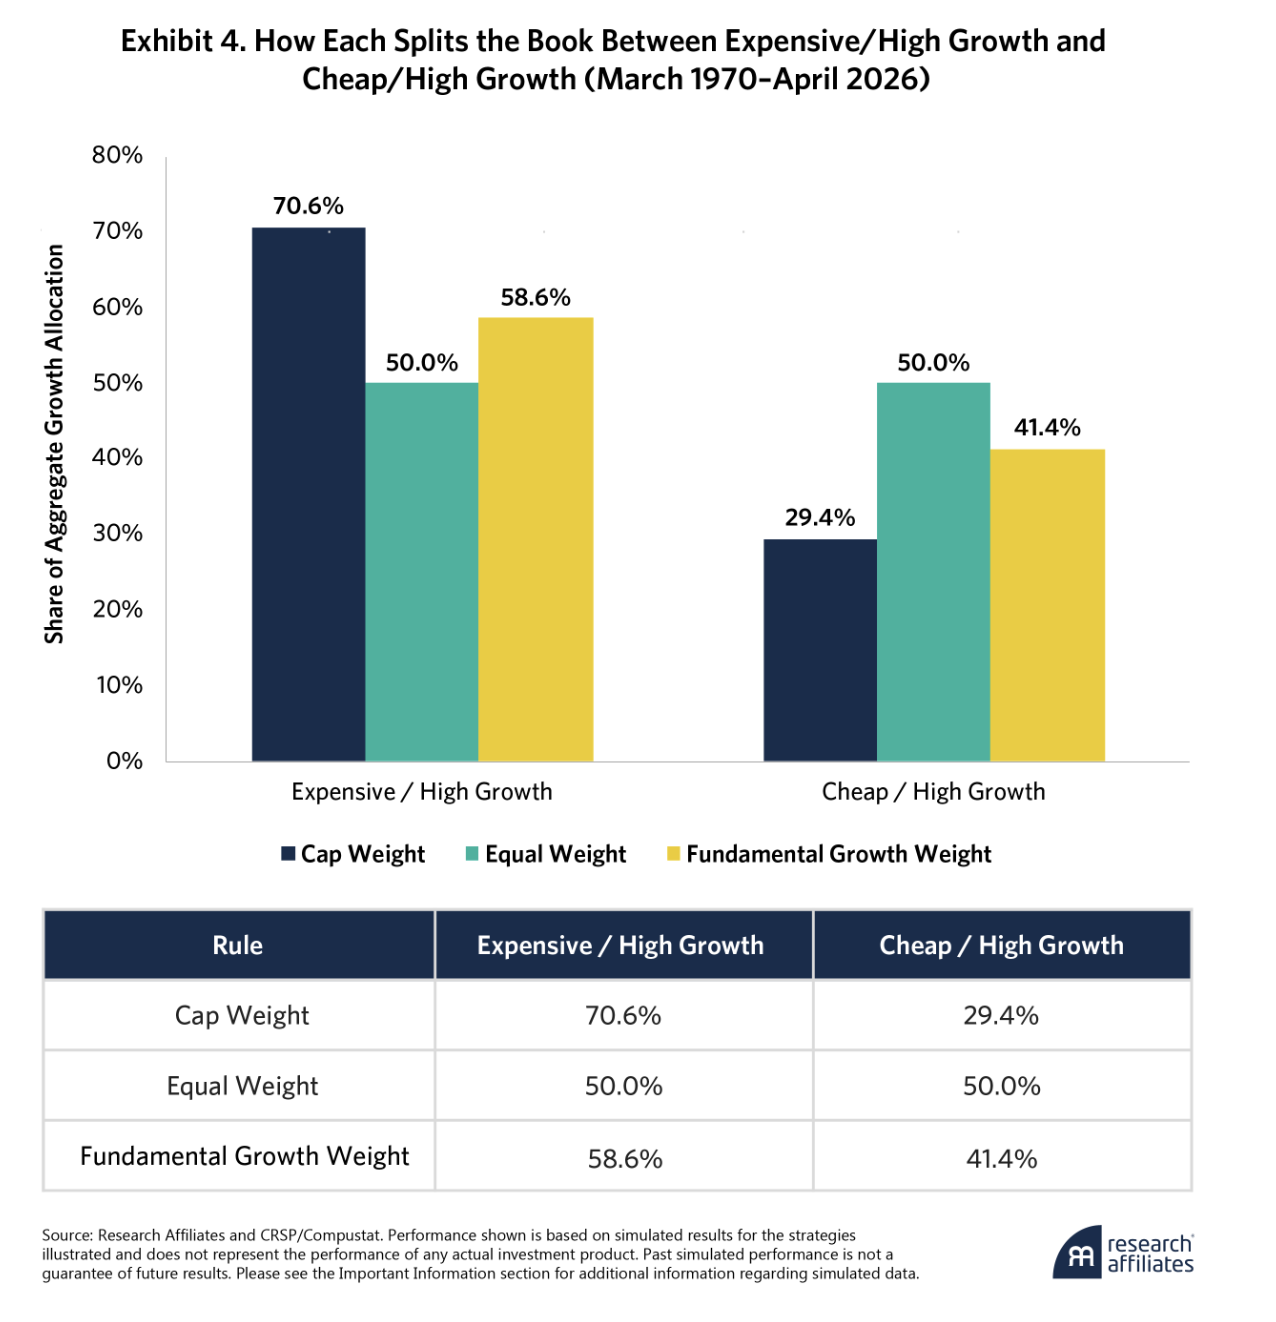
We pool the names in the two growth-relevant quadrants—Expensive/High Growth and Cheap/High Growth—and apply each rule across the combined set. Expensive/Low-Growth is excluded from this pool because a real growth book would not deliberately hold the glamour trap. Equal weight serves as a diagnostic baseline, splitting capital 50/50 by construction. Cap weighting over-allocates not just to expensive names within each quadrant but also to the more expensive quadrant itself. Fundamental growth weighting redistributes toward the quadrant where realized growth is most abundant relative to price, as shown in Exhibit 4.
Cap puts 70.6% of the book into Expensive/High Growth, leaving only 29.4% for Cheap/High Growth. Fundamental growth tips the balance toward GARP territory (58.6% to EHG and 41.4% to CHG), with roughly 12 percentage points more capital (about 40% more overall) flowing into the cheaper, equally compounding names.
The weight difference shows up in performance. Combined across EHG and CHG, cap weighting earns roughly 11.7% annualized while fundamental growth weighting earns roughly 13.0%—about 125 bps more per year on the same growth book.
The same mechanism that distinguishes the rules within a quadrant (weighting by realized growth, not by price) also distinguishes them across the book.
Style Exposure, Valuation, and Implementation
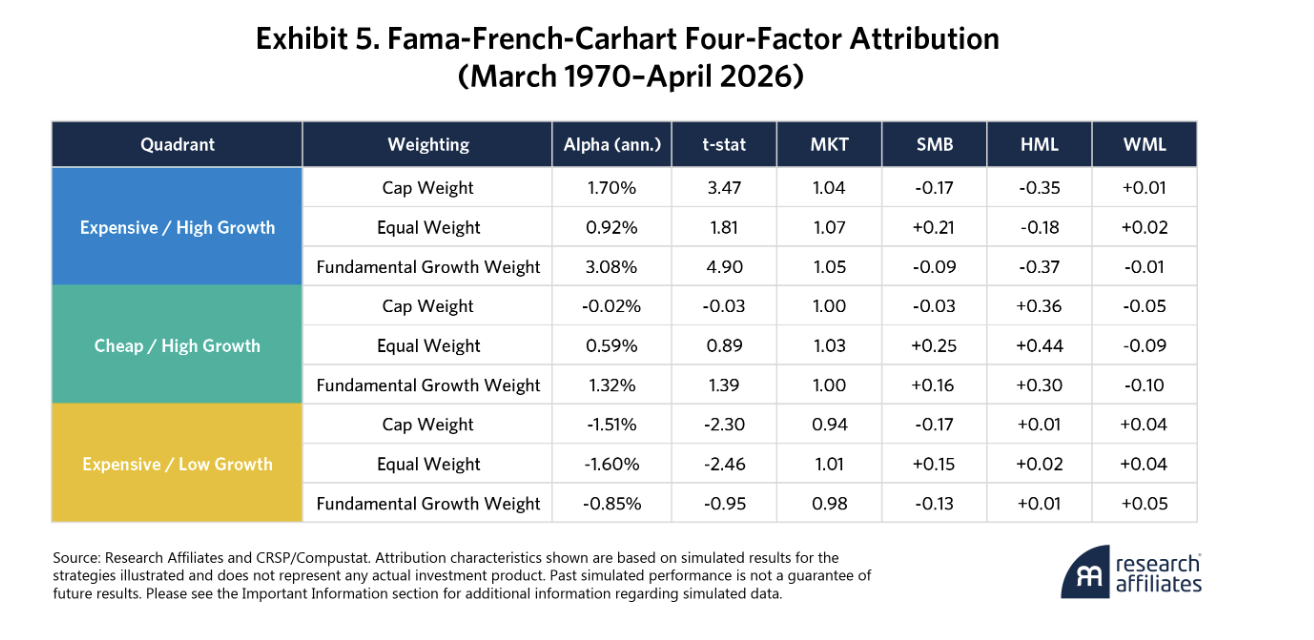
Higher returns alone do not prove a portfolio has a better implementation of its exposure. The key question is whether the improvement reflects a cleaner expression of growth or of unintended tilts in style, size, or valuation. To check that, we use a Fama-French-Carhart four-factor framework to decompose the return along statistical lines and along fundamental lines, as shown in Exhibit 5.
Across all three quadrants, fundamental growth weighting is not a different bet. Rather, it is a more disciplined version of growth.
Both cap-weighted and fundamental growth portfolios maintain the strong negative HML loading expected of a growth strategy. Equal weighting, in contrast, dilutes this exposure by shifting capital toward relatively cheaper (and typically smaller) names within each group. The result is a weaker and less consistent growth tilt.
The same distinction appears with size (SMB). Cap weighting is mechanically large-cap, whereas equal weighting introduces a small-cap bias. Fundamental growth (by measuring growth in dollar terms) remains anchored in economically large businesses. In Expensive/High Growth, the weighted-average market capitalization reveals an important distinction, with $190 billion for cap weighting, $184 billion for fundamental growth, and only $22 billion for equal. This finding highlights the implementation gap between a scalable strategy and one that is not.
Momentum (WML) exposure is minimal across all approaches. Where it appears, it reflects a mild tendency for both equal and fundamental growth to rebalance away from recent price winners. The result is limited dependence on momentum and no hidden exposure to momentum-driven drawdowns.
The alpha findings reinforce the same conclusion. Within each quadrant, fundamental growth delivers the highest and most statistically significant alpha, and equal weighting’s alpha is smaller and generally insignificant. Because stock selection is held constant, these differences reflect how effectively each approach allocates capital within the same opportunity set.
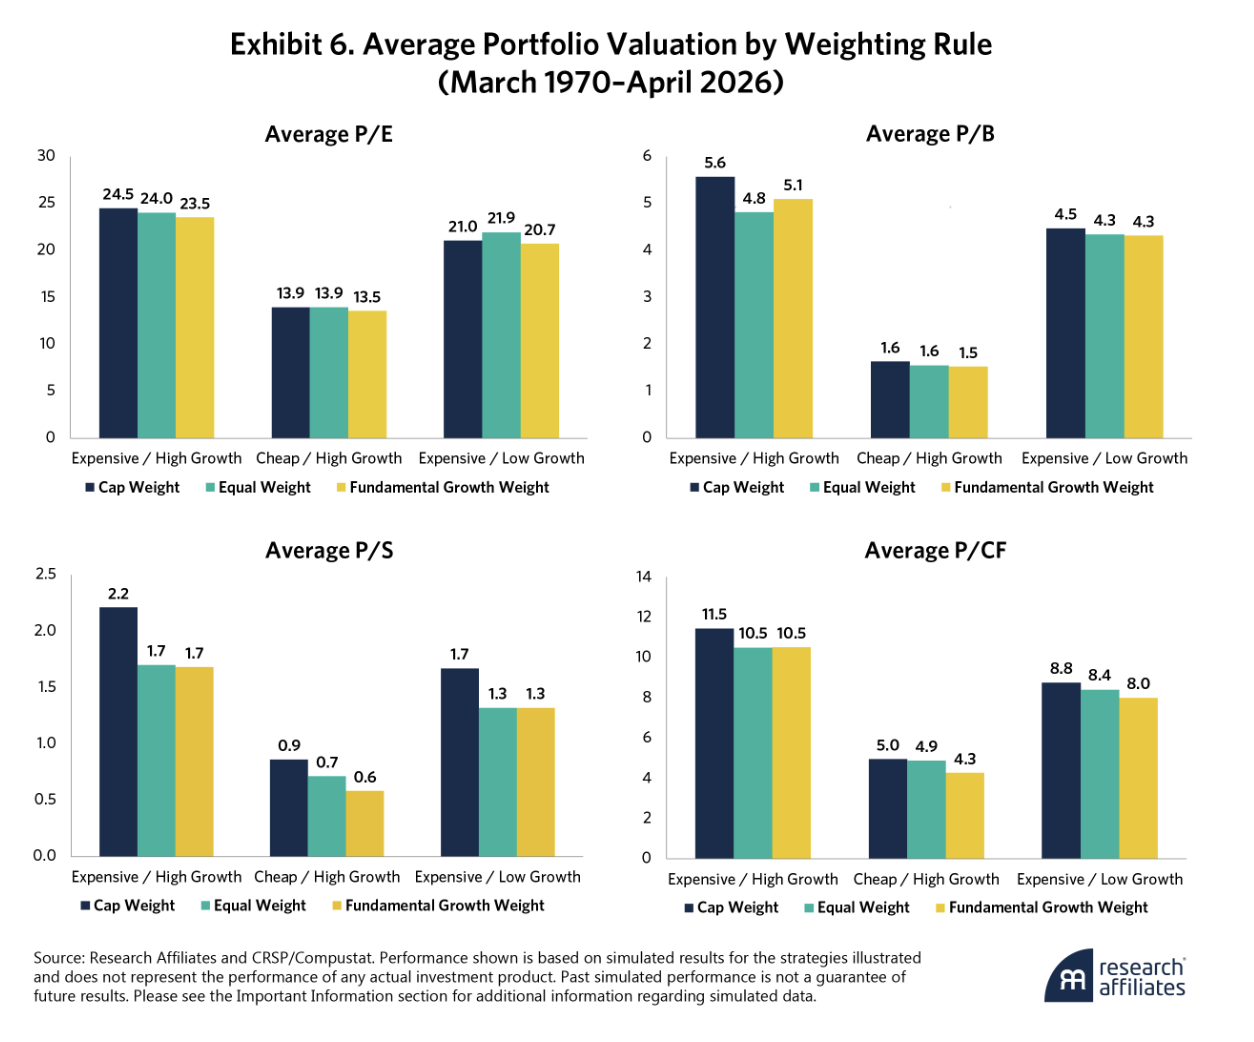
This discipline extends directly to valuation, as shown in Exhibit 6. Without using any explicit value screen, fundamental growth systematically delivers a cheaper portfolio than cap weighting does. By anchoring weights to realized fundamentals rather than market price, it naturally underweights companies whose valuations have run ahead of their earnings base and overweights companies whose fundamentals have outpaced price. In the EHG quadrant, this difference results in a persistent valuation discount—roughly 4% on P/E and 8% on P/CF—despite holding the same stocks.
Importantly, this valuation advantage does not come at the cost of style drift. The HML loadings confirm that the portfolio remains firmly aligned with a growth mandate. It is not becoming “value like” but simply avoids overpaying for growth.
Taken together, the evidence suggests a compelling story:
-
Cap weighting preserves growth exposure but embeds a price-driven distortion, allocating capital toward the most expensive names.
-
Equal weighting removes the price bias but replaces it with a size distortion, weakening both style purity and scalability.
-
Fundamental growth weighting preserves intended growth exposure and introduces valuation discipline as a byproduct, allocating capital to stocks where growth is actually occurring instead of to stocks where it is most highly priced.
Stress Periods Reveal the Difference
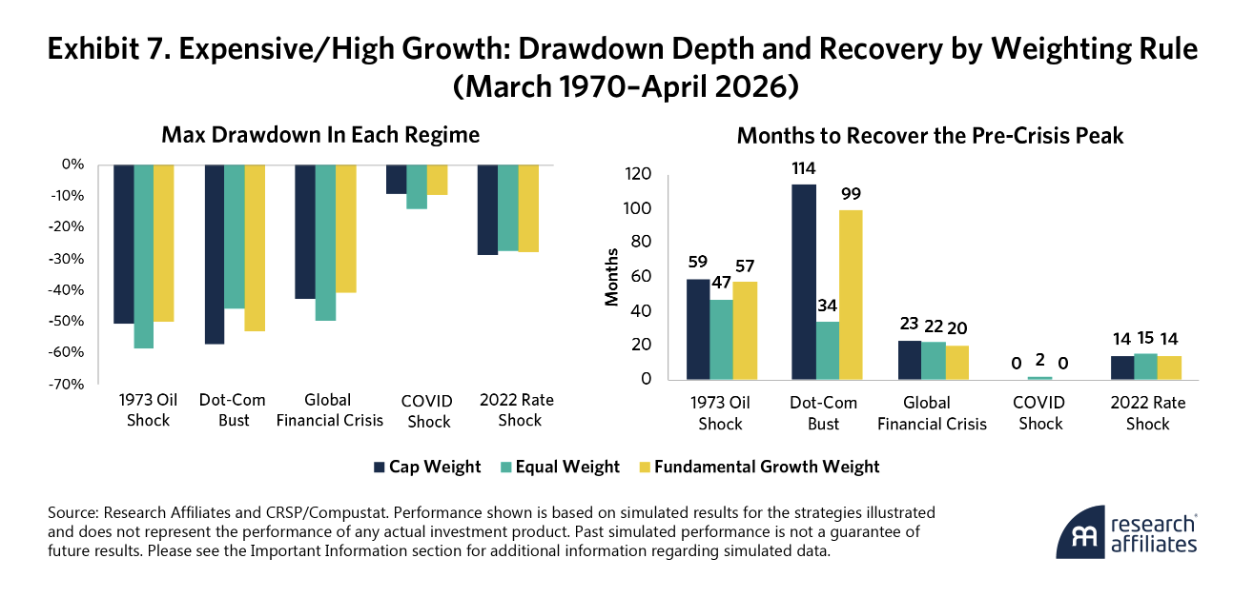
If the differences in performance reflect genuine discipline rather than incidental tilts, they should be most visible when markets are under stress. Although full-sample Sharpe ratio is a useful summary, investors judge growth strategies in the moments when they break—and that is where cap weighting's concentration in the richest names is most exposed. The five regimes in Exhibit 7 span every major drawdown in the sample.
Fundamental growth is shallower than cap-weighted in four of five regimes and recovers at least as quickly in every regime except 1973. Dot-com is the exception. Equal weighting's accidental small/value tilt into 2000 was correct but lucky. In every other episode, including COVID and 2022, fundamental growth's stress behavior is directionally better than cap's.
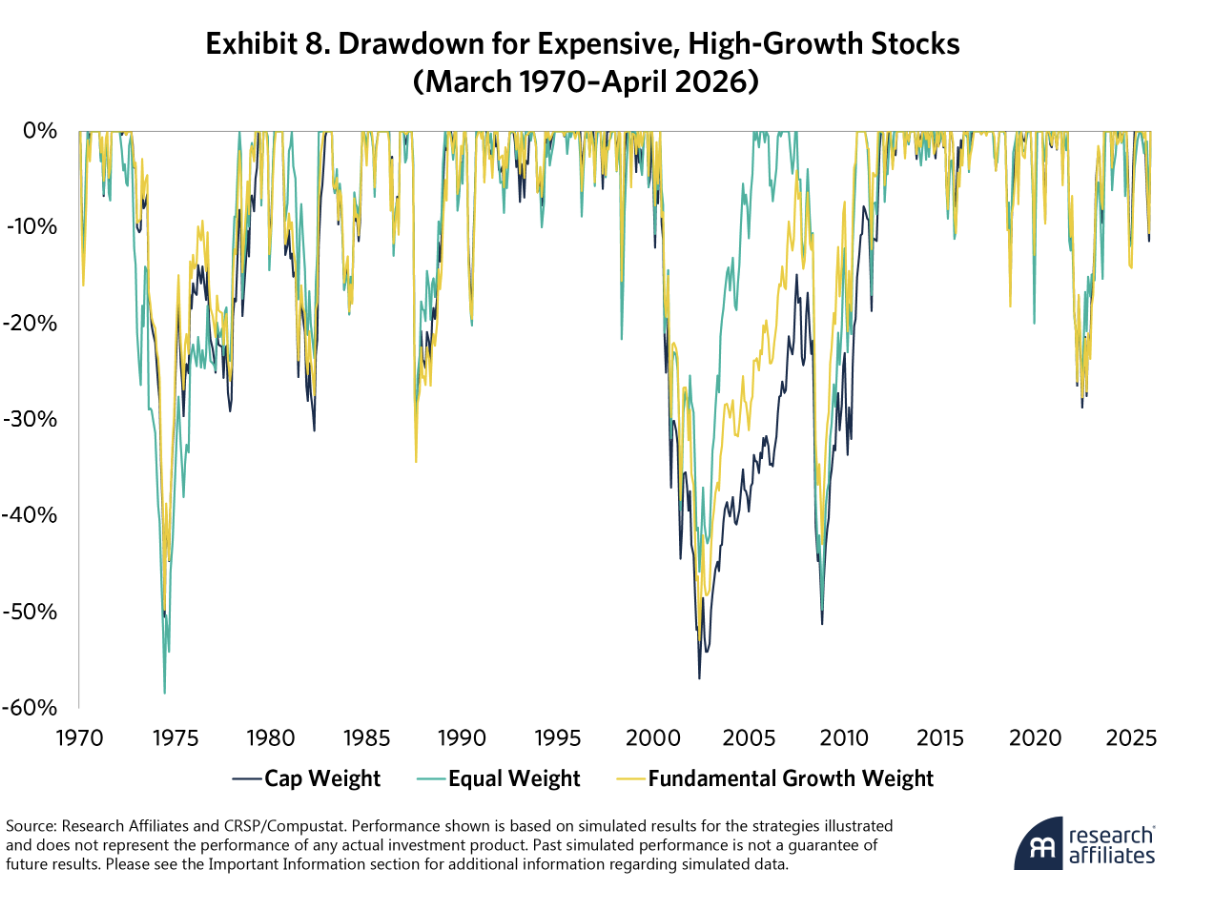
Exhibit 8 makes the pattern clear. Fundamental growth is either the shallowest drawdown or within inches of it in almost every episode, and its recovery is almost always the shortest. Carrying less weight in expensive names may matter most when expensive names are repriced.
The full-sample max drawdown reinforces the finding, with −52.9% for fundamental growth, −56.9% for cap, and −58.4% for equal. The gap is visible in every stress episode in the sample, not just one.
Weight What Is Growing, Not What Is Expensive
Weighting is not a secondary detail—it is a core design choice.
When selection is held constant across 56 years of U.S. data, the evidence is compelling. Cap weighting systematically dilutes the growth thesis by allocating the most capital to the most expensive stocks. Equal weighting removes that bias but replaces it with a size distortion, weakening both implementation and style fidelity.
Fundamental growth weighting takes a different approach. By anchoring weights to realized business growth, it seeks to preserve intended exposure while avoiding the size distortion and the problems with implementation and style fidelity. The result may be a more efficient allocation of capital with higher return and Sharpe ratio in every growth-relevant quadrant, stronger and more consistent alpha, a modest structural valuation advantage, and shallower drawdowns during periods of stress.
These outcomes are not driven by stock selection, factor timing, or unintended tilts. They reflect the simple mechanism of placing more capital in companies that are actually growing and less in companies whose growth is more than fully priced. If the objective is growth, we believe the portfolio should be weighted by growth, not by price, and scalability should not be compromised.
If the objective is growth, we believe the portfolio should be weighted by growth, not by price, and scalability should not be compromised.
In short, weight what is growing, not what is expensive.
https://www.researchaffiliates.com/legal/disclosures#investment-adviser-disclosure-and-disclaimers
References
Arnott, Robert D., Jason C. Hsu, and Philip Moore. 2005. “Fundamental Indexation.” Financial Analysts Journal 61(2): 83–99.
Arnott, Robert D., Chris Brightman, Campbell R. Harvey, Que Nguyen, and Omid Shakernia. 2026. “Fundamental Growth.” Financial Analysts Journal 82(2): 46–68.
Brightman, Chris, Campbell R. Harvey, Que Nguyen, and Omid Shakernia. 2025. “Why Hold Expensive Slow-Growing Stocks? An Alternative Framework for Value and Growth Indices.” Research Affiliates.
Nguyen, Que, and Omid Shakernia. 2025. “False Choices, Real Costs: Structural Flaws in the Growth–Value Duality.” Research Affiliates.
Nguyen, Que, Ari Polychronopoulos, and Omid Shakernia. 2026. “Outgrowing Glamour: A Fundamental Approach to Growth Investing.” Research Affiliates.
A message from Advisor Perspectives and VettaFi: Discover something new! Click here to register for our upcoming webcasts.
© Research Affiliates
More Mutual Funds Topics >