America Is the Only Major Market Without Publicly Traded Airports
Membership required
Membership is now required to use this feature. To learn more:
View Membership Benefits
Whenever I speak at investment conferences, I like to point out that we invest in a number of publicly traded airports. I even list them: Spain’s Aena. Aeroports de Paris. Zurich Airport. Airports of Thailand. Two of the world’s largest operators, Grupo Aeroportuario del Sureste and Grupo Aeroportuario del Pacifico, trade in Mexico.
Almost invariably, I get a bunch of blank stares because there are no publicly traded airports in the U.S.
Which is a shame—not just for investors, but for passengers.
See more: Lithium Was the Top Performing Commodity in H1
Air travel has rarely been healthier. Last year the world’s airports handled a record 9.8 billion passengers, according to Airports Council International (ACI), inching ever closer to the 10 billion mark. The 20 busiest airports alone moved 1.59 billion travelers, roughly 16% of everyone who flew.
Here at home, U.S. travel-agency air ticket sales topped $9.8 billion in May, up 15% from a year earlier, even as the number of trips has stayed flat. As someone who logs a lot of miles, I can tell you the planes are packed and the terminals are humming.
From Runways to Retail
If you’ve been in an airport in the past decade, you know that they’ve become something closer to shopping malls with runways.
They still collect landing fees and other charges from the airlines, or what the industry calls aeronautical revenue. But an enormous and growing share of their income now comes from everything else: the duty-free shops, the restaurants, the parking garages, the hotels and real estate. Globally in 2024, retail concessions made up about a quarter of airports’ non-aeronautical revenue and car parking another quarter, with property and food-and-beverage close behind.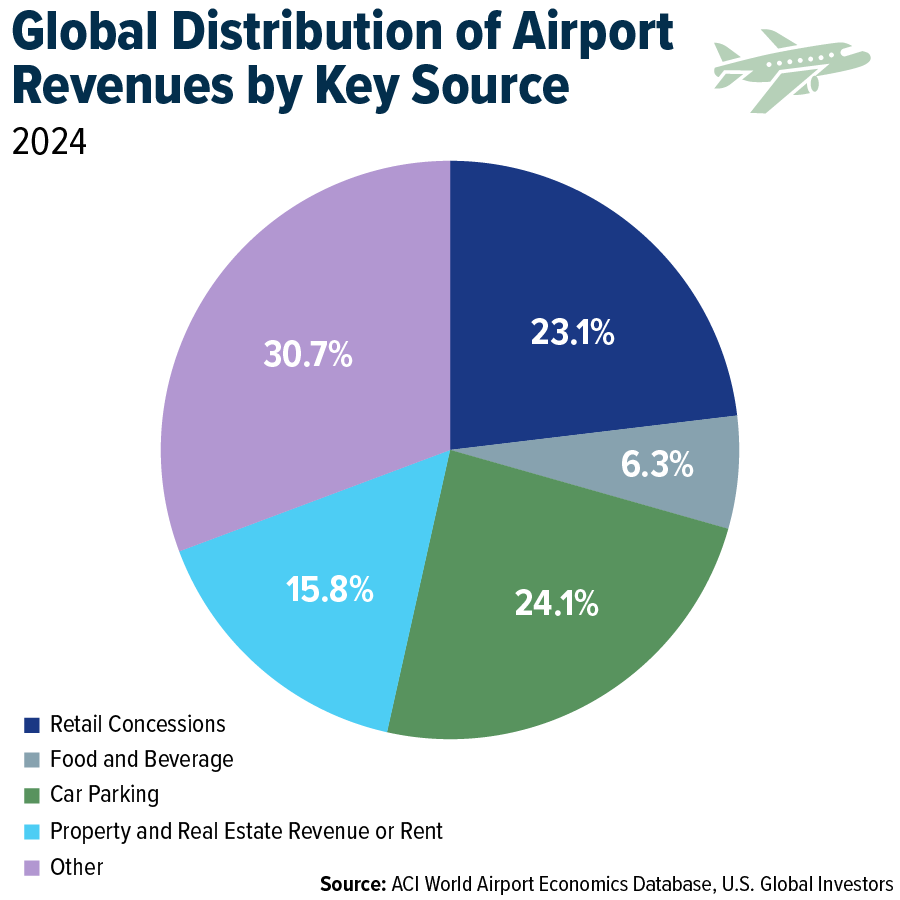
Across Europe, for instance, airport non-aeronautical revenue jumped more than 14% in 2025—far outpacing passenger growth—as operators leaned into these higher-margin, captive-audience businesses. When you’re standing in a terminal with two hours to kill, you are, in the truest sense of the word, a captive consumer.
The Benefits of a Wide Moat
One of the things I love most about airports is the size of their moat. One cannot simply build a competing international airport across the street from Heathrow or O’Hare. Most metropolitan areas support exactly one major airport, and the obstacles to a second—land, capital, regulatory approval, a decade of construction—are about as insurmountable as they come.
That kind of natural monopoly throws off steady, predictable cash flow.
Take a look below. Over the past five years, publicly traded airports, as measured by the Dow Jones Brookfield Airports Infrastructure Index, returned nearly 66% on a total-return basis. That edged out U.S. utilities at about 60% and left the airlines, as measured by the Dow Jones U.S. Airlines Index, more than 20 percentage points behind.
As you can see, airport stocks have behaved less like airlines and more like utility stocks, providing investors with a measure of stability.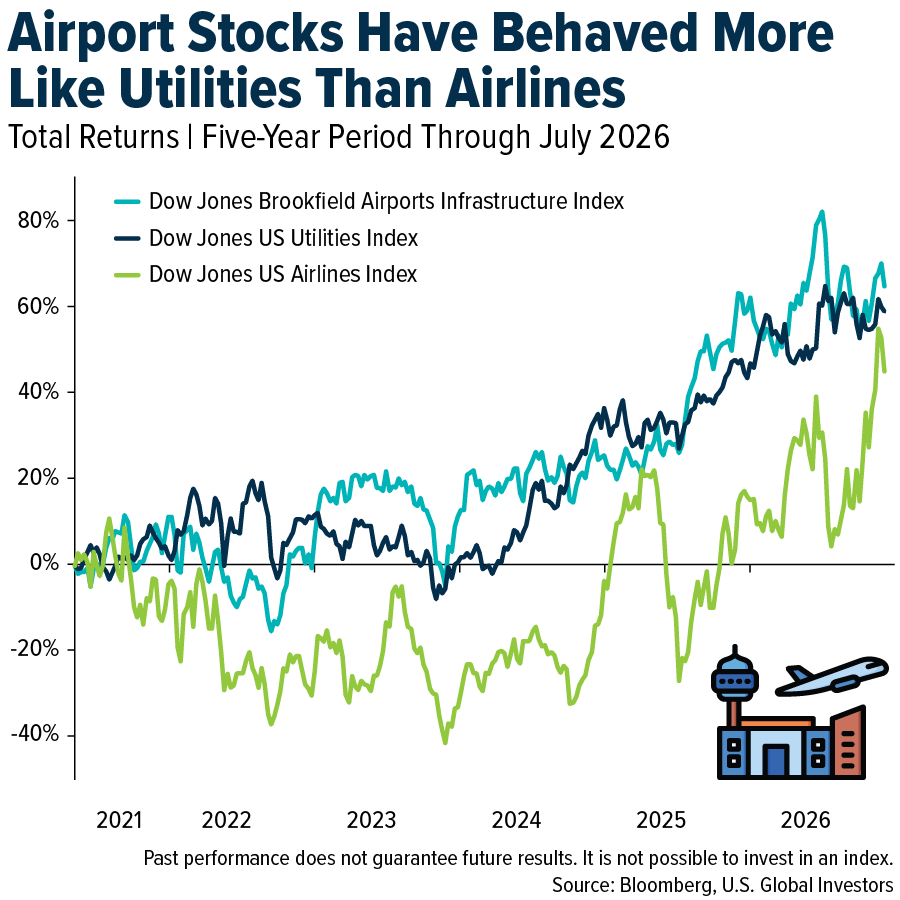
The Funding Cliff No One’s Talking About
So why should Americans care about a business we can’t buy at home? Because our airports need capital, and the old ways of raising it are running dry.
Three years ago, I wrote about how the U.S. was betting on infrastructure spending to meet surging demand, but I warned that a financial abyss remained.
Since then, that abyss has only widened. America’s airports now face an infrastructure bill north of $30 billion a year. ACI-North America pegs the 2025-2029 need at nearly $174 billion, up 15% from its prior estimate. All told, public money covers only about $12 billion a year against a need more than twice that size.
I see it in my own backyard. Here in San Antonio, home to U.S. Global Investors, our international airport is in the middle of a $2.5 billion expansion, complete with a long-awaited new terminal. Multiply that by every mid-size city in America, and you begin to grasp the scale of the shortfall.
The Rest of the World Figured This Out
The rest of the developed world addressed this problem decades ago by inviting private capital in. More than 850 airports across 90-plus countries now operate with some form of private-sector participation.
Before the pandemic, roughly 75% of European air passengers, two-thirds of Latin Americans and nearly half of all travelers in Asia-Pacific passed through privatized airports.
In North America? About 1%.
The United Kingdom kicked off the trend in 1987, selling the operator of Heathrow, Gatwick and Stansted. Today the 10 largest listed airport companies are worth a combined $152 billion.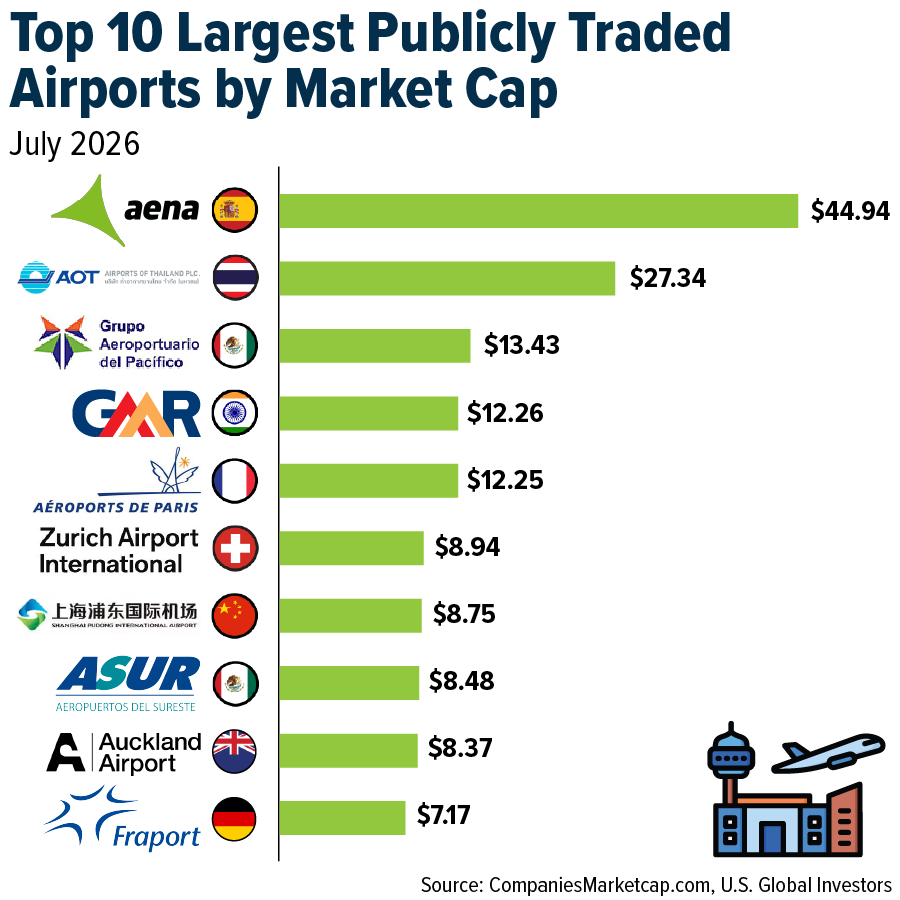
The results are encouraging. Independent research on privatized airports has found more airlines serving more destinations and lower average fares thanks to added competition, higher productivity and better passenger-satisfaction scores. Run by operators who treat them as real businesses rather than government cost centers, airports tend to get better.
To be fair, it isn’t a free lunch. Critics reasonably worry that private operators could push fees and ticket prices higher, and America’s own experiment has stalled repeatedly. St. Louis explored leasing Lambert International back in 2019, drew 18 international bidders, then watched the mayor scrap the plan over local politics. Since Congress first opened the door to airport privatization, not a single major U.S. airport has walked through it. The obstacle has never really been about economics. It’s been governance and politics.
Wheels Up!
I’m an optimist by nature, and I believe the math wins. When a country needs hundreds of billions in capital, has a proven global model to follow and boasts the deepest capital markets on earth, the pieces tend to fall into place.
Airports are, in effect, toll booths on the long-term growth of global travel. They own irreplaceable assets, enjoy some of the widest moats in the market and throw off utility-like returns. Nearly every other major economy already lets its citizens own a piece of them. I believe it’s time the U.S. gave its investors the same shot.
Airlines and Shipping
Strengths
- The best-performing airline stock for the week was Trip.com, up 4.3%. Airbus reported 237 second quarter 2026 (2Q26) deliveries (25 A220s, 190 A320s, 7 A330s, and 15 A350s), up 39% compared to the second quarter of 2025 (2Q25). RBC is adjusting its 2Q26 and full-year estimates to reflect the strong 2Q26 delivery results.
- In air freight forwarding, volumes continued to accelerate during 2Q26, with global air cargo tonnage up 5%–6% year-over-year (YoY), and June likely increasing even more, in UBS’s view. Strength was supported primarily by Asia-linked flows, semiconductor and AI-related trans-Pacific demand, and capacity disruptions, while e-commerce was less clearly a broad incremental driver.
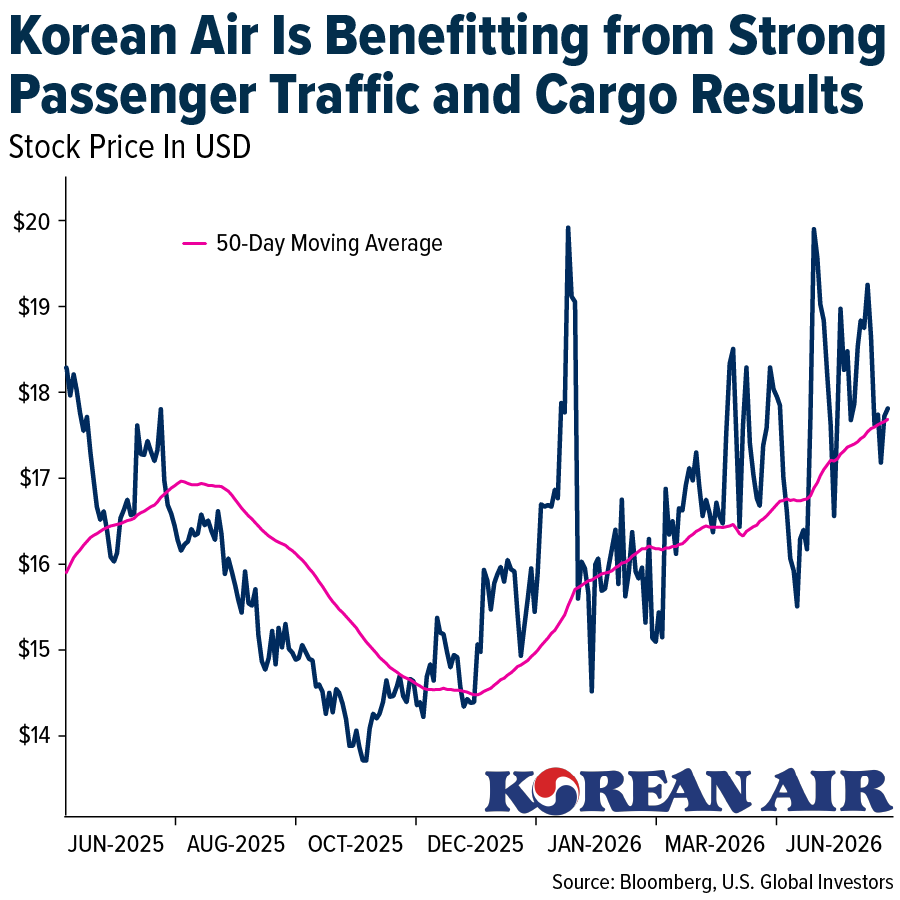
- Korean Air reported strong standalone 2Q26 results, with revenue reaching a record KRW5,020bn, up 26% YoY and ahead of Bank of America’s estimates. Growth was driven by resilient passenger demand (passenger revenue up 19% YoY), despite elevated fuel surcharges, and robust cargo performance (cargo revenue up 46% YoY). Despite a 102% YoY increase in unit fuel costs, operating profit reached KRW262bn (5.2% operating profit margin, OPM), as strong unit revenue growth (21.7% YoY) supported the pass-through of higher fuel costs.
Weaknesses
- The worst-performing airline stock for the week was American Air, down 11.6%. The three largest Chinese airlines guided for wider year-over-year (YoY) net losses in the first half of 2026 (1H26), driven by higher jet fuel costs and softer travel demand. Although Morgan Stanley believes the 2Q26 losses are now behind the industry, consensus 2026 forecasts do not yet appear to fully reflect the softer fundamentals seen year-to-date (YTD).
- June initial global new ship orders rose 16% YoY to 17.7M TEU. While June marked the slowest YoY growth of the year-to-date period, UBS remains positive given the high comparison base and the typical upward revisions to initial orders. June orders were led by tankers (+132% YoY), offsetting flat bulker orders and a decline in containership orders (-47% YoY).
- Grupo Aeroportuario del Pacífico’s earnings before interest, taxes, depreciation, and amortization (EBITDA) came in 3% below consensus, primarily due to lower airport fees despite better cash operating expenses. Earnings per share (EPS) of M$3.95 were well below the consensus estimate of M$5.52, reflecting weaker operating results, higher financial expenses, and a higher tax rate, according to Morgan Stanley.
Opportunities
- According to UBS, the China-to-Europe trade lane is currently viewed as the strongest-performing market. Despite elevated costs, route economics remain attractive, and overall profitability continues to be healthy.
- Suez Canal transits rebounded, rising 19.9% week-over-week (WoW) and 70% year-over-year (YoY), pointing to stronger canal usage. Weekly volumes increased to approximately 260K TEU, the highest level since late 2023, but remain well below pre-Red Sea disruption levels of roughly 1.3–1.4M TEU, according to Morgan Stanley.
- RBC noted that Boeing received an order for 102 737 MAX aircraft from an unidentified customer, which could be announced at the Farnborough Airshow. RBC continues to anticipate stronger order flow for Boeing than at the 2025 Paris Air Show, where the company did not receive any orders.
Threats
- Raymond James highlighted the $6.12 convertible debt conversion price as a near-term ceiling. However, the stock must trade at $7.96 (130% of the conversion price) for 30 consecutive days to trigger conversion, requiring $600M in cash and/or stock, equivalent to 28% of first quarter 2026 (1Q26) cash.
- The Shanghai Containerized Freight Index (SCFI), widely viewed as a leading indicator, declined for the first time in 11 weeks on both major trade routes, falling 4.1% week-over-week (WoW) on North America routes and 2.9% WoW on Europe routes. Morgan Stanley believes the seasonal upswing in spot freight rates has likely peaked. According to the latest U.S. container import forecast from the National Retail Federation, container import volumes are expected to enter a declining trend beginning in August 2026 on both a month-over-month (MoM) and year-over-year (YoY) basis.
- United reported earnings before interest and taxes (EBIT) of $951MM and earnings per share (EPS) of $1.99, exceeding consensus estimates by 3.2% and 5.0%, respectively. However, second half of 2026 (2H26) revenue per available seat mile (RASM) is expected to exceed 12.1% of second quarter 2026 (2Q26), reflecting continued demand strength. Despite this, recent increases in fuel prices have pushed the third quarter 2026 (3Q26) EPS outlook 18% below consensus. BMO estimates third quarter earnings before taxes (EBT) are 4% above expectations excluding fuel. Full-year 2026 (FY2026) EPS guidance is now $9.00–$11.00, or 6.5% below consensus forecasts.
Luxury Goods and International Markets
Strengths
- Chanel continues to stand out as one of the strongest names in luxury, writes Jing Daily, leading social media momentum across both Chinese and Western platforms, according to Bernstein’s Global Luxury Goods: Chinese & Western Social Media Boxing Ring 2Q26 report. The firm’s broad appeal across key markets suggests its brand strength remains resilient, with renewed momentum under Creative Director Matthieu Blazy helping position Chanel ahead of peers such as Gucci and Dior, whose recoveries are expected to take longer.
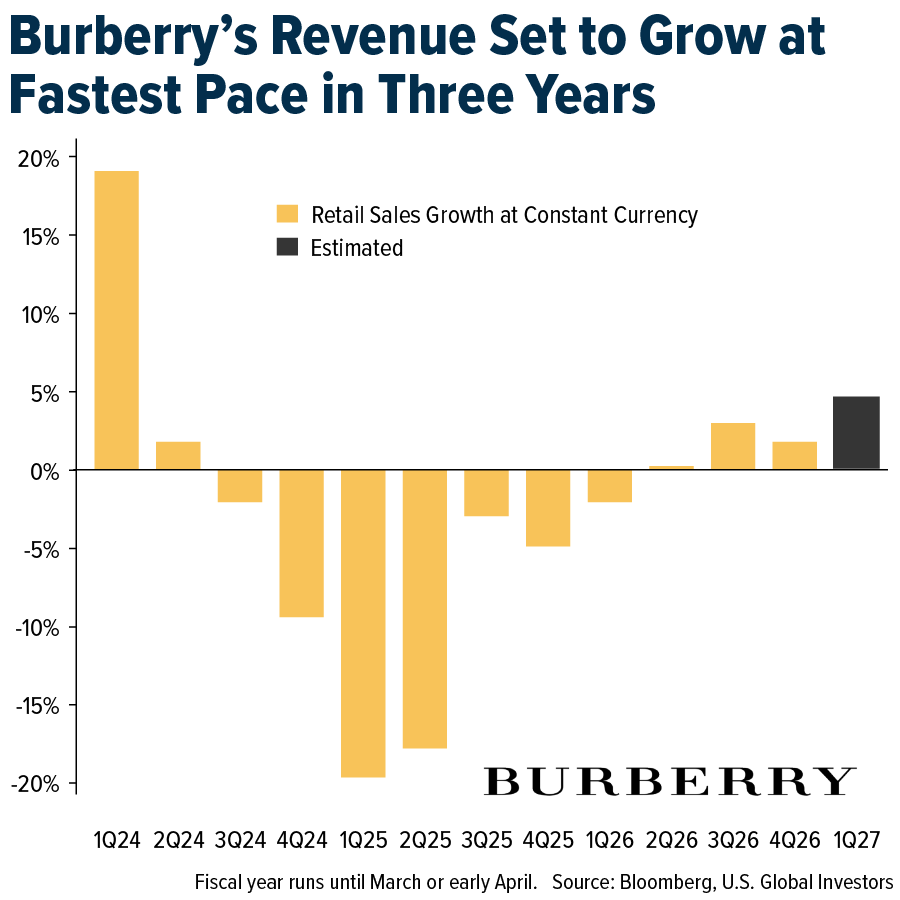
- Burberry and Richemont are expected to deliver one of the strongest starts to the European luxury earnings season, supported by resilient demand in the U.S. and improving momentum in China, according to Bloomberg Intelligence. Burberry’s turnaround strategy, driven by pricing discipline, tighter inventory management and new fashion collaborations, is expected to produce its fastest revenue growth in three years, while Richemont continues to benefit from resilient jewelry demand and lower gold prices. The outlook suggests that well-positioned luxury brands with strong pricing power and global exposure remain better equipped to navigate an uneven consumer environment.
Weaknesses
- The worst-performing airline stock for the week was American Air, down 11.6%. The three largest Chinese airlines guided for wider year-over-year (YoY) net losses in the first half of 2026 (1H26), driven by higher jet fuel costs and softer travel demand. Although Morgan Stanley believes the 2Q26 losses are now behind the industry, consensus 2026 forecasts do not yet appear to fully reflect the softer fundamentals seen year-to-date (YTD).
- June initial global new ship orders rose 16% YoY to 17.7M TEU. While June marked the slowest YoY growth of the year-to-date period, UBS remains positive given the high comparison base and the typical upward revisions to initial orders. June orders were led by tankers (+132% YoY), offsetting flat bulker orders and a decline in containership orders (-47% YoY).
- Grupo Aeroportuario del Pacífico’s earnings before interest, taxes, depreciation, and amortization (EBITDA) came in 3% below consensus, primarily due to lower airport fees despite better cash operating expenses. Earnings per share (EPS) of M$3.95 were well below the consensus estimate of M$5.52, reflecting weaker operating results, higher financial expenses, and a higher tax rate, according to Morgan Stanley.
Opportunities
- According to UBS, the China-to-Europe trade lane is currently viewed as the strongest-performing market. Despite elevated costs, route economics remain attractive, and overall profitability continues to be healthy.
- Suez Canal transits rebounded, rising 19.9% week-over-week (WoW) and 70% year-over-year (YoY), pointing to stronger canal usage. Weekly volumes increased to approximately 260K TEU, the highest level since late 2023, but remain well below pre-Red Sea disruption levels of roughly 1.3–1.4M TEU, according to Morgan Stanley.
- RBC noted that Boeing received an order for 102 737 MAX aircraft from an unidentified customer, which could be announced at the Farnborough Airshow. RBC continues to anticipate stronger order flow for Boeing than at the 2025 Paris Air Show, where the company did not receive any orders.
Threats
- Raymond James highlighted the $6.12 convertible debt conversion price as a near-term ceiling. However, the stock must trade at $7.96 (130% of the conversion price) for 30 consecutive days to trigger conversion, requiring $600M in cash and/or stock, equivalent to 28% of first quarter 2026 (1Q26) cash.
- The Shanghai Containerized Freight Index (SCFI), widely viewed as a leading indicator, declined for the first time in 11 weeks on both major trade routes, falling 4.1% week-over-week (WoW) on North America routes and 2.9% WoW on Europe routes. Morgan Stanley believes the seasonal upswing in spot freight rates has likely peaked. According to the latest U.S. container import forecast from the National Retail Federation, container import volumes are expected to enter a declining trend beginning in August 2026 on both a month-over-month (MoM) and year-over-year (YoY) basis.
- United reported earnings before interest and taxes (EBIT) of $951MM and earnings per share (EPS) of $1.99, exceeding consensus estimates by 3.2% and 5.0%, respectively. However, second half of 2026 (2H26) revenue per available seat mile (RASM) is expected to exceed 12.1% of second quarter 2026 (2Q26), reflecting continued demand strength. Despite this, recent increases in fuel prices have pushed the third quarter 2026 (3Q26) EPS outlook 18% below consensus. BMO estimates third quarter earnings before taxes (EBT) are 4% above expectations excluding fuel. Full-year 2026 (FY2026) EPS guidance is now $9.00–$11.00, or 6.5% below consensus forecasts.
Energy and Natural Resources
Strengths
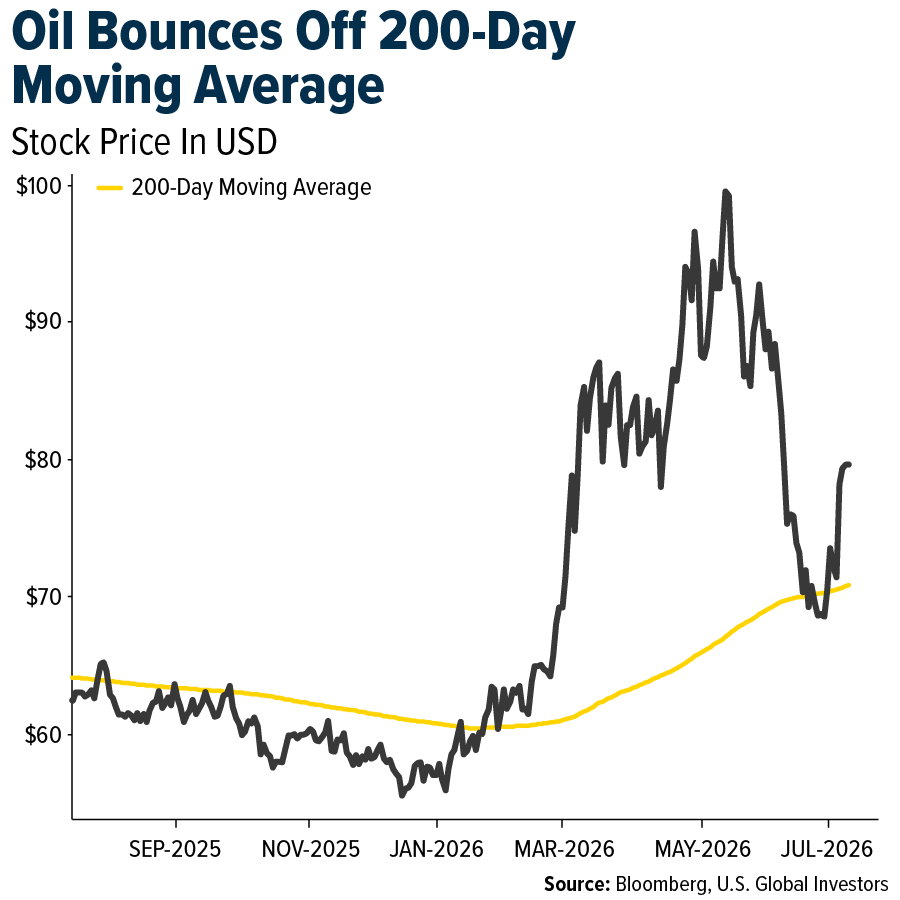
- The best performing commodity for the week was crude oil, up 15.17%. U.S. and Iranian strikes have expanded past purely military targets in a sixth day of fighting, with American attacks on Iranian bridges and power infrastructure met by Iranian fire on bases in Kuwait, Jordan and Bahrain and on Omani territory near the Strait of Hormuz. With no deal on reopening the strait, shipping traffic has fallen sharply, crude flows dropping to roughly 5.5 million barrels a day from about 9.4 million, while Brent climbed toward $86 and analysts warn of a further escalation spiral in the oil price.
- The NRC’s decision to let Westinghouse renew the AP1000 design certification decades early — incorporating Vogtle lessons learned — removes a key regulatory hurdle to fleet-scale deployment of the reactor in the US, directly strengthening the value of Cameco’s 49% ownership stake in Westinghouse. A growing global AP1000 fleet also expands long-term demand for Cameco’s uranium and fuel services, positioning the company to benefit on both the reactor technology and fuel supply sides of the nuclear build-out.
- Global EV sales climbed 7% year-over-year to 2 million units in June 2026, driven largely by a 31% surge in Europe as elevated fuel prices from the U.S.-Israeli conflict with Iran and continued EU subsidies boost demand. However, growth remains uneven, with North American sales down 20% year-to-date amid the loss of U.S. tax credits and China’s domestic market slipping 14%, pushing Chinese automakers to accelerate global expansion.
Weaknesses
- Coffee was the weakest performing commodity of the week, declining approximately 4.17%. Arabica futures fell this week after Cecafé data showed Brazil exported around 2 million bags of arabica in June, up 10% year-on-year, easing fears that rain delays and farmer withholding would keep supply tight ahead of an expected record harvest. Washington’s new 25% tariffs on Brazilian goods spared green and processed coffee, while cocoa dropped as much as 6.8% on weak European grindings and sugar slid on falling Brazilian ethanol prices and improving Indian rainfall.
- BHP’s fourth-quarter copper output fell 5% to 491.9 kt as grades declined at Escondida and Pampa Norte, bringing FY26 production to 1.95 Mt, and the miner guided FY27 copper to just 1,650–1,800 kt on further expected grade erosion in Chile. Sharply higher realized prices — $6.53/lb in Q4, up 47% year-on-year — cushioned the volume decline. BHP touted its growth pipeline for the Escondida concentrator, a possible Cerro Colorado restart, and an Argentina investment decision due this year, to offset ageing Chilean assets, even as a $2.3 billion impairment hit the Jansen potash project.
- Escondida produced 1.261 Mt of copper on a 100% basis, down 3%, as the concentrator feed grade fell from 1.02% to 0.90% — meaning more material must be moved for the same metal, driving up energy use, unit costs and waste-handling pressure. The piece frames this as a structural supply problem rather than a one-off quarterly miss. Lower grades yield a higher unit costs, thus hurting profit margins.
Opportunities
- For 2Q26, analysts are expecting solid results. Exploration &Production should post better FCF on higher oil prices that more than offset gas weakness (with capex guidance likely unchanged and oily exposure still preferred over gas), while refiners benefit from strong global margins driven by US-Iran tensions and Ukrainian strikes on Russian refining capacity that prompted Moscow’s diesel export ban.
- The World Bank projects its metals and minerals price index will rise 17% in 2026 to an all-time high, with copper, aluminum and tin each expected to set record annual highs, while BMO now sees copper averaging a record $6 per pound this year on stagnant mine supply and the widest concentrate deficits in years. With BHP guiding FY27 copper down and Antofagasta’s first-half output falling 9.5%, the structural deficit case is strengthening for producers with near-term growth optionality.
- Lithium rose more than 22% in the first half of 2026, making it the top performer among tracked commodities, as grid-scale battery storage demand and tightening spodumene availability offset weak EV pricing power. With European EV sales up 31% year-over-year in June and Chinese automakers pushing global expansion, the demand base for battery raw materials is broadening beyond a single geography for the first time in the cycle.
Threats
- The US strike on an oil tanker near Iran’s export terminal reignited Strait of Hormuz risk premium and triggered a broad metals selloff, underscoring how quickly geopolitically driven risk-off flows can override tight physical fundamentals. With roughly 20% of global oil and LNG flows transiting the chokepoint, further escalation threatens both energy supply and the industrial demand outlook that base metals depend on.
- A Category 5 atmospheric river bearing down on Chile’s copper heartland threatens near-term disruption to operations already contending with structural grade decline, adding weather risk on top of Escondida’s feed grade drop from 1.02% to 0.90% and Pampa Norte’s 21% output decline. Compounding disruptions at the world’s largest copper district would tighten concentrate markets already running the widest deficits in years.
- Ukrainian strikes on Russian refining capacity that prompted Moscow’s diesel export ban are propping up global refining margins, but the same disruption raises the risk of a distillate squeeze heading into the second half. Refined product markets carry little strategic stockpile buffer, leaving industrial and transport users exposed if Middle East and Russian outages overlap.
Bitcoin and Digital Assets
Strengths
- The Depository Trust & Clearing Corporation (DTCC), which safeguards more than $114 trillion in securities, processed its first live production trades involving tokenized securities. The initiative brought together more than two dozen major financial institutions, including JPMorgan, Goldman Sachs, BlackRock, and Vanguard, demonstrating that blockchain-based assets can integrate with Wall Street’s existing market infrastructure.
- Citadel Securities, one of the world’s largest market makers, invested $400 million in Crypto.com, valuing the exchange at $20 billion in its first institutional funding round. The investment will support expansion into tokenized securities and derivatives, highlighting growing confidence among traditional financial institutions in digital asset infrastructure.
- T. Rowe Price, a global asset manager overseeing nearly $1.9 trillion in assets, launched the industry’s first actively managed multi-token spot crypto exchange-traded fund (ETF). The fund invests across leading digital assets, including bitcoin, ether, BNB, Solana, XRP, and Hyperliquid, reflecting growing institutional demand for actively managed cryptocurrency investment products.
Weaknesses
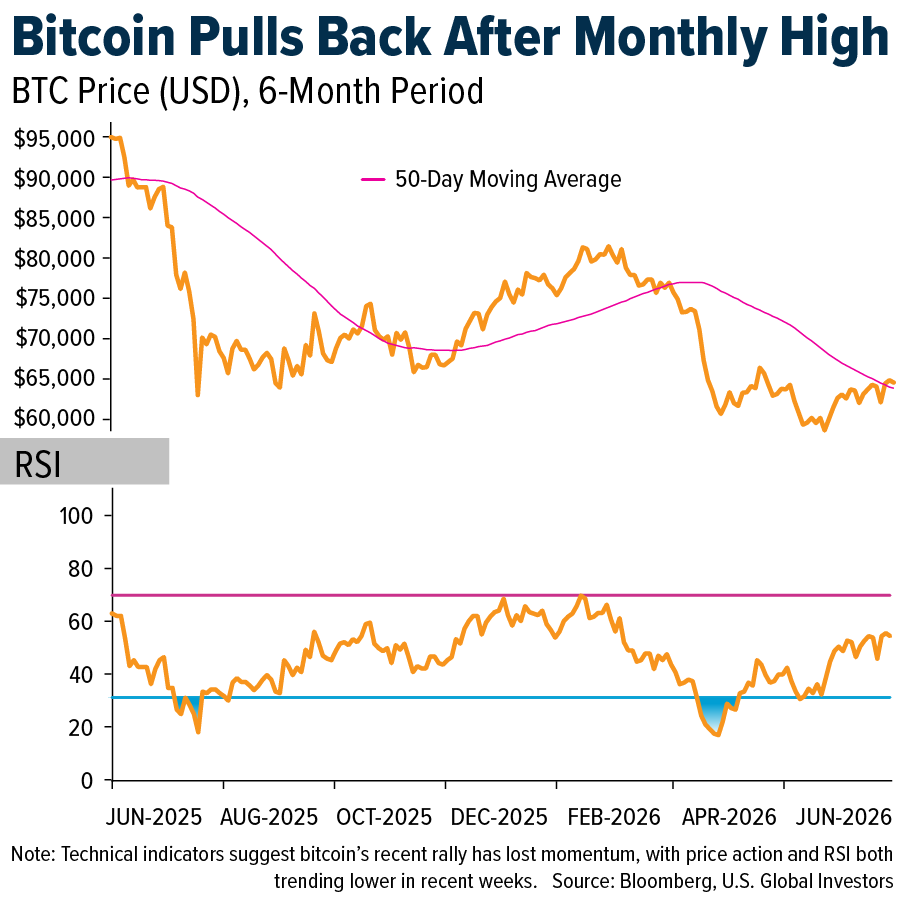
- Bitcoin retreated to around $64,000 after reaching a monthly high of $65,500, as profit-taking and renewed geopolitical tensions in the Middle East triggered broad selling across digital assets. Derivatives data also pointed to growing bearish sentiment, with most major cryptocurrencies showing negative open interest-adjusted volume, while bitcoin’s implied volatility rose to 38%, a level that has historically preceded periods of heightened market turbulence.
- Research by Dune Analytics found that approximately 85% of concentrated liquidity across major decentralized exchanges remains underutilized, with liquidity providers forgoing an estimated $150 million in annual fees. The findings highlight persistent capital efficiency challenges in DeFi despite the sector’s continued growth and innovation.
- Bitcoin’s latest rally toward $65,000 has been met with selling from both long-term and short-term holders, signaling weak investor conviction despite improving macroeconomic conditions. According to Glassnode, short-term holders are realizing profits at more than $4 million per day, while long-term holders are using the rebound to exit losing positions, creating additional selling pressure on the market.
Opportunities
- Galaxy Digital, a digital asset financial services firm, launched Galaxy Curator, a platform that enables institutions to earn yield on idle stablecoin balances through curated decentralized finance (DeFi) lending strategies. Available through Fireblocks, whose custody platform serves more than 2,400 institutional clients, the offering simplifies access to on-chain yield while maintaining institutional-grade risk management, highlighting the growing convergence between traditional finance and decentralized markets.
- The x402 Foundation, a Linux Foundation-backed initiative developing open technology standards, is building a payment protocol that enables artificial intelligence (AI) agents to make autonomous blockchain-based payments over the internet, addressing a key infrastructure gap as AI-driven commerce expands. The initiative is supported by major industry participants, including Coinbase, Visa, Mastercard, American Express, Stripe, Google, Amazon Web Services, Shopify, Circle, and the Solana Foundation, underscoring growing collaboration to build an open financial system for AI.
- Alpaca, a brokerage infrastructure provider for traditional and digital assets, raised $135 million to expand infrastructure supporting tokenized U.S. equities. The company currently clears or custodies approximately 94% of tokenized U.S. stocks and holds more than $1.5 billion in underlying equities, highlighting growing institutional investment in the infrastructure connecting traditional financial markets with blockchain-based trading.
Threats
- The U.S. expanded sanctions against Iran by blacklisting four cryptocurrency wallets linked to the Central Bank of Iran, prompting Tether to freeze $131 million in USDT held at those addresses. The action highlights how geopolitical tensions and sanctions continue to create compliance and operational risks for the digital asset industry, particularly for stablecoin issuers and cross-border transactions.
- Ostium, a decentralized perpetuals exchange, suffered an $18 million exploit after an attacker manipulated its oracle infrastructure to generate fraudulent trading profits and trigger unauthorized payouts. The incident follows a $6 million oracle-related exploit at Summer.fi the previous week, highlighting ongoing security risks for decentralized finance (DeFi) protocols that rely on automated price feeds.
- U.S. spot Bitcoin exchange-traded funds (ETFs) recorded $424.7 million in net outflows, marking the largest single-day withdrawal in July and reversing the previous week’s brief recovery in investor demand. The funds have now seen approximately $5.8 billion in net outflows this year, including a record $4.5 billion withdrawn in June, signaling that institutional demand for Bitcoin remains cautious despite recent market rebounds.
Defense and Cybersecurity
Strengths
- New large contracts announced include Northrop’s Legacy Building in Utah for Sentinel ICBM program, the UK’s £61 million artillery barrel program, and a U.S.-approved $1.96 billion Advanced Precision Kill Weapon Systems sale to Saudi Arabia.
- President Trump announced nearly $10 billion in defense investments in Pennsylvania, highlighting a $2.5 billion agreement between General Dynamics and Rhoads Industries to boost submarine production, creating about 1,500 jobs.
- Telos Corporation secured a significant contract with the U.S. Air Force to enhance its intelligence and surveillance systems, reaffirming the company’s critical role in defense-related cyber governance and compliance solutions.
Weaknesses
- Google delayed the release of Gemini 3.5 Pro AI model due to unmet performance expectations, notably in coding, leading to a more than 4% decline in Alphabet’s share price.
- TransDigm Group facec significant challenges as U.S. antitrust authorities opposed its $960 million acquisition of Stellant Systems due to single-source supply chain risks. This emphasizes ongoing scrutiny over its defense contract pricing and monopolistic practices.
- Microsoft disclosed that the ShinyHunters group abused OAuth relationships and misconfigured accounts in Salesforce environments.
Opportunities
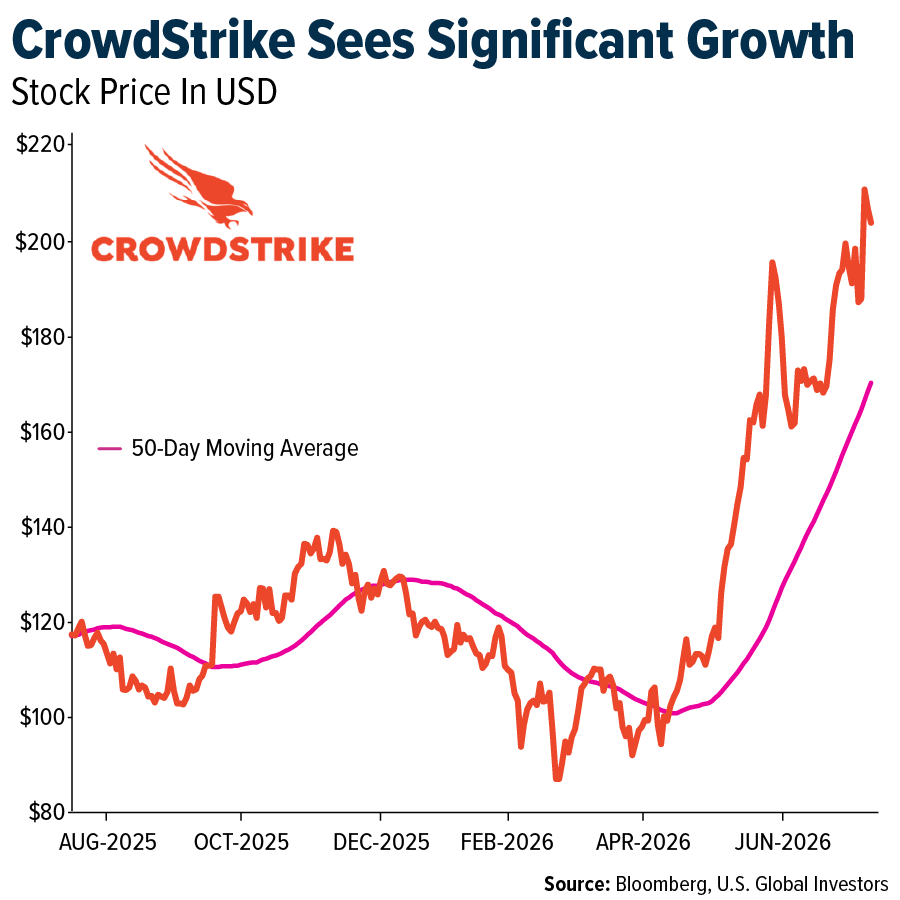
- CrowdStrike and Schwarz Digits have expanded their partnership to bring the AI-native Falcon cybersecurity platform to European organizations through STACKIT’s sovereign cloud infrastructure. In addition, CrowdStrike plans to acquire XM Cyber’s intellectual property to strengthen its exposure management capabilities. The acquisition will provide XM Cyber customers with a migration path to the Falcon platform while supporting growing European demand for sovereign, AI-driven cybersecurity solutions that comply with regulations such as NIS2 and the EU Cyber Resilience Act.
- AI-driven demand is reshaping the memory industry, with global DRAM revenue projected to reach an unprecedented $372 billion in 2026, up 147% year over year, as AI workloads intensify the strain on memory supply. At the same time, the NAND flash market is expected to reach $300 billion, representing a remarkable 311% annual increase driven by growing shortages of enterprise SSDs. Together, these trends highlight how the rapid expansion of AI infrastructure is fueling an extraordinary boom across the memory market.
- European defense companies, including Safran, have announced the Bliksem EXO interceptor system, which is designed to destroy medium-range ballistic missiles in space through direct kinetic impact.
Threats
- SentinelOne published research detailing cyber-espionage campaigns by hacking groups linked to China and India targeting Pakistani law enforcement, including Balochistan police, using advanced tools such as PlugX, ShadowPad and Cobalt Strike.
- U.S. agencies warned that Russian actors are exploiting known Cisco router vulnerabilities, highlighting identity, API, and network layers as critical chokepoints.
- The rapid collapse of the truce has escalated into direct conflict, with Iran launching missile and drone waves against U.S. bases in Kuwait, Bahrain, Jordan, and Qatar over the past week. These retaliatory strikes, alongside a renewed U.S. naval blockade, threaten to trigger severe energy market volatility and a prolonged paralysis of Middle Eastern shipping corridors.
Gold Market
This week gold futures closed the week at $4,017.00, down $96.70 per ounce, or 2.35%. Gold stocks, as measured by the NYSE Arca Gold Miners Index, ended the week lower by 5.91%. The S&P/TSX Venture Index came off 5.64%. The U.S. Trade-Weighted Dollar fell 0.21%.
Strengths
- The best performing precious metal for the week was platinum, however giving back 1.44%. Gold rose on Tuesday and Wednesday after cooler than expected US inflation data eased concerns that the Federal Reserve would need to raise interest rates soon to curb price pressures. Fed Chair Kevin Warsh downplayed the inflation data during his testimony before Congress on Tuesday, saying he did not want to read too much into a single data point, according to Bloomberg.
- Rox Resources’ Youanmi Gold Project in Western Australia is now fully permitted after receiving the Works Approval for the processing plant, tailings storage facility, power station, and associated infrastructure. The approval is the final major environmental approval required for development and marks another significant milestone as the project advances toward first gold production in mid 2027, according to Canaccord.
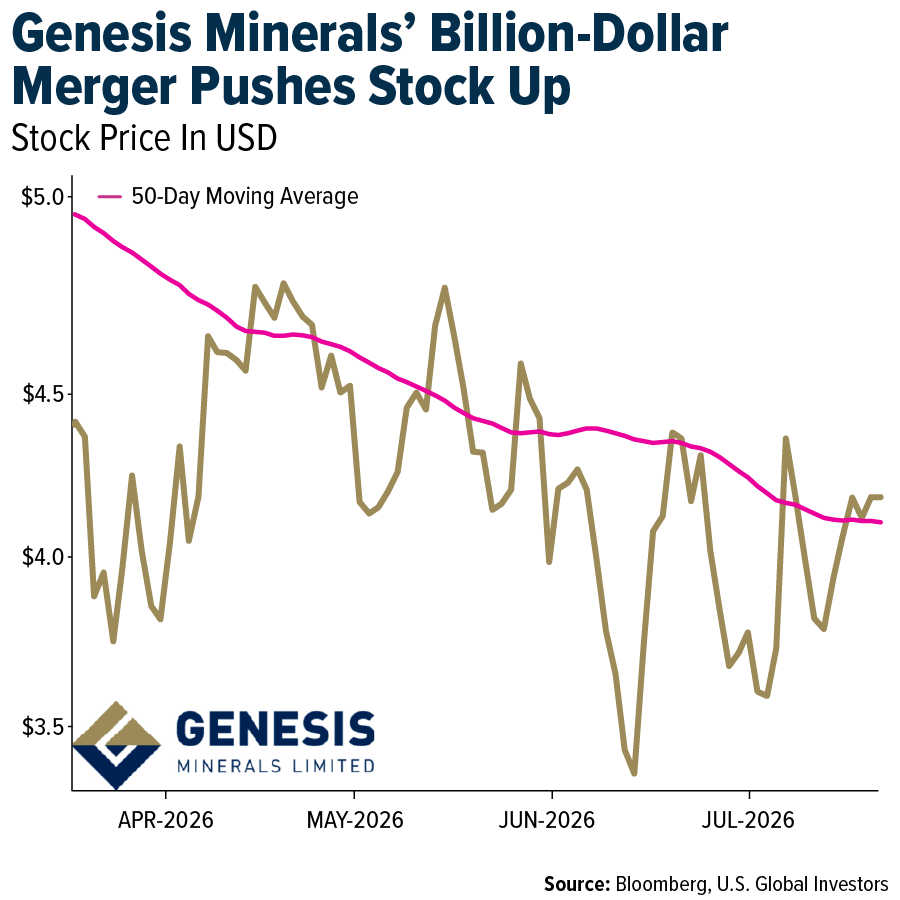
- Genesis Minerals will scrap or defer hundreds of millions of dollars in infrastructure spending, including a $280 million Leonora mill, following its $12.6 billion merger with Vault Minerals. Executive Chairman Raleigh Finlayson said the merger will deliver close to $2 billion in synergies over 10 years and make the group more resilient, despite gold falling 24% since January to US$4,017 an ounce. The deal was effectively secured after rival bidder Regis Resources declined to make a counteroffer. Finlayson is targeting completion by November, with analysts expecting divestments outside the Leonora district. The market has responded positively, with Genesis holding above its 50 day moving average for most of the week before slipping below it on Friday as gold and silver prices weakened.
Weaknesses
- Silver was the worst performing precious metal for the week, down 6.36%. Evolution Mining’s 4QFY26 results missed CLSA’s forecasts, with group gold production of 180,000 ounces, 7% below consensus. Cowal was the main drag, impacted by poor weather and an additional mill shutdown, while Red Lake and Mungari also underperformed.
- Wesdome produced 43,800 ounces in Q2 2026, slightly below the consensus estimate of 46,000 ounces. Eagle River had a weaker quarter due to planned stope sequencing, partially offset by Kiena, which exceeded expectations on both grade and throughput. Management continues to guide to a second half weighted production profile, and a recent analyst site visit led to an upgrade to Outperform from Neutral, supported by strong cash flow generation and ongoing operational improvements.
- Orezone reported 2026 production of 59,000 ounces, below Raymond James’ estimate of 64,000 ounces, due to lower grades at both Bomboré and Casa Berardi. Bomboré in Burkina Faso produced 76,000 ounces in the first half of 2026, while Casa Berardi produced 21,000 ounces during its second quarter ramp up. The company maintained 2026 production guidance of 160,000 to 180,000 ounces at an AISC of US$2,100 to US$2,300 per ounce.
Opportunities
- Gold equities remain inexpensive relative to bullion, with companies now holding strong net cash positions, generating robust free cash flow, and likely to increase capital returns, according to Scotiabank. Bank of America also noted that free cash flow for mid tier and major gold producers has increased tenfold since 2020 and expects this trend to continue through 2027, supported by its gold price forecast. Fidelity International said this week it plans to rebuild the gold positions it reduced earlier this year, citing confidence in bullion’s long term fundamentals.
- Predictive Discovery said it will invest approximately US$10 million in West Africa focused explorer Awalé Resources for an undiluted stake of about 12%, before the potential exercise of participation rights held by certain existing Awalé shareholders. Predictive, which is based in Perth and has gold assets in West Africa, announced the investment, according to Alliance News.
- Gold Fields sold off sharply after reports that the Ghanaian government could transfer control of the Tarkwa mine to a local company when the lease expires in April 2027. The stock has underperformed its peers by about 10% year to date. Based on this underperformance and Gold Fields’ lower valuation, JPMorgan estimates the market is assigning little to no value to the company’s Ghana operations, which it values at approximately US$5 billion.
Threats
- Ghana continues to depart from its long-standing reputation as a safe and stable mining jurisdiction. The latest proposed mining legislation would limit mining lease renewals to a maximum of 10 years and reduce existing 30-year leases to 20 years. Unless companies can fully mine and develop an ore body within 10 years, the changes are likely to discourage new capital investment.
- Scotiabank expects gold mining costs to increase 6% to 9% quarter over quarter, driven largely by higher fuel prices, with margins expected to decline quarter over quarter but remain higher year over year. All in sustaining costs are forecast to rise 9% quarter over quarter, with fuel accounting for 21% of 2026 cost structures. According to Scotiabank, every US$10 per barrel increase in oil prices adds approximately US$20 per ounce to costs.
- According to Morgan Stanley, the PGM sector has underperformed the gold sector since the Iran conflict. The bank attributes this to greater operating leverage, as PGM sector margins have been lower than the elevated margins in the gold sector, a weaker industrial demand outlook for PGMs, and broader macroeconomic headwinds.
A message from Advisor Perspectives and VettaFi: Discover something new! Click here to register for our upcoming webcasts.
This commentary should not be considered a solicitation or offering of any investment product. Certain materials in this commentary may contain dated information. The information provided was current at the time of publication. Some links above may be directed to third-party websites. U.S. Global Investors does not endorse all information supplied by these websites and is not responsible for their content. All opinions expressed and data provided are subject to change without notice. Some of these opinions may not be appropriate to every investor.
Holdings may change daily. Holdings are reported as of the most recent quarter-end. The following securities mentioned in the article were held by one or more accounts managed by U.S. Global Investors as of (06/30/2026):
Airbus SE
Boeing Co/The
United Airlines
Burberry Group PLC
Cie Financière Richemont SA
Aena SME SA
Aeroports de Paris SA
Airports of Thailand PCL
Grupo Aeroportuario del Pacifico
Grupo Aeroportuario del Sureste
General Dynamics Corp.
CrowdStrike Holdings Co.
Genesis Minerals
Evolution Mining
Awale Resources
Gold Fields
Genesis Minerals
Evolution Mining Ltd.
Gold Fields Ltd.
Awale Resources
*The above-mentioned indices are not total returns. These returns reflect simple appreciation only and do not reflect dividend reinvestment.
The Dow Jones Industrial Average is a price-weighted average of 30 blue chip stocks that are generally leaders in their industry. The S&P 500 Stock Index is a widely recognized capitalization-weighted index of 500 common stock prices in U.S. companies. The Nasdaq Composite Index is a capitalization-weighted index of all Nasdaq National Market and SmallCap stocks. The Russell 2000 Index® is a U.S. equity index measuring the performance of the 2,000 smallest companies in the Russell 3000®, a widely recognized small-cap index.
The Hang Seng Composite Index is a market capitalization-weighted index that comprises the top 200 companies listed on Stock Exchange of Hong Kong, based on average market cap for the 12 months. The Taiwan Stock Exchange Index is a capitalization-weighted index of all listed common shares traded on the Taiwan Stock Exchange. The Korea Stock Price Index is a capitalization-weighted index of all common shares and preferred shares on the Korean Stock Exchanges.The Philadelphia Stock Exchange Gold and Silver Index (XAU) is a capitalization-weighted index that includes the leading companies involved in the mining of gold and silver. The U.S. Trade Weighted Dollar Index provides a general indication of the international value of the U.S. dollar. The S&P/TSX Canadian Gold Capped Sector Index is a modified capitalization-weighted index, whose equity weights are capped 25 percent and index constituents are derived from a subset stock pool of S&P/TSX Composite Index stocks. The NYSE Arca Gold Miners Index is a modified market capitalization weighted index comprised of publicly traded companies involved primarily in the mining for gold and silver. The S&P/TSX Venture Composite Index is a broad market indicator for the Canadian venture capital market. The index is market capitalization weighted and, at its inception, included 531 companies. A quarterly revision process is used to remove companies that comprise less than 0.05% of the weight of the index, and add companies whose weight, when included, will be greater than 0.05% of the index.
The S&P 500 Energy Index is a capitalization-weighted index that tracks the companies in the energy sector as a subset of the S&P 500. The S&P 500 Materials Index is a capitalization-weighted index that tracks the companies in the material sector as a subset of the S&P 500. The S&P 500 Financials Index is a capitalization-weighted index. The index was developed with a base level of 10 for the 1941-43 base period. The S&P 500 Industrials Index is a Materials Index is a capitalization-weighted index that tracks the companies in the industrial sector as a subset of the S&P 500. The S&P 500 Consumer Discretionary Index is a capitalization-weighted index that tracks the companies in the consumer discretionary sector as a subset of the S&P 500. The S&P 500 Information Technology Index is a capitalization-weighted index that tracks the companies in the information technology sector as a subset of the S&P 500. The S&P 500 Consumer Staples Index is a Materials Index is a capitalization-weighted index that tracks the companies in the consumer staples sector as a subset of the S&P 500. The S&P 500 Utilities Index is a capitalization-weighted index that tracks the companies in the utilities sector as a subset of the S&P 500. The S&P 500 Healthcare Index is a capitalization-weighted index that tracks the companies in the healthcare sector as a subset of the S&P 500. The S&P 500 Telecom Index is a Materials Index is a capitalization-weighted index that tracks the companies in the telecom sector as a subset of the S&P 500.
The Consumer Price Index (CPI) is one of the most widely recognized price measures for tracking the price of a market basket of goods and services purchased by individuals. The weights of components are based on consumer spending patterns. The Purchasing Manager’s Index is an indicator of the economic health of the manufacturing sector. The PMI index is based on five major indicators: new orders, inventory levels, production, supplier deliveries and the employment environment. Gross domestic product (GDP) is the monetary value of all the finished goods and services produced within a country’s borders in a specific time period, though GDP is usually calculated on an annual basis. It includes all private and public consumption, government outlays, investments and exports less imports that occur within a defined territory.
The S&P Global Luxury Index is comprised of 80 of the largest publicly traded companies engaged in the production or distribution of luxury goods or the provision of luxury services that meet specific investibility requirements.
The Shanghai Containerized Freight Index (SCFI) is a benchmark index that tracks spot freight rates for shipping containers from Shanghai to major ports around the world, serving as a key indicator of global container shipping market conditions.
The Dow Jones Brookfield Airports Infrastructure Index is a global benchmark that tracks the stock performance of “pure-play” infrastructure companies focused specifically on the development, ownership, and management of airports and related facilities.
The Dow Jones U.S. Utilities Index is a stock market benchmark designed to measure the performance of United States companies within the utilities industry, including electricity, gas, and water providers.
The Dow Jones U.S. Airlines Index is a benchmark stock market index designed to measure the performance of the airline sector within the broader United States equities market.
Please consider carefully a fund’s investment objectives, risks, charges and expenses. For this and other important information, obtain a fund prospectus by visiting our prospectus page or by calling 1-800-US-FUNDS (1-800-873-8637). Read it carefully before investing. Foreside Fund Services, LLC, Distributor. U.S. Global Investors is the investment adviser.
Read additional important information. +
Membership required
Membership is now required to use this feature. To learn more:
View Membership Benefits