This month’s Muni Monthly covers performance, supply and demand technicals, fundamentals and valuations for the month ending July 2026.
Performance Overview: Munis posted the weakest July returns in over two decades.
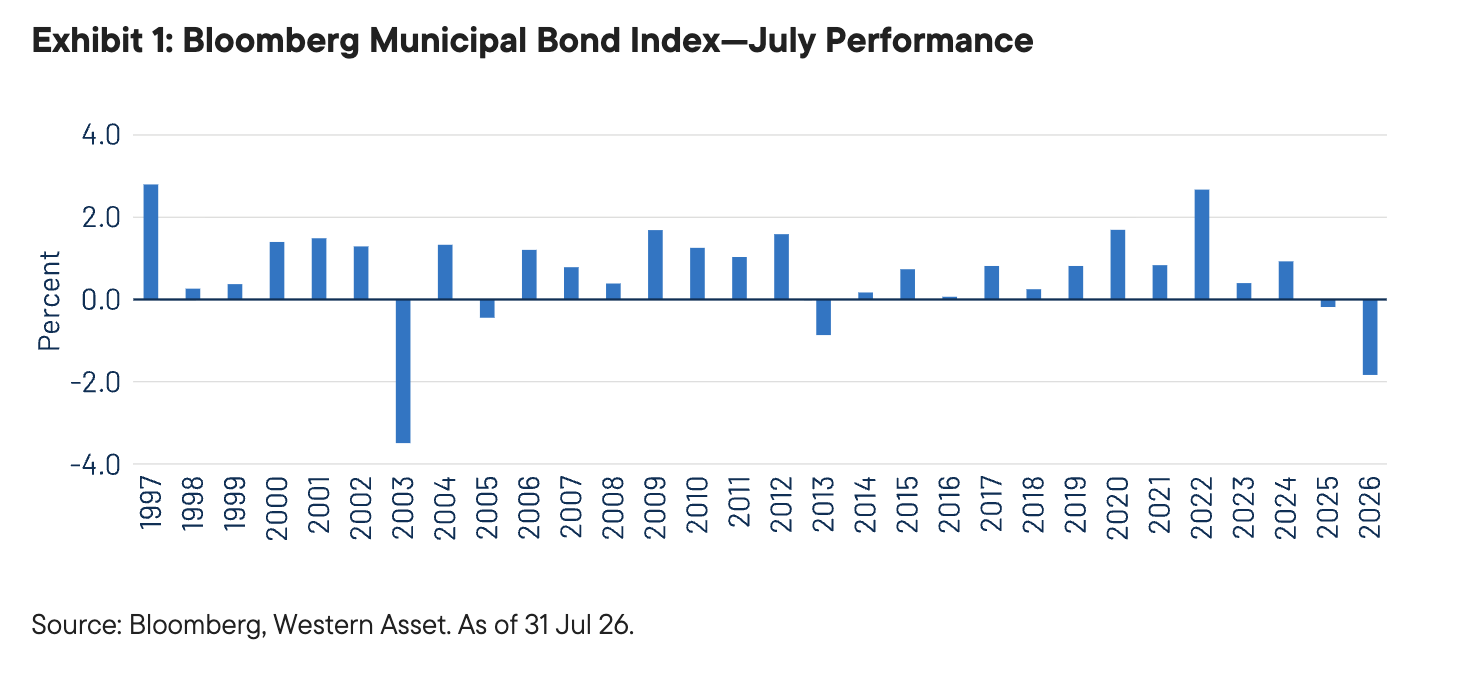
Municipals posted their weakest July return in more than two decades. The Bloomberg Municipal Bond Index returned -1.85%, underperforming most investment-grade fixed-income sectors and marking just the fifth negative July return over the past 30 years. July is typically supported by lighter issuance and strong reinvestment demand. Longer-duration bonds lagged amid persistent inflation uncertainty and elevated supply, while higher-quality cohorts also underperformed as continued credit-spread tightening favored lower-rated segments. Despite the July decline, the Bloomberg U.S. Municipal Bond Index return remained positive at 0.43% year to date (YTD), compared with returns of -0.69% for the U.S. Aggregate index, -0.84% for the Treasury index and -0.83% for the Corporate index.
Technicals: Municipal demand is down from June but still above the 10-year July average.
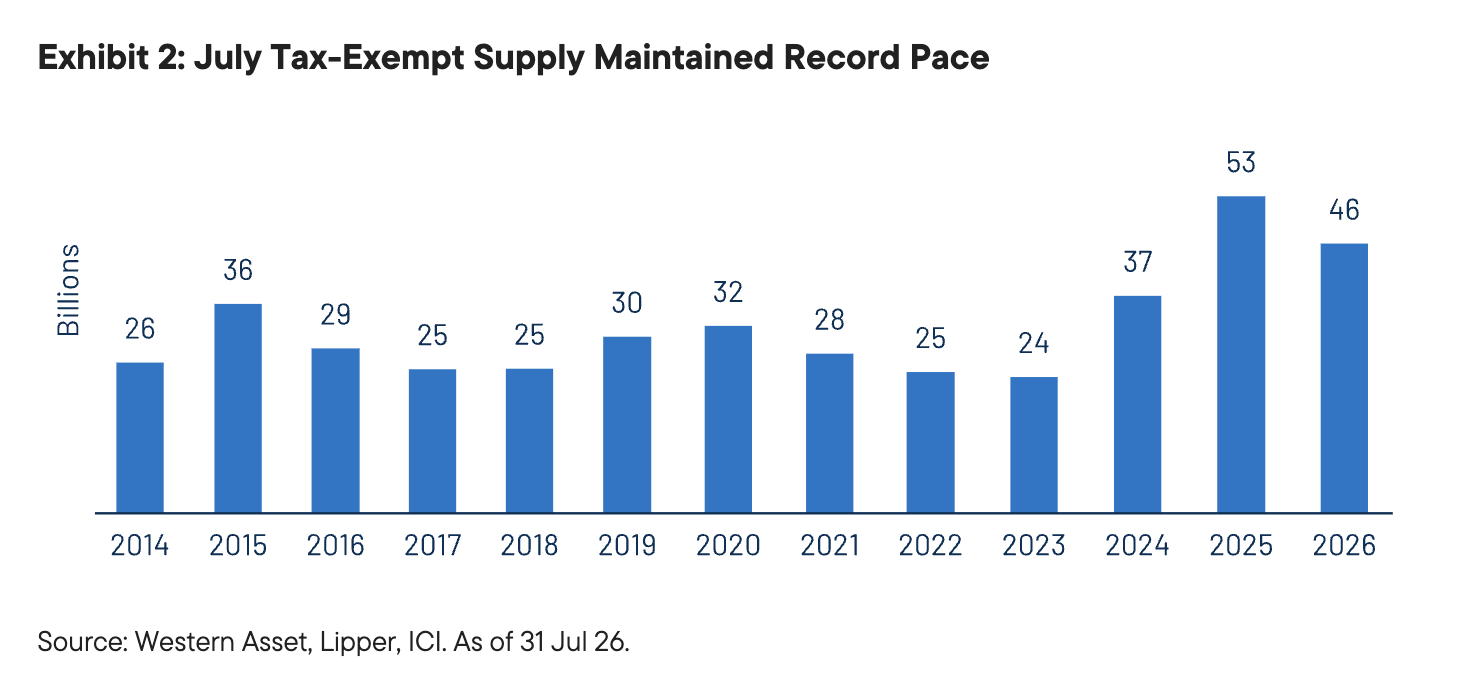
Elevated issuance and a rising forward calendar outweighed otherwise steady fund demand. July municipal issuance totaled approximately $47 billion, down 25% from June but still 28% above the 10-year July average. The Bloomberg 30-day forward supply calendar increased from $12.5 billion at the beginning of the month to $24 billion by month-end, underscoring the persistent pace of record issuance in 2026. Meanwhile, combined Lipper and ICI estimates indicate that municipal funds recorded more than $9 billion of net inflows during July, roughly in line with June.
See more: Higher Rates Create New Opportunities in Muni Bonds
Fundamentals: Rating agency downgrades outpace upgrades amid moderate growth and cost pressures.
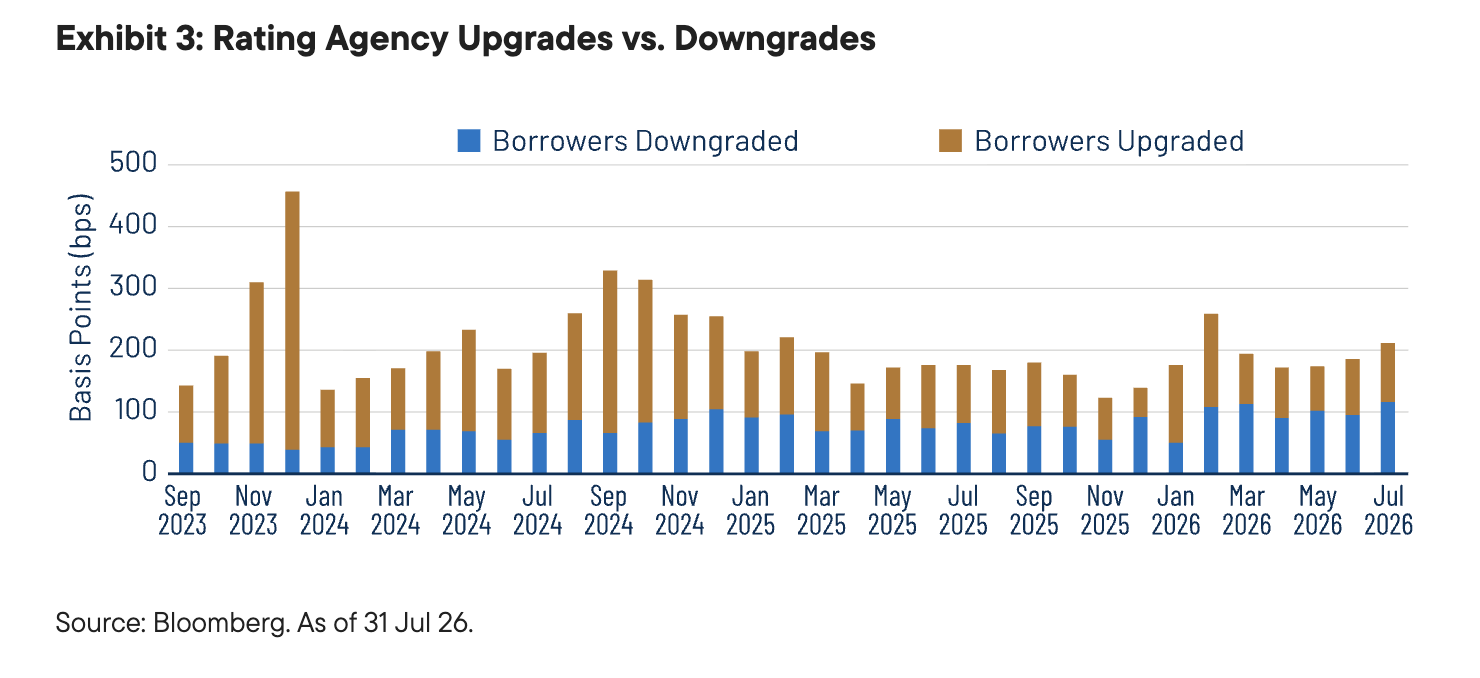
As July represents the start of a new fiscal year for most municipalities, strong tax collections have supported timely budget filings. However, rating actions have begun to reflect moderate growth expectations and persistent cost pressures. Downgrades from Moody’s, S&P and Fitch outpaced upgrades by borrower count, continuing a trend observed since March. Total YTD defaults remain below prior-year levels, however, and remain isolated to select high-yield sectors. Notably, four of the five first-time payment defaults recorded in July occurred within the charter school sector.
Valuations: After-tax yield advantages support attractive municipal entry points.
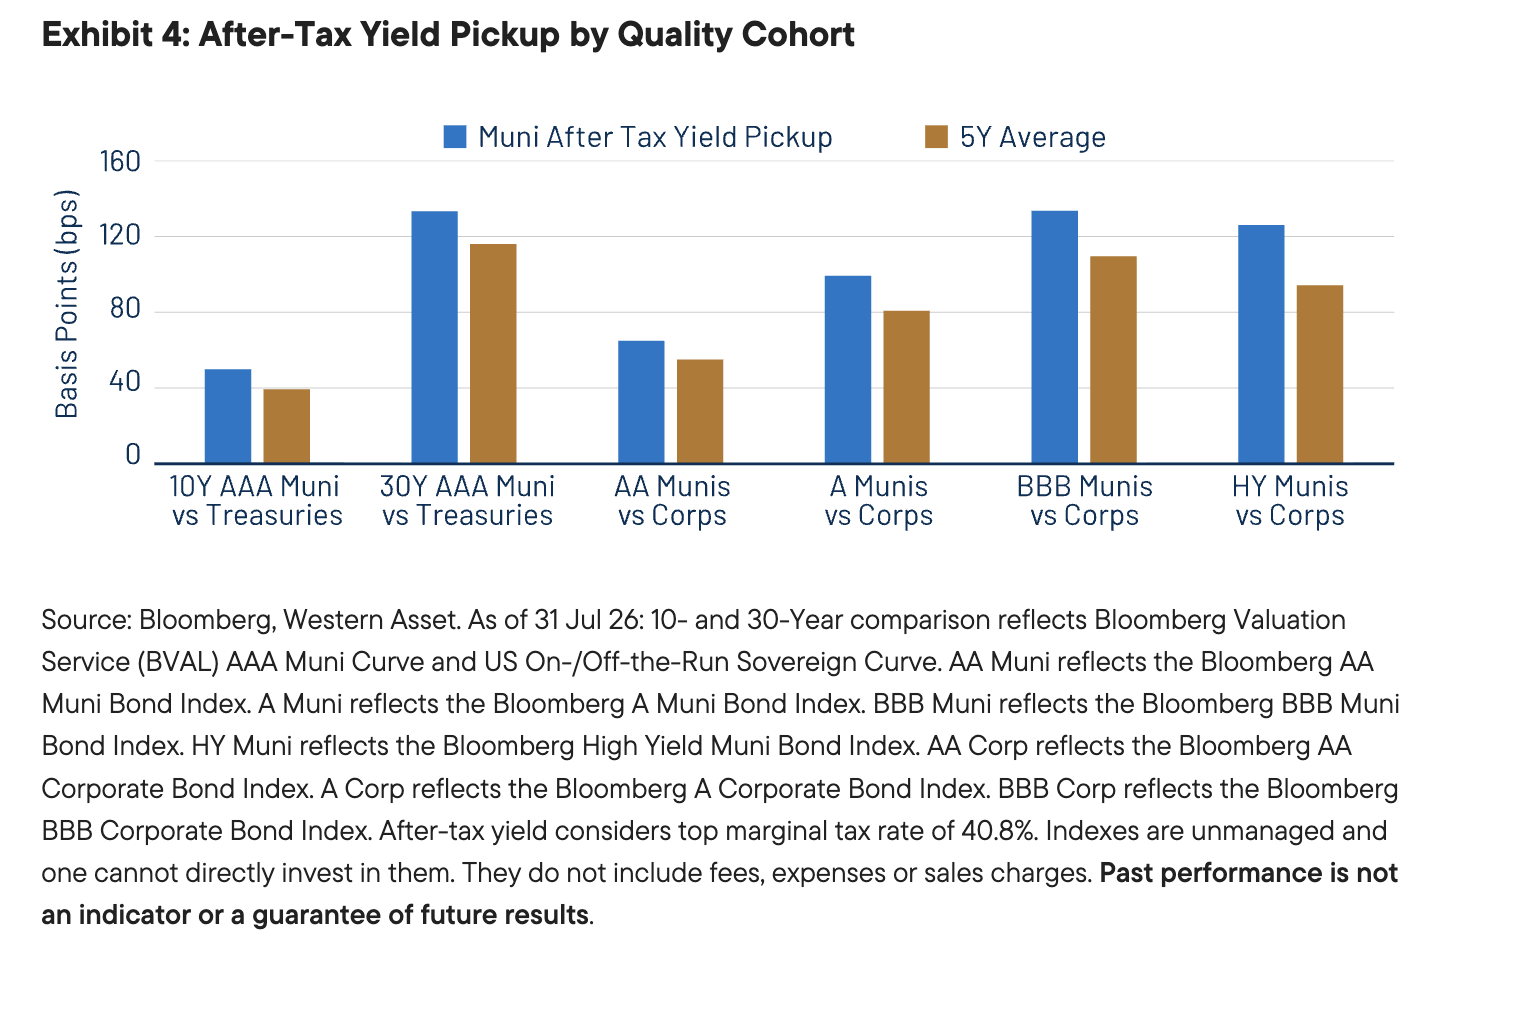
The July selloff lifted municipal tax-exempt income levels and improved relative valuations. The Bloomberg Municipal Bond Index yield-to-worst rose to a year-to-date high of 3.93%, equivalent to 6.64% on a taxable-equivalent basis for investors subject to the highest marginal tax rate. That compares favorably with yields of 4.57% for the Bloomberg U.S. Treasury Index and 5.46% for the Bloomberg Corporate Index. After-tax yield advantages across maturities and credit-quality cohorts remain above their five-year averages, supporting more attractive entry points for the municipal asset class, in our view, amid continued economic uncertainty.
Definitions:
“AAA” and “AA” (high credit quality) and “A” and “BBB” (medium credit quality) are considered investment grade. Credit ratings for bonds below these designations (“BB,” “B,” “CCC,” etc.) are considered low credit quality, and are commonly referred to as “junk bonds.”
One basis point (bps) is one one-hundredth of one percentage point (1/100% or 0.01%).
The Bloomberg Municipal “Muni” Bond Index covers the USD denominated long-term tax-exempt bond market. The index has four main sectors: state and local general obligation bonds, revenue bonds, insured bonds, and prerefunded bonds.
The Bloomberg Municipal High Yield Bond Index is an unmanaged index made up of bonds that are non-investment grade, unrated, or rated below Ba1 by Moody’s Investors Service with a remaining maturity of at least one year.
The Bloomberg Taxable Municipal Bond Index is a rules-based, market-value-weighted index engineered for the long-term taxable bond market. To be included in the index, bonds must be rated investment-grade (Baa3/BBB- or higher) by at least two of the following ratings agencies if all three rate the bond: Moody’s, S&P, Fitch. If only two of the three agencies rate the security, the lower rating is used to determine index eligibility. If only one of the three agencies rates a security, the rating must be investment-grade.
The Bloomberg US Corporate Bond Index measures the performance of the investment-grade, fixed-rate, taxable corporate bond market. It includes U.S. dollar-denominated securities publicly issued by US and non-US industrial, utility and financial issuers.
The Bloomberg US Treasury Index measures the performance of US dollar-denominated, fixed-rate, nominal debt issued by the US Treasury with at least one year until final maturity. Treasuries, if held to maturity, offer a fixed rate of return and a fixed principal value; their interest payments and principal are guaranteed.
The Bloomberg Valuation Service (BVAL) provides prices on a daily basis for over 2.5 million securities across all asset classes.
The Bloomberg AAA BVAL Callable Municipal Credit Curve is represented by the US General Obligation AAA Muni BVAL Yield Curve. The BVAL curve is populated with pricing from uninsured AAA General Obligation bonds. The curve is populated with high quality US municipal bonds with an average rating of AAA from Moody’s and S&P. The yield curve is built using non-parametric fit of market data obtained from the Municipal Securities Rulemaking Board, new issues, and other proprietary contributed prices. The curve represents 5% couponing. The 3-month to 10-year points are bullet yields, and the 11-year to 30-year points are yields to worst for a 10-year call.
The yield curve shows the relationship between yields and maturity dates for a similar class of bonds.
Inverted yield curve refers to a market condition when yields for longer-maturity bonds have yields which are lower than shorter-maturity issues.
Yield to worst (YTW) is the lowest potential yield that can be received on a bond without the issuer actually defaulting.
WHAT ARE THE RISKS?
All investments involve risks, including possible loss of principal. Past performance is no guarantee of future results. Please note that an investor cannot invest directly in an index. Unmanaged index returns do not reflect any fees, expenses or sales charges.
Equity securities are subject to price fluctuation and possible loss of principal.
Fixed-income securities involve interest rate, credit, inflation and reinvestment risks; and possible loss of principal. As interest rates rise, the value of fixed income securities falls. Low-rated, high-yield bonds are subject to greater price volatility, illiquidity and possibility of default.
Municipal income may be subject to state and local taxes. Some income may be subject to the federal alternative minimum tax for certain investors. Capital gains, if any, are taxable.
Changes in the credit rating of a bond, or in the credit rating or financial strength of a bond’s issuer, insurer or guarantor, may affect the bond’s value.
U.S. Treasuries are direct debt obligations issued and backed by the “full faith and credit” of the US government. The US government guarantees the principal and interest payments on US Treasuries when the securities are held to maturity. Unlike US Treasuries, debt securities issued by the federal agencies and instrumentalities and related investments may or may not be backed by the full faith and credit of the US government. Even when the US government guarantees principal and interest payments on securities, this guarantee does not apply to losses resulting from declines in the market value of these securities.
WF: 12012058
IMPORTANT LEGAL INFORMATION
This material is intended to be of general interest only and should not be construed as individual investment advice or a recommendation or solicitation to buy, sell or hold any security or to adopt any investment strategy. It does not constitute legal or tax advice. This material may not be reproduced, distributed or published without prior written permission from Franklin Templeton.
The views expressed are those of the investment manager and the comments, opinions and analyses are rendered as at publication date and may change without notice. The underlying assumptions and these views are subject to change based on market and other conditions and may differ from other portfolio managers or of the firm as a whole. The information provided in this material is not intended as a complete analysis of every material fact regarding any country, region or market. There is no assurance that any prediction, projection or forecast on the economy, stock market, bond market or the economic trends of the markets will be realized. The value of investments and the income from them can go down as well as up and you may not get back the full amount that you invested. Past performance is not necessarily indicative nor a guarantee of future performance. All investments involve risks, including possible loss of principal.
Any research and analysis contained in this material has been procured by Franklin Templeton for its own purposes and may be acted upon in that connection and, as such, is provided to you incidentally. Data from third party sources may have been used in the preparation of this material and Franklin Templeton ("FT") has not independently verified, validated or audited such data. Although information has been obtained from sources that Franklin Templeton believes to be reliable, no guarantee can be given as to its accuracy and such information may be incomplete or condensed and may be subject to change at any time without notice. The mention of any individual securities should neither constitute nor be construed as a recommendation to purchase, hold or sell any securities, and the information provided regarding such individual securities (if any) is not a sufficient basis upon which to make an investment decision. FT accepts no liability whatsoever for any loss arising from use of this information and reliance upon the comments, opinions and analyses in the material is at the sole discretion of the user.
Franklin Templeton has environmental, social and governance (ESG) capabilities; however, not all strategies or products for a strategy consider “ESG” as part of their investment process.
Products, services and information may not be available in all jurisdictions and are offered outside the U.S. by other FT affiliates and/or their distributors as local laws and regulation permits. Please consult your own financial professional or Franklin Templeton institutional contact for further information on availability of products and services in your jurisdiction.
Issued in the U.S. by Franklin Templeton, One Franklin Parkway, San Mateo, California 94403-1906, (800) DIAL BEN/342-5236, franklintempleton.com. Investments are not FDIC insured; may lose value; and are not bank guaranteed.
You need Adobe Acrobat Reader to view and print PDF documents. Download a free version from Adobe's website.
CFA® and Chartered Financial Analyst® are trademarks owned by CFA Institute.
A message from Advisor Perspectives and VettaFi: Discover something new! Click here to register for our upcoming webcasts.
More Tax Loss Harvesting Topics >