Hedged Equity as a Liquid Alternative
Membership required
Membership is now required to use this feature. To learn more:
View Membership Benefits

What Will Be Covered

- Why Liquid Alternatives Keep Disappointing — and What to Do About It
- What Investors Actually Want from a Liquid Alternative
- How Hedged Equity Solves the Upside/Downside Trade-Off
- Mapping the Liquid Alternatives Universe
- The Portfolio Impact of Liquid Alts and Hedged Equity
- The Liquid Alternatives Lifecycle: Why 2,100 Funds Have Gone Extinct
- Why Allocators Are Replacing Liquid Alt Exposure with Hedged Equity
- Key Takeaways
Hedged equity as a liquid alternative uses an options-based equity strategy — specifically Swan Global Investments’ Defined Risk Strategy (DRS), in continuous operation since 1997 — as a permanent alternatives allocation that stays invested in the equity market while actively managing downside risk through LEAPS put options. Unlike most liquid alternative funds, which have a median inception date of August 2022 and are often adopted during crises and abandoned in recoveries, the DRS is designed as an “Always Invested, Always Hedged” through-cycle allocation launched in July 1997. In historical analysis from July 1997 through December 2025, a 20% DRS sleeve in a traditional 60/40 portfolio produced higher returns, lower volatility, and a better Sharpe ratio than the same allocation to the Morningstar Multistrategy liquid alt category average. Past performance does not guarantee future results.
See more: The Liquid Alternatives Revival
“Most liquid alternatives are a ‘sometimes’ asset class — adopted in crises, abandoned in recoveries. Swan’s Defined Risk Strategy is built to be held through the full cycle: Always Invested, Always Hedged, since 1997.”
-- Swan Global Investments
The liquid alternative role explored in this article is one of the core applications of institutional hedged equity — defined by combining uncapped equity participation with actively managed downside risk, designed to function as a permanent portfolio allocation rather than a crisis hedge.
Why Liquid Alternatives Keep Disappointing — and What to Do About It
Most liquid alternative funds fail a simple test: they cannot be held through a full market cycle — adopted in crises, abandoned on recoveries, and gone before the next bear market arrives.
The liquid alternatives category has a lifecycle problem. Advisors and allocators adopt alternative strategies after a crisis, then abandon them when markets recover. The result: approximately 2,100 liquid alternative funds have gone extinct over the past 20 years, even as 1,536 remain active today.
The question for any serious allocator is not which alternative fund to own—it’s whether hedged equity, used as a permanent allocation, solves the problem that makes traditional liquid alternatives so difficult to buy and hold.
This article, the third in a four-part series, examines how hedged equity functions as a structurally distinct liquid alternative sleeve: maintaining meaningful equity participation in bull markets while actively managing drawdown risk in bear markets. By design, it is built to be held through the full cycle, not just the crisis.
What Investors Actually Want from a Liquid Alternative Strategy (And Why It’s Hard to Find)
Investors want all three simultaneously — full upside participation, meaningful downside protection, and low fees — and no single liquid alternative strategy reliably delivers all three.
Part of the problem is that investors often have unrealistic expectations for their liquid alternative investments. It seems like some investors want their alternative portfolio allocations to have the following features:
- All of the upside of traditional, long investments
- Significantly less downside than traditional investments
- Fees matching passively managed index funds
While these features are desirable, it seems unlikely that any single fund or investment strategy will feature all three of these characteristics simultaneously. The old saying “There is no free lunch” holds true in alternative strategies.
That said, many liquid alternative strategies seek to maximize the tradeoff between upside capture and downside risk minimization. Given those criteria, Swan’s Defined Risk Strategy (“DRS”) is one of those strategies.
How Hedged Equity Solves the Upside/Downside Trade-Off
Hedged equity solves the trade-off by keeping the portfolio fully invested in the equity market while using actively managed put options to flatten losses in bear markets — without capping gains in bull markets.
The Defined Risk Strategy (DRS) is designed to mitigate losses when the market is down significantly, while still providing meaningful up-market participation. The driving idea behind the DRS is that large bear markets are too painful to endure, so the DRS is engineered to have a different risk-return profile than a traditional long position.
The Defined Risk Strategy is a hedged equity solution that utilizes long-term put options to manage the upside/downside trade-off. Moreover, these put options are actively managed according to our time-tested process. Rather than being held to expiration, the DRS’s put options are sold when they still have value. The put options are sold well before expiration and new put options are purchased at current market levels as part of the actively managed “re-hedge” process. The re-hedges typically occur 1) near the end of the calendar year, halfway through the put options’ lifecycle, 2) following a deep market sell-off when the options are “in-the-money” and profitable, or 3) following a market run-up to ratchet up the levels of the hedge.
The strategy has been active since 1997 and has successfully weathered the largest bear markets this century: the Dot-Com Bust and the Global Financial Crisis, as well as other periods of major market stress like the 2010 Flash Crash, the Covid-19 selloff of 2020, the inflation bear market in 2022, the 2025 Tariff Tantrum and more.
One of the key charts that convey this message is the one below, referred to as the “Target Return Band”. We believe that our Target Return Band is a very appropriate prism through which our performance can be viewed. The three main elements of the Defined Risk Strategy are charted in this band:
- A long, buy-and-hold position in ETFs, typically representing 85%-90% of the portfolio (dark grey line)
- Long-dated put options (LEAPS) used to hedge market risk (gold line)
- Short-term, market-neutral premium collection trades to generate cash flow (light blue range)
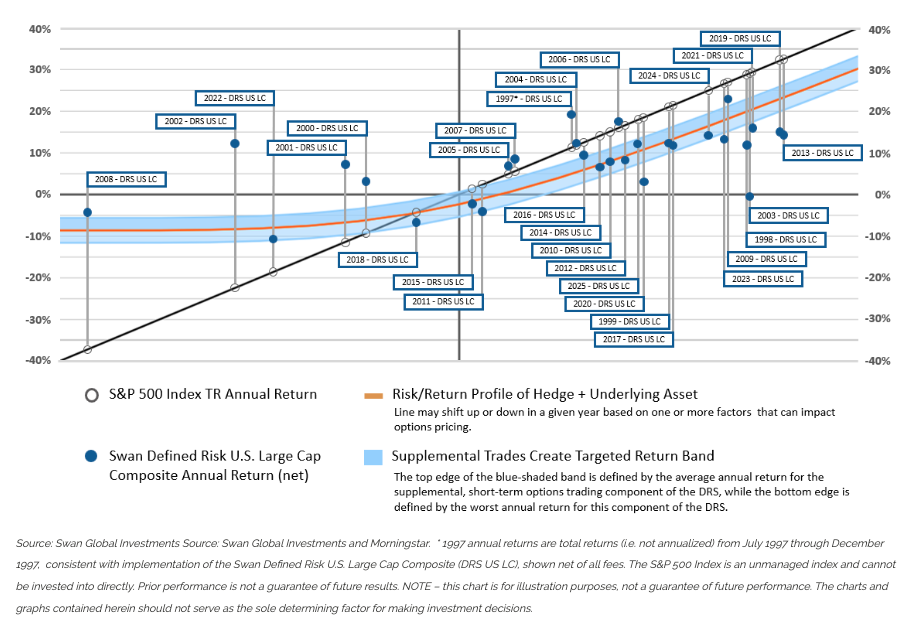
Essentially a profit-loss diagram, this chart shows:
- the linear return profile (profit/loss) of investing in the S&P 500,
- the curved gold line represents the return profile of the DRS’s hedged equity position; that is, the buy-and-hold position in the market combined with the protective elements of the long-term put option hedge;
-
- the gold line lags the S&P 500 in up markets but is still upward sloping,
- the gold line flattens out in down markets as the S&P 500 continues to drop.
- the blue area around the gold curve is the anticipated range of impact from overlaying Swan’s short-term premium collection trades over the hedged equity position.
It is our goal that returns of the DRS will be within or above the blue shaded area. More often than not, they have been.
That said, there are many different ways to manage the upside/downside trade-off. Morningstar currently has two broad groups called “Nontraditional Equity” and “Alternative”, which have four and eight specific categories within them, respectively.
Mapping the Liquid Alternatives Universe: 12 Categories, $627B, and the Funds That Didn’t Survive
The liquid alternatives universe spans 12 Morningstar categories, $627.58 billion in AUM, and 1,536 active funds — alongside approximately 2,100 that no longer exist.
The categories within these two broad groupings are as follows: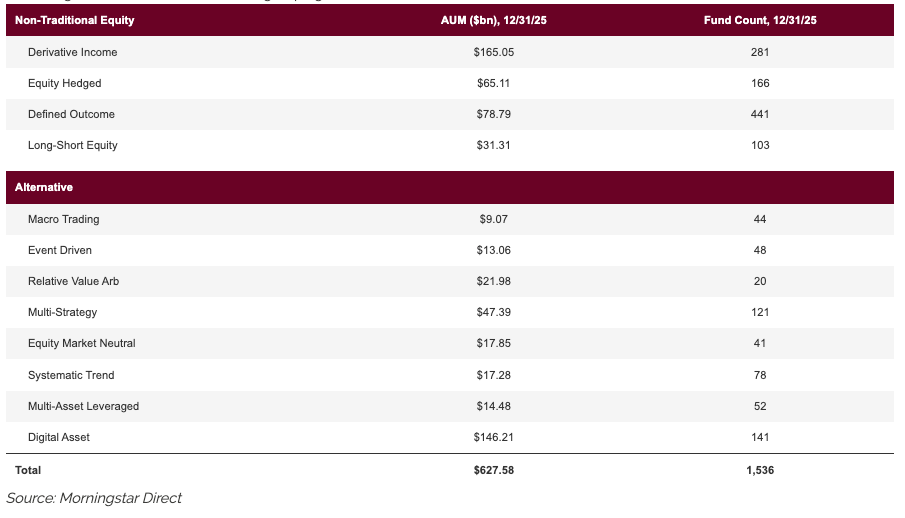
Understanding liquid alternatives is very difficult. First, there is a very wide dispersion of strategies. Second, many strategies are complex or have unique drivers of returns.
- Long-Short strategies try to short underperforming stocks as well as own outperforming stocks. The drivers of return and risk in Long-Short strategies are primarily at the individual stock level.
- Macro Trading strategies make top-down decisions and reallocate their portfolios based upon the anticipated relative performance of asset classes. The fate of these Macro Trading is driven by systematic, market factors.
- Market Neutral strategies might try to have very low exposure to market movements, which is difficult to achieve given the rising correlations amongst many of the world’s asset classes.
- Option-based strategies have multiplied and are represented by three separate categories: Derivative Income, Equity Hedged, and Defined Outcome.
- The Multi-Strategy category tries to replicate the “fund of funds” structure employed by hedge funds by rolling many of the above strategies together in one package.
I could go on, but the point is that broad definition of “liquid alternatives” encapsulates many different strategies and trying to understand all the factors at play becomes very difficult to manage.
The Portfolio Impact of Liquid Alts and Hedged Equity
A 20% DRS allocation in a traditional 60/40 portfolio historically produced higher returns, lower volatility, and a better Sharpe ratio than the same allocation to the Morningstar Multistrategy liquid alt category average — over the same 28-year period.
The bias some investors have against liquid alts is based on data suggesting it simply isn’t worth the extra time, complexity, and additional cost of including liquid alternatives into a basic, traditional portfolio. The data below illustrates the impact of adding the Morningstar category average of diversified Multistrategy funds (listed in the table as “Liquid Alts”) to a traditional 60% S&P 500, 40% bond portfolio. 10% is redirected from both the equity and bond allocations, giving an overall 20% allocation to the Multistrategy category. For comparison, the same changes were made using Swan’s Defined Risk Strategy.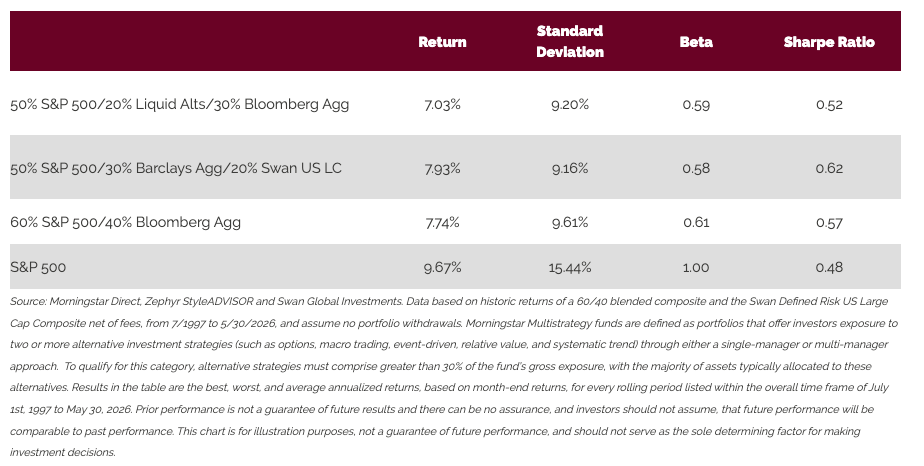
Using a broad-based index as a proxy for liquid alternatives, it is easy to see why some investors remain unconvinced. The returns are less, the risks are higher, and the Sharpe ratio is lower than the traditional 60/40 portfolio.
However, when using a 20% allocation to Swan’s Defined Risk Strategy, the reverse is true: returns have historically been higher, risks lower, and the Sharpe ratio shows an improvement over the traditional 60/40.
The lack of compelling results from many liquid alternatives leads directly to the next section, which discusses the high level of “failed” or shut-down liquid alt mutual funds and ETFs.
The Liquid Alternatives Lifecycle: Why 2,100 Funds Have Gone Extinct
Approximately 2,100 liquid alternative funds have gone extinct over the past 20 years — even as 1,536 remain active today. The lifecycle pattern is consistent: assets surge after crises and drain in recoveries.
While the return drivers of different alt strategies vary, broad growth in liquid alternatives assets under management was driven by two, macro-level market events. The first was following the Global Financial Crisis of 2007-09 and the second was following the Covid-19 Pandemic. Both crises were marked by a steep market sell-off followed by an era of ultra-loose monetary conditions.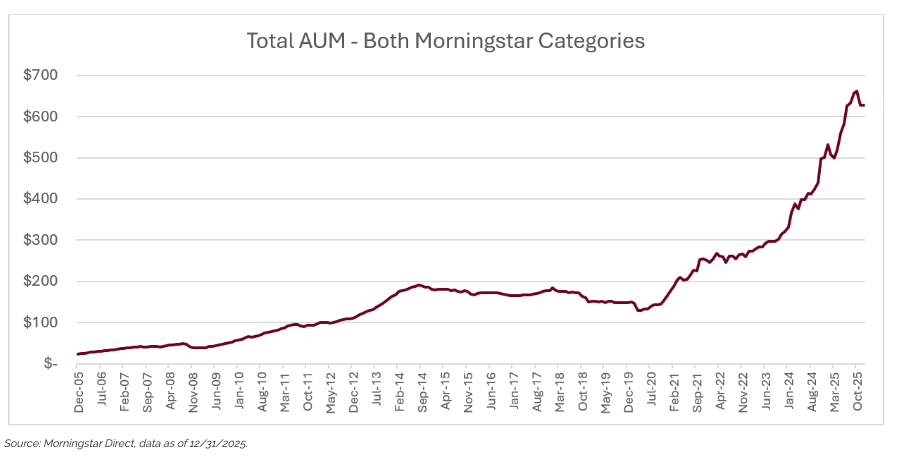
The liquid alternative fund space has also been marked by periods of shrinkage and consolidation. Although there are 1,536 funds in existence today, an in-depth study of Morningstar Direct’s data shows that around 2,100 alternative funds have gone extinct over the last 20 years.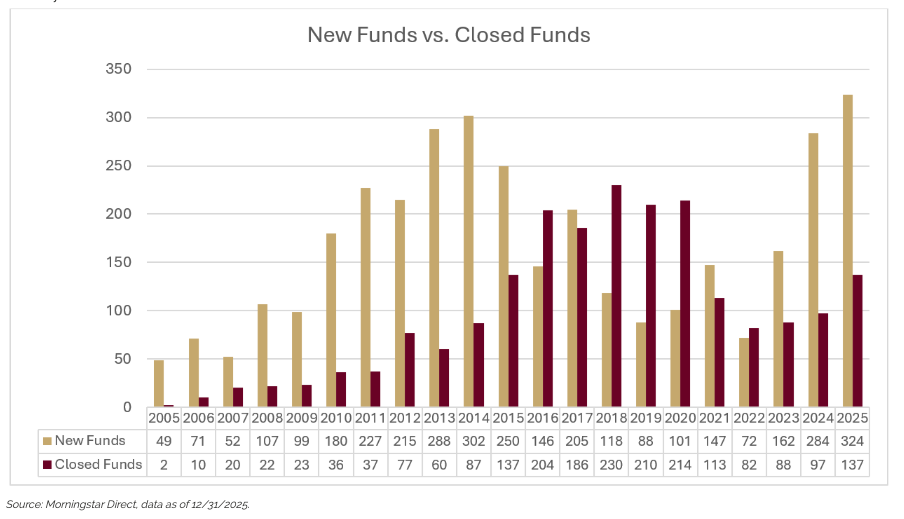
The life cycle of liquid alternative funds is not hard to discern:
- A financial crisis hits the markets
- The Fed lowers rates
- Investors seek out alternative assets for hedging, income, or non-correlated returns
- Markets stabilize and long-only investments return to favor
- Investors abandon alternative assets
- A new financial crisis hits; repeat the process
Often viewed as a “sometimes” asset class rather than an “always” asset class, the unfortunate reality then is that portfolios rarely contain a permanent liquid alternatives allocation. During equity bull markets, investors tend to abandon strategies that drag down overall portfolio performance too much. The lesson appears to be that if an alternative fund is to survive, if it is to be accepted as an “always” investment, it needs to provide enough upside market participation during bull markets.
Hedged Equity as a Permanent Liquid Alternatives Allocation:
The Always Invested, Always Hedged Case
The DRS is built for permanent allocation — not tactical deployment — because it is designed to justify its place in a portfolio in bull markets, not just bear markets.
Due to the vicious Darwinism in liquid alternatives, the median inception date for active funds in this category is only August 2022. That means half of the funds in this broad category have not been battle-tested by the Dot-Com Bust, the Global Financial Crisis, or even the inflation bear market of 2022. The only significant market sell-off to occur since August 2022 was the brief “tariff tantrum” of early 2025.
On the other hand, Swan has been managing the Defined Risk Strategy for almost three decades. As an “Always Invested, Always Hedged” strategy, the DRS invests in the market and seeks meaningful participation during bull markets. The strategy is hedged in an attempt to mitigate the downside risk in bear markets. By balancing upside market participation with downside risk mitigation across nearly three decades and five major market crises, the Defined Risk Strategy has earned consideration by many as a permanent alternative portfolio allocation — not a tactical one.
To see how hedged equity functions in other portfolio roles, continue the series:
- Hedged Equity as a Bond Alternative
- Hedged Equity as a Core Equity Allocation
- Hedged Equity as a Cash Deployment Vehicle
Key Takeaways:
- The liquid alternatives universe spans 12 Morningstar categories, more than $627B in AUM, and 1,536 active funds — yet approximately 2,100 have gone extinct over the past 20 years
- Most liquid alternatives fail the ‘always’ test: investors adopt them during crises and abandon them when markets recover
- Hedged equity strategies like the Swan Defined Risk Strategy (“DRS”) are structurally different: they maintain equity exposure during bull markets while actively managing downside risk in bear markets
- The DRS has operated continuously since 1997 — through the Dot-Com Bust, 2008 financial crisis, 2020 COVID crash, 2022 inflation bear market, and the 2025 Tariff Tantrum
- Unlike most liquid alternative strategies, the DRS is designed as a permanent, all-weather allocation — not a crisis hedge that gets abandoned in recoveries
Frequently Asked Questions
Q1: What is a liquid alternative investment?
A liquid alternative is a registered investment fund (mutual fund or ETF) that employs strategies traditionally associated with hedge funds — such as long-short equity, options strategies, or macro trading — while offering daily liquidity, lower minimums, and regulatory oversight. Morningstar currently tracks 12 liquid alternative categories with more than $627 billion in combined AUM and 1,536 active funds.
Q2: Why do liquid alternative funds have such high failure rates?
Liquid alternative funds have historically followed a crisis-adoption, recovery-abandonment cycle: assets flow in after market crises and flow out when long-only equity recovers. Morningstar Direct data shows approximately 2,100 liquid alternative funds have gone extinct over the past 20 years, even as 1,536 remain active — a failure and consolidation rate that reflects both underperformance and investor behavior. Strategies that cannot provide meaningful upside participation in bull markets tend not to survive to the next crisis.
Q3: How is hedged equity different from a liquid alternative fund?
Most liquid alternative strategies trade off upside participation for downside mitigation — long-short funds short individual stocks, market-neutral funds minimize equity exposure, and multi-strategy funds blend these approaches. Hedged equity strategies like Swan’s Defined Risk Strategy (DRS) maintain full equity market exposure (85–90% in S&P 500 ETFs) while using actively managed LEAPS put options to mitigate downside risk. The DRS is designed to participate meaningfully in bull markets while managing bear market losses — the ‘always invested, always hedged’ structure that most traditional liquid alternatives don’t achieve.
Q4: What does ‘Always Invested, Always Hedged’ mean?
‘Always Invested, Always Hedged’ is Swan’s description of the DRS’s permanent structure: the strategy maintains continuous equity market exposure (Always Invested) while keeping an active put option hedge in place at all times (Always Hedged). Unlike strategies that add hedges tactically during crises and remove them in recoveries, the DRS is designed as a through-cycle allocation — the hedge is never removed, only actively managed and adjusted.
Q5: How has the Swan DRS performed vs. a liquid alternatives allocation?
In analysis from July 1997 through March 2026, inserting 20% of the Swan DRS into a traditional 60/40 portfolio (replacing equal portions of stocks and bonds, 10% each) as a dedicated sleeve produced an annualized return of 7.62% % with a Sharpe ratio of 0.59 — compared to 7.44% and a Sharpe of 0.54 for the traditional 60/40. See the full Zephyr report here. Source: Morningstar Direct, Zephyr StyleADVISOR, Swan Global Investments. Past performance does not guarantee future results.
Q6: Can the Swan Defined Risk Strategy serve as a permanent alternatives allocation?
Swan’s DRS has been in continuous operation since July 1997 — through the LTCM and Russian Debt crises, the Dot-Com Bust, the 2008 Global Financial Crisis, the 2020 COVID crash, the 2022 inflation bear market, and the 2025 tariff-driven selloff. As an ‘Always Invested, Always Hedged’ strategy with meaningful equity upside participation, the DRS is designed to be held through full market cycles rather than adopted tactically. Whether it is appropriate as a permanent alternatives allocation depends on an investor’s specific risk tolerance, time horizon, and existing portfolio construction — this is not individualized investment advice.
A message from Advisor Perspectives and VettaFi: Discover something new! Click here to register for our upcoming webcasts.
Important Disclosures:
* The Swan Defined Risk Strategy, the Swan DRS, or DRS referred to in this document refer to the Defined Risk U.S. Large Cap Strategy Composite.
Swan Global Investments, LLC is a SEC registered Investment Advisor that specializes in managing money using the proprietary Defined Risk Strategy (“DRS”). SEC registration does not denote any special training or qualification conferred by the SEC. Swan offers and manages the DRS for investors including individuals, institutions and other investment advisor firms.
All investment strategies have the potential for profit or loss. Changes in investment strategies, contributions or withdrawals may cause the performance results of a client’s investment portfolio to differ materially from the reported composite performance. Different types of investments involve varying degrees of risk and there can be no assurance that any specific investment will either be suitable or profitable for a client’s investment portfolio. All Swan products utilize the Defined Risk Strategy (“DRS”), but may vary by asset class, regulatory offering type, etc. Accordingly, all Swan DRS product offerings will have different performance results and comparing results among the Swan products and composites may be of limited use. Economic factors, market conditions, and investment strategies will affect the performance of any portfolio and there are no assurances that it will match or outperform any particular benchmark. Historical performance results for market indices and/or categories generally do not reflect the deduction of transaction and/or custodial charges or the deduction of an investment management fee, the incurrence of which would have the effect of decreasing historical performance results. Swan’s investments may consist of securities which vary significantly from those in the benchmark indexes listed above and performance calculation methods may not be entirely comparable. Accordingly, comparing results shown to those of such indexes may be of limited use. The equity portion of portfolio is hedged using put options and the option income portion of the portfolio is actively managed to seek additional income. Both the equity and income portion of the strategy may experience losses in a market downturn but may be defined and mitigated by the hedge. The extent of potential losses will vary depending on many factors including, but not limited to; the options used, option strategy, expiration, prices, actions taken by portfolio manager. The adviser’s dependence on its DRS process and judgments about the attractiveness, value and potential appreciation of particular ETFs and options in which the adviser invests or writes may prove to be incorrect and may not produce the desired results. There is no guarantee any investment or the DRS will meet its objectives. All investments involve the risk of potential investment losses as well as the potential for investment gains. Prior performance is not a guarantee of future results and there can be no assurance, and investors should not assume, that future performance will be comparable to past performance. Minimum account size is $100,000. Management fee based on account size. For further information, including fee details, please get in touch with a Swan Global Investments representative by contacting the company directly at 970-382-8901 or www.swanglobalinvestments.com. 071-SGI-060526
Membership required
Membership is now required to use this feature. To learn more:
View Membership Benefits