There Are Now Half a Million More Home Sellers Than Buyers
Membership required
Membership is now required to use this feature. To learn more:
View Membership Benefits
San Antonio has been my adopted home for close to 40 years now. I’ve watched it grow through more than one boom cycle, but recent Redfin data suggests we could be looking at a bust.
In July, the sixth largest U.S. city posted the steepest drop in home sales of any major metro. Sales fell 12.6% from the same month last year. Just 2,333 homes changed hands, down from 2,669.
At the same time, the median sale price in San Antonio went up. It rose 3.3% to $320,243.
See more: NAHB Housing Market Index: Affordability Challenges Pull Down Builder Sentiment
According to economics 101, prices aren’t supposed to rise when demand falls off a cliff. And this isn’t a San Antonio quirk. It’s happening across the country, and the reason why says more about Washington than it does about housing.
A Buyer’s Market with No Buyers
Let’s zoom out a bit. U.S. home sales fell 4.1% in July to their lowest level in almost two years. New single-family home sales dropped 10.5% to an annualized 607,000 units, the weakest since January. Meanwhile, the 30-year mortgage sits at around 6.7%.
Redfin counted over 966,000 buyers in the market in July, the lowest number on record, against nearly 1.5 million sellers. That’s nearly half a million more people trying to sell than buy.
On paper, this is the strongest buyer’s market in a generation.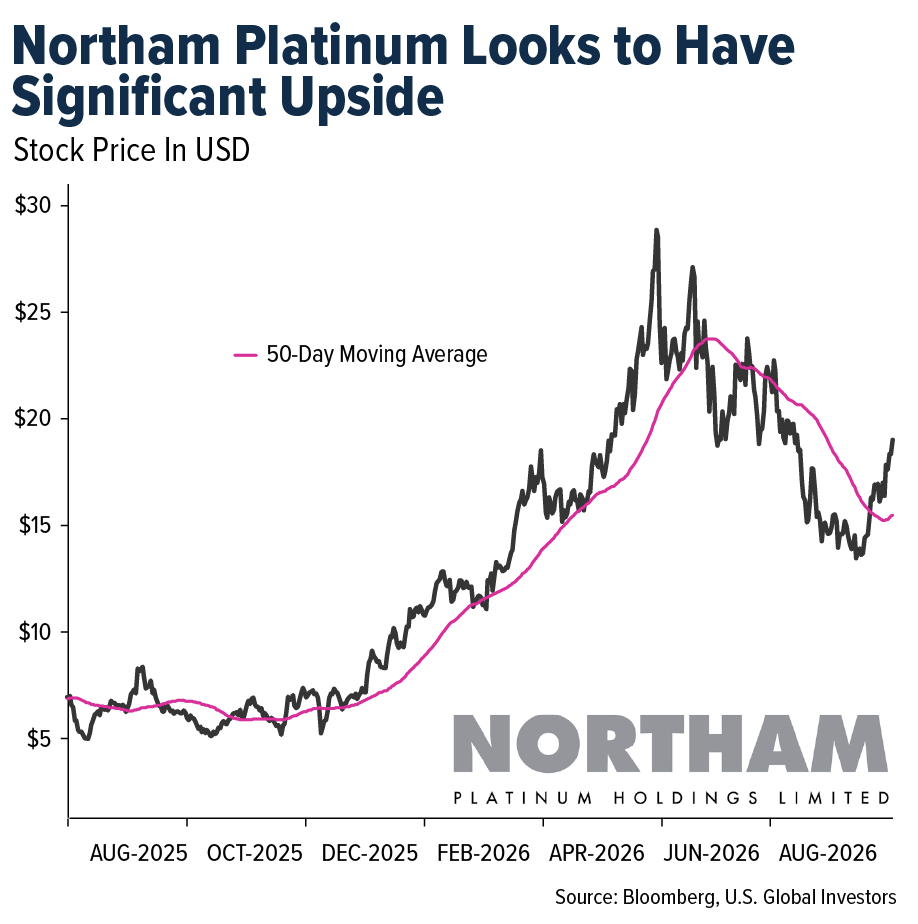
And yet the median U.S. sales price just hit $407,730, a record for any July. The FHFA House Price Index has prices up a little over 2% year-over-year. A family earning the median income of $106,800 now needs 34% of it just to cover the mortgage on a median-priced new home.
So Why Won’t Prices Break?
Prices aren’t coming down because, simply put, supply is getting choked off faster than demand is falling.
Single-family housing starts dropped 10% in July to an annualized 808,000 units, the lowest since November 2022 and down 15.7% from a year ago. Builder sentiment has been stuck at 35 on the NAHB/Wells Fargo Housing Market Index for more than two years running, with 50 marking the line between optimism and pessimism. Thirty-five percent of builders cut prices in August, by an average of 6%, and 63% are leaning on incentives to move product.
This tells me they can’t build any cheaper, so they’ve decided to build less.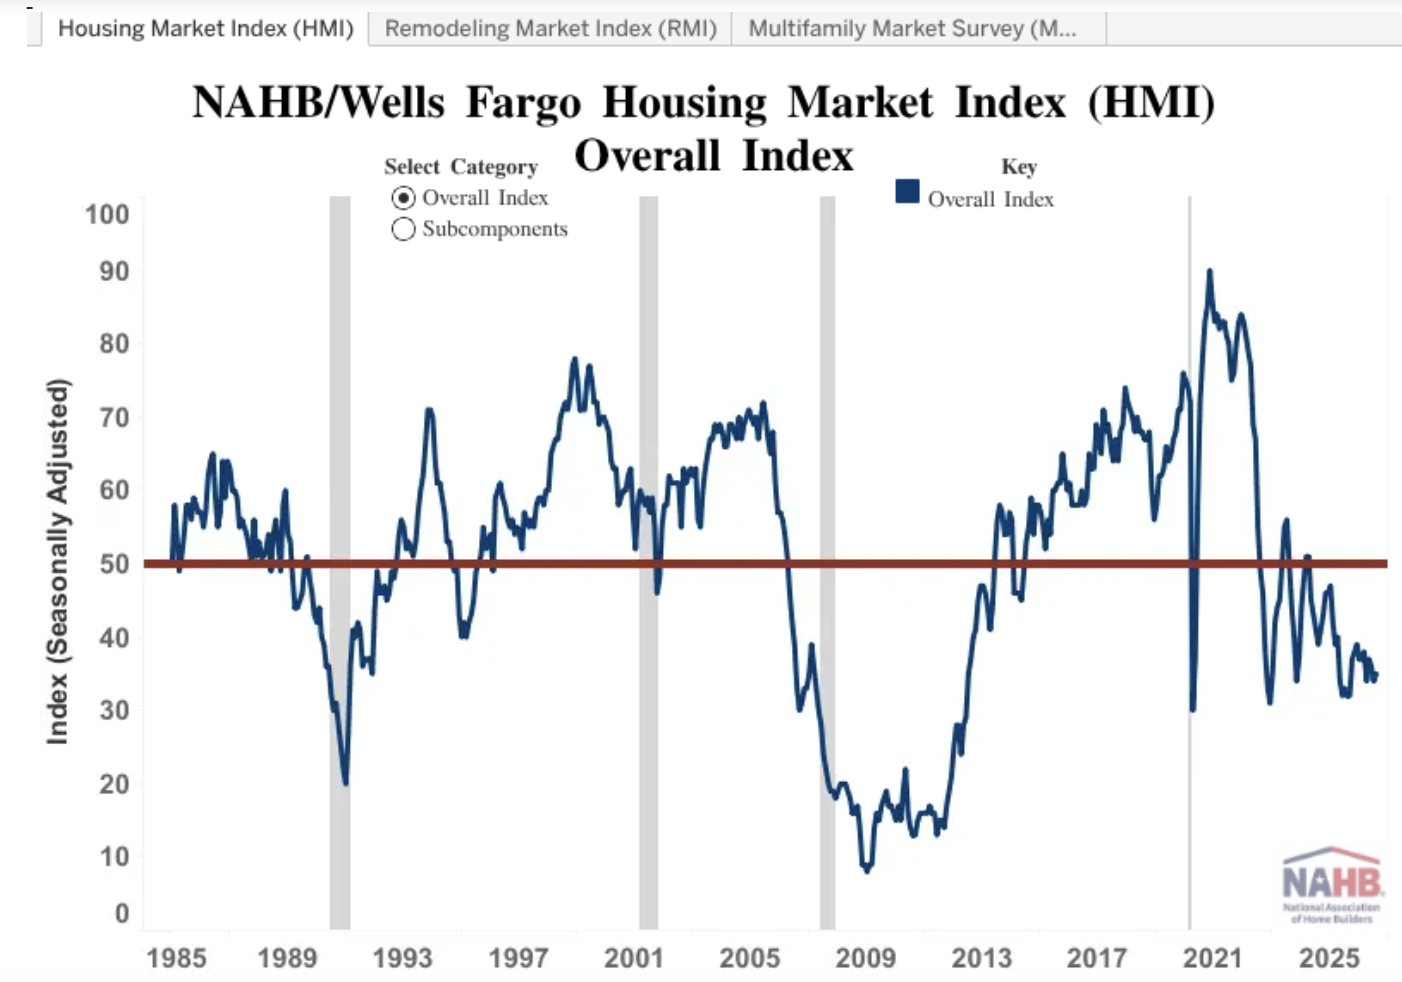

When you look at rising input costs, you understand why. Producer prices for construction companies rose more than 7% in the 12 months ended July 2026. Liquid asphalt was up an eye-watering 45%.
Aluminum mill shapes were up around 40%, steel mill products 22%, coper and brass 18%. Lumber and plywood jumped nearly 10%, the sharpest increase since March 2022.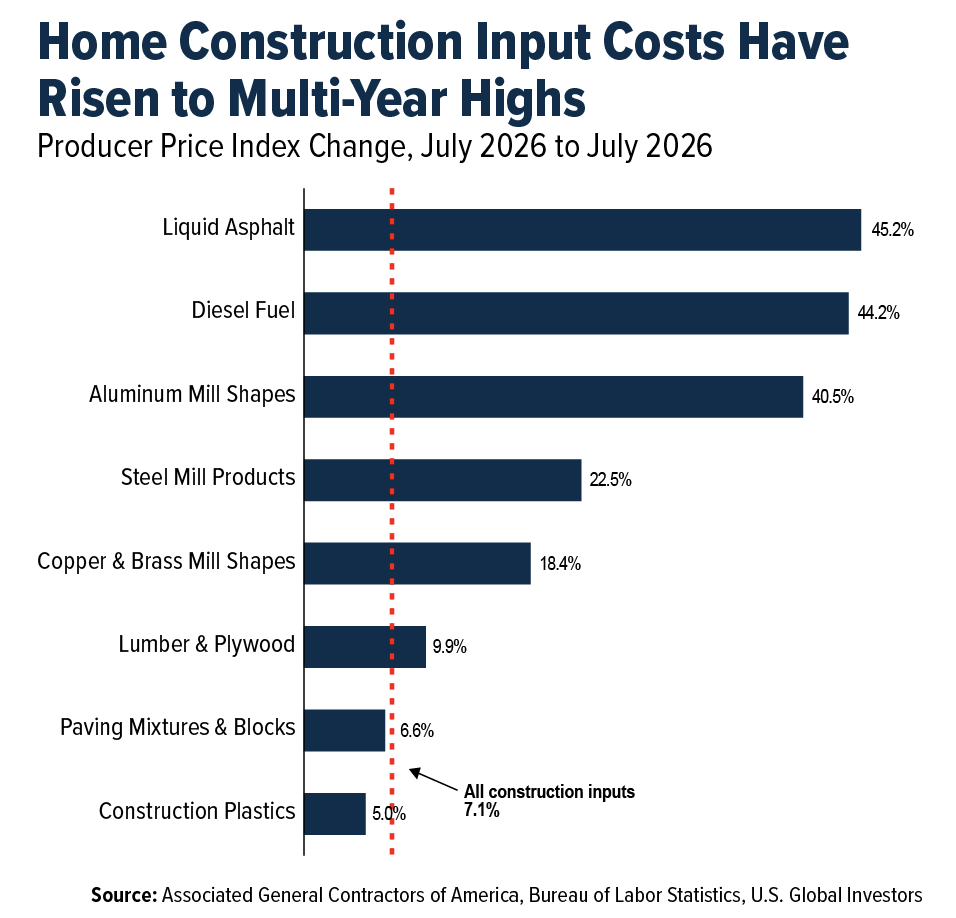
The Tariff Bill at the Lumberyard
The Wall Street Journal’s editorial page recently laid out the arithmetic behind the higher input costs. In short, American companies are paying 75% more for aluminum than the rest of the world right now.
Why? Because the metals tariffs are stacked on top of the existing China tariffs.
Part of these taxes go to the U.S. Treasury, obviously. The rest went to producers that no longer have to compete with foreign metal. Over the past year, shares of steelmaker Nucor gained 66%, Steel Dynamics 74%, Century Aluminum 98%, ArcelorMittal 117%.
Meanwhile, the S&P Homebuilders Index, which tracks the companies buying that steel and aluminum, is down about 7% over the same period.
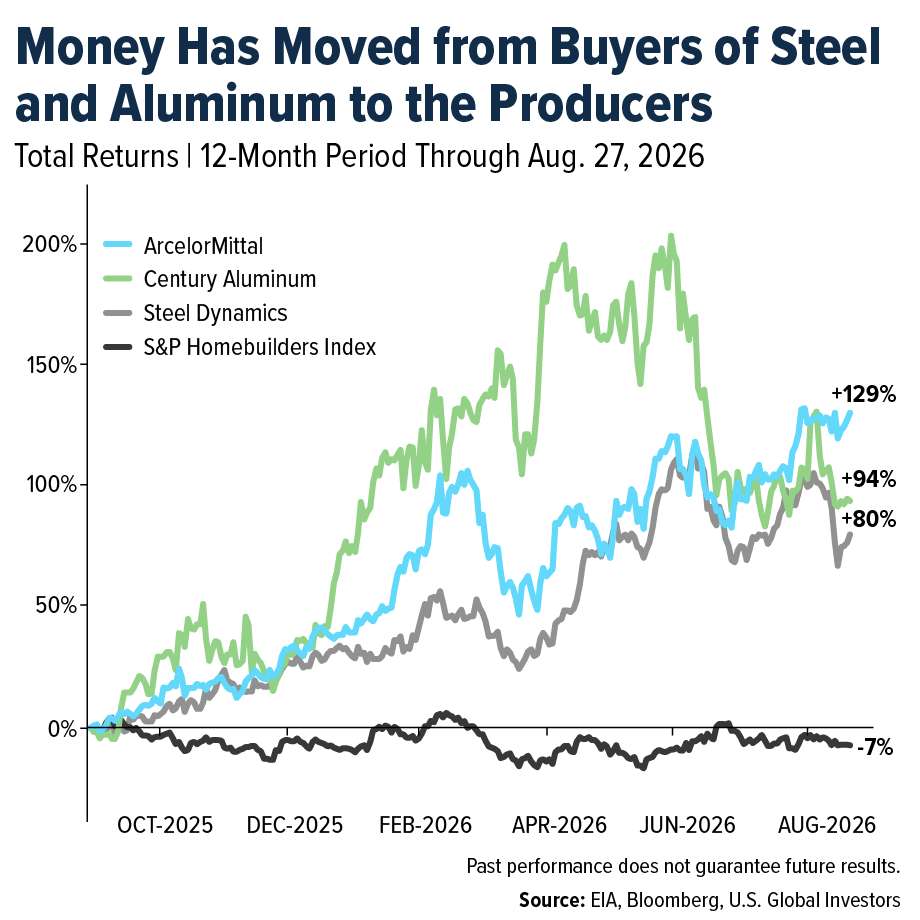
Tariffs didn’t destroy value so much as they relocated it. Money flowed out of the homebuilders—and the families buying from them—and into the share prices of domestic metal producers.
If you owned the right end of that trade, you did very well. On the other hand, if you were trying to buy a starter home in Texas, you ended up paying for it.
Don’t Wait on a Rate Cut to Save Housing
It doesn’t help that mortgage rates are headed in the wrong direction right now. Thirty-year Treasury yields are near their highest since 2007, with the 10-year around levels last seen at the start of the current administration. Investors are looking at record federal debt of $40 trillion and asking whether anyone is seriously committed to getting inflation back to 2%.
U.S. Bank’s economists point out that while much of the economy has adapted to higher borrowing costs, housing has not. “Meaningful relief for affordability will likely require lower long-term Treasury yields, slower home price appreciate or some combination of both,” the firm’s economic research group wrote.
New Fed Chair Kevin Warsh has abandoned forward guidance and has told investors to read market signals instead of central bank press releases. Say what you will about this communications style. The man is telling you the truth about where the power actually sits.
The Math Has Stopped Working for First-Time Buyers
The household side of this is thinner than the headline economy suggests. Real disposable income growth has trailed real spending for 24 consecutive months, the longest run since the 1960s, according to the Kobeissi Letter.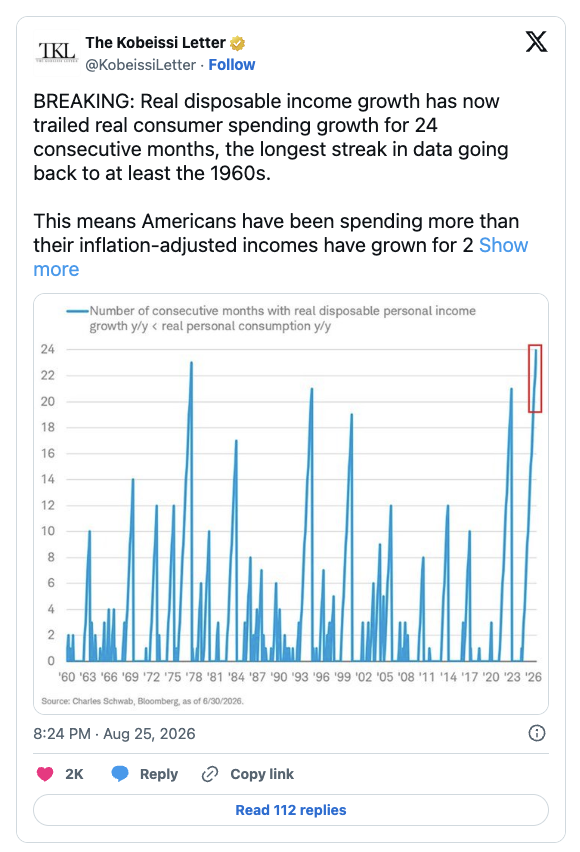
Meanwhile, the savings rate has slide to 2.7%, near the lowest level in history, and HELOC balances—or home equity lines of credit—just posted their 17th straight quarterly increase, to $459 billion. That’s the highest amount since the end of 2017.
When people start borrowing against their house to afford groceries, that’s worth paying attention to.
The affordability math has gotten a little absurd at the entry level. Renting now beats buying in all 50 of the largest U.S. metros, with the average buy-versus-rent gap at $858 per month. Here in Texas, Austin’s gap runs a jaw-dropping 139%.
According to Zillow, a household saving 10% of median income now needs 8.5 years to reach a 20% down payment. They need a further 6.2 years before owning pulls ahead of renting.
Housing isn’t broken because Americans stopped wanting homes. It’s stuck because the cost of building one keeps rising for reasons that have nothing to do with lumber demand or buyer appetite. The solution everyone’s waiting on runs through the bond and appropriations process rather than the Fed, which is a slower road than most investors have priced in.
Airlines and Shipping
Strengths
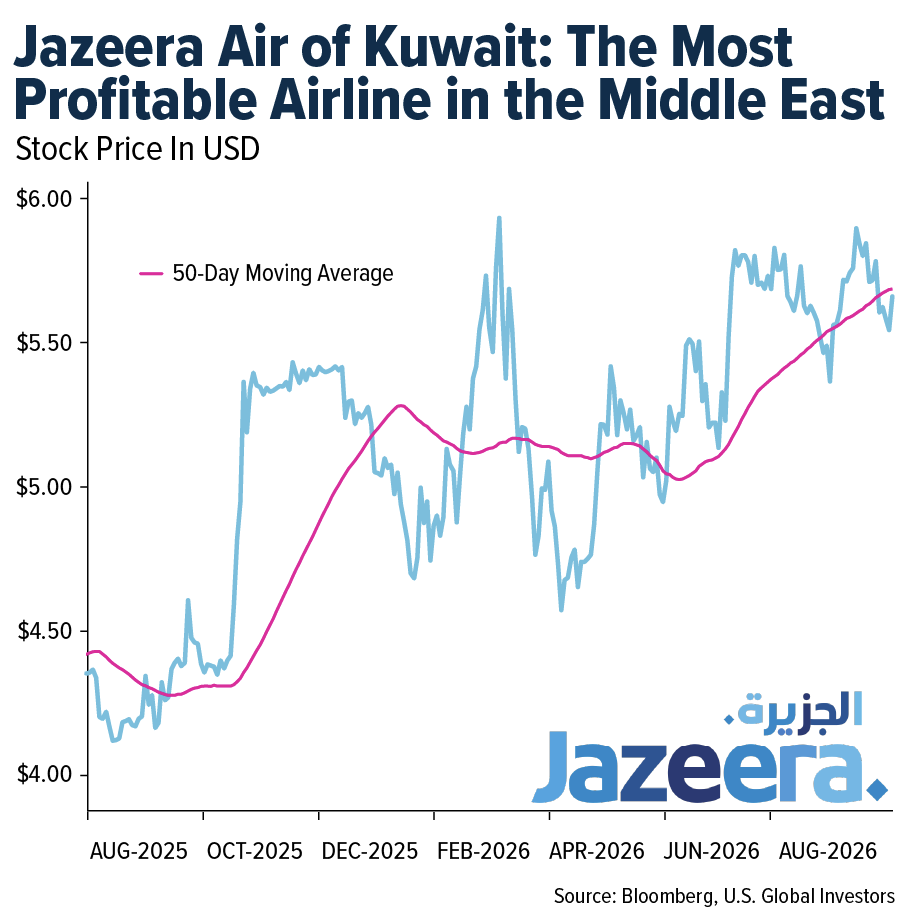
- The best-performing airline stock for the week was Alaska Air, up 4.7%. Jazeera Air in Kuwait is one of the most profitable airlines in the world. It has cut seat capacity by 40%, but revenues were still up 50%. Syria is a strong market. There is a new terminal in Kuwait. The state airline, Kuwait Air, is underperforming. Kuwait Airport was closed for 1.5 months, and Jazeera Air responded by moving operations to Saudi Arabia.
- Ships are reportedly increasingly using a U.S.-backed corridor through the Strait of Hormuz, weakening Iran’s grip on the waterway. Axios reported that 40 tankers carrying 16M barrels transited Friday night, though tracking data showed just 17 commodity vessels over the entire weekend, according to Reuters.
- North American flight activity was up 5% year-over-year (YoY) in July. Argus data shows North American flights up 5% YoY for July, driven by fractional and charter flights, which were up 11% and 6%, respectively.
Weaknesses
- The worst-performing airline stock for the week was Tongcheng Travel, down 9.1%, on the back of soft second quarter profits showing weak airline bookings. Dubai International Airport received 31.5M passengers in the first half (1H), down 31.3% year-over-year (YoY), according to Dubai Airports. Second-quarter (Q2) passenger traffic was 13M. First-half (1H) aircraft movements totaled 150,600, down 32.1% YoY, while Q2 aircraft movements totaled 62,500. First-half cargo volume was 751,340 tons, down 28.7% YoY, according to Morgan Stanley.
- Air freight traffic contraction continues as the typical end-of-summer lull nears. According to the latest figures from WorldACD, global tonnage declined 5% week-over-week (WoW) compared with the prior week. This extended the decline seen across all origins the previous week, which resulted in an overall 2% WoW decline.
- Through 2025, the airports with the most air traffic control delays, excluding weather, were EWR (Newark), BOS (Boston), DCA (Washington), PHL (Philadelphia), DEN (Denver), SAN (San Diego), and ORD (Chicago). Disruptions have continued into 2026. ATC delays, excluding weather, have not improved and have deteriorated, with year-to-date (YTD) disruptions climbing 30% YoY and 152% versus the comparable period in 2019, according to BMO.
Opportunities
- The CEO of ATP Co. indicates that the number of fares grows at a double-digit rate each year. Changes to those fares have also grown at a double-digit rate each year. There are changes every six days on average. At the start of the Iran war, fare changes were occurring every 1.5 days, or roughly 80M changes per day.
- Maersk’s upgraded 2026 guidance reflects firmer spot rates, though softer revenue, falling EBITDA, and possible cash burn cloud the 2027 outlook. Volatile freight markets and new vessel capacity pose medium-term risks, according to Bloomberg.
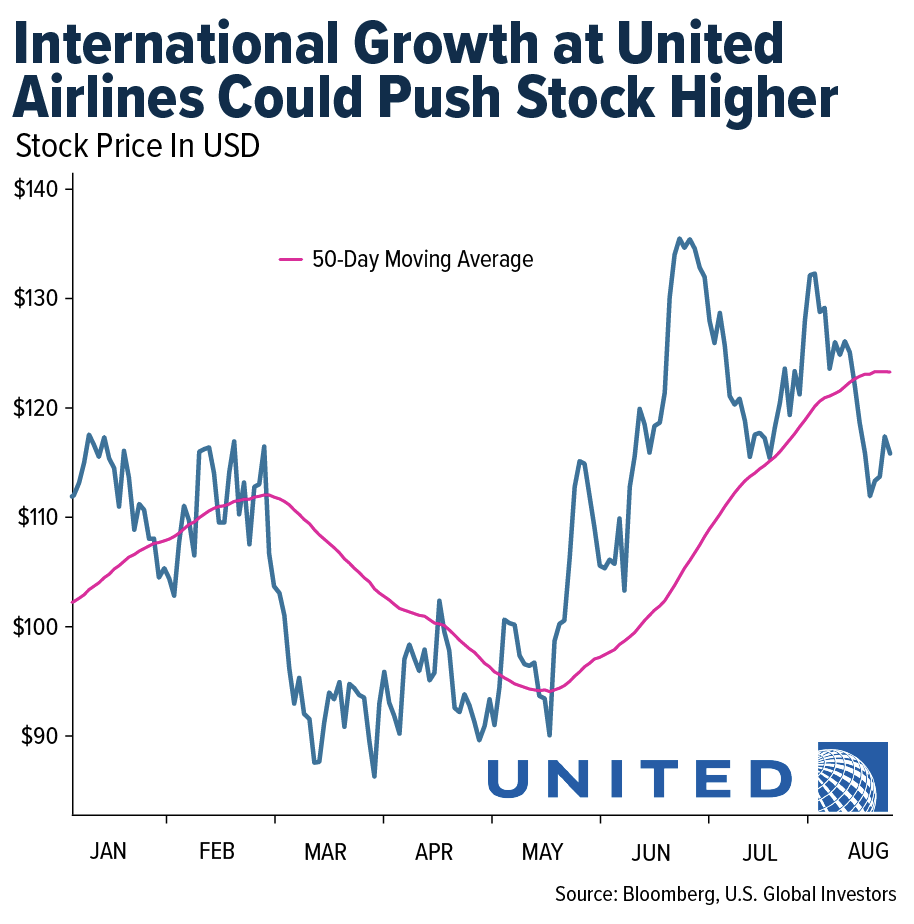
- United Airlines is adding 10 new international cities and three new routes across Europe and Asia for 2027, marking the largest international network expansion in the company’s history, according to Bloomberg.
Threats
- Air France-KLM’s 8% operating margin target for 2028 is being questioned by analysts, who forecast a recovery at least 150 basis points below management’s goal. Capacity growth has slowed to 2–3% in 2026 due to less-profitable routes following the Iran war, according to Bloomberg.
- According to Clarkson’s, China’s port congestion index, which measures the share of global fleet capacity waiting at ports or nearby anchorages, rebounded sharply last week and remained near record highs after a brief decline. Congestion at the Port of Shanghai reached a historical high, exceeding levels seen during the 2022 disruptions.
- Raymond James lowered estimates across its airline coverage universe, mainly due to a higher jet fuel price forecast. Its forecasts for the second half (2H) of 2026, 2027 and 2028 increased by 18%, 14% and 7%, respectively. The impact was partly offset for non-U.S. airlines by a weaker U.S. dollar against local currencies.
Luxury Goods and International Markets
Strengths
- Ferrari recently sold the first production version of its new all-electric Luce for $40M at a charity auction, setting a record for the most expensive new car ever sold at auction. All proceeds from the sale will be donated through the Ferrari Foundation to support educational programs and other charitable initiatives, highlighting the strength of the Ferrari brand and its commitment to philanthropy.
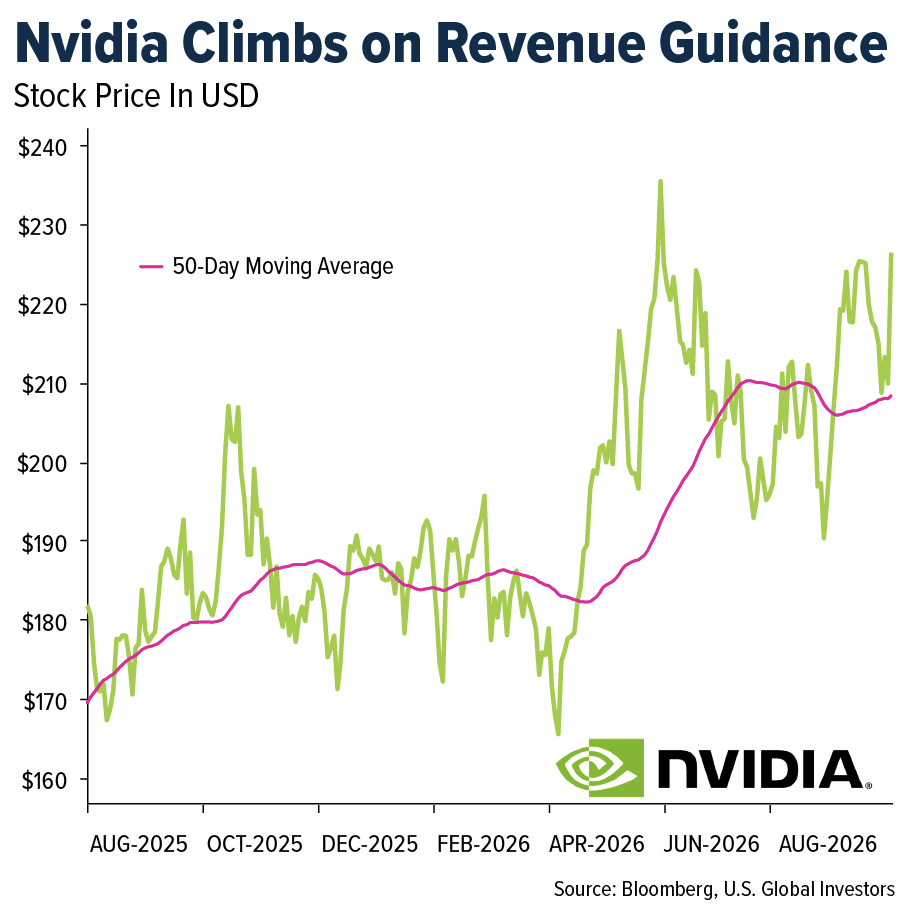
- NVIDIA reported another strong quarter, driven by continued demand for its AI chips and data center products. The better-than-expected results boosted investor confidence in the AI growth story, helping technology stocks move higher and supporting broader market sentiment.
- Amorepacific Corp., a South Korean cosmetics company, gained approximately 9.53% over the past five trading days, making it the top performer in the S&P Global Luxury Index. Shares rallied on growing investor optimism surrounding the company’s earnings outlook, supported by strong demand for its premium beauty products and continued growth in key Asian markets.
Weaknesses
- Pernod Ricard reported weaker-than-expected annual results, with organic sales declining 3.9% as weak demand in both the U.S. and China continued to weigh on the business. Management also lowered its medium-term growth outlook, citing cautious consumer spending, inventory adjustments and ongoing pressure on premium spirits demand, particularly in China.
- China’s industrial profits grew at a slower pace in July, with year-over-year (YoY) growth easing to 11.2% from 15.1% in June. The weaker results reflect ongoing pressure from soft domestic demand and cautious consumer spending, highlighting the uneven nature of China’s economic recovery.
- Lucid Group, a luxury electric vehicle manufacturer, declined approximately 9.35% over the past five trading days, making it the worst performer in the S&P Global Luxury Index. Shares fell as investors weighed ongoing concerns about demand, profitability, and the company’s path toward sustained production growth.
Opportunities
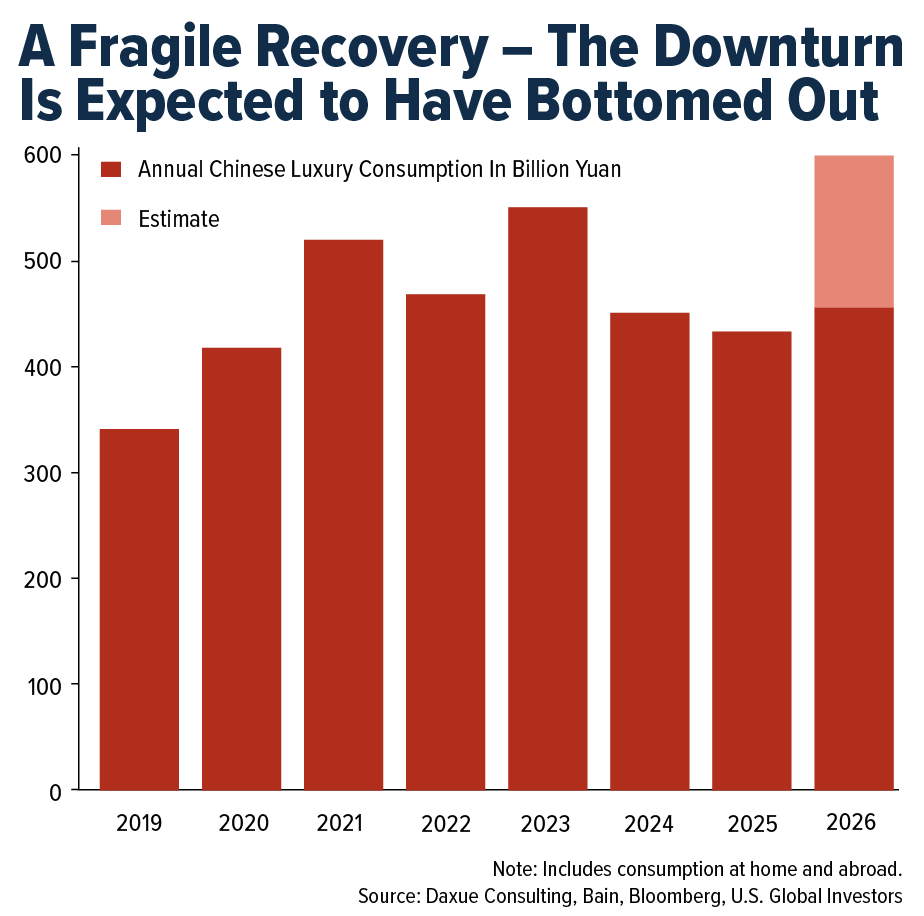
- After several years of weakness, China’s luxury market appears to be stabilizing. Consumer confidence is improving, supported by a stronger stock market and better sentiment among higher-income consumers. The recovery is expected to continue in 2026, though growth is likely to be uneven, with jewelry and high-end watches expected to outperform fashion.
- Travel demand remains resilient, supporting spending on travel and other experiences despite a mixed economic backdrop. U.S. travel spending rose 6.2% year-over-year (YoY) to $122.1B in July, while hotel operators raised their 2026 outlooks as strong leisure, group and international demand continued through the first half of the year. Luxury and upper-upscale hotels have been particularly strong, suggesting higher-income consumers remain willing to prioritize experiences such as travel.
- The U.S. continues to increase economic pressure on Iran in an effort to end the conflict in the Middle East and improve the flow of oil through the Strait of Hormuz, a key route for global energy supplies. This week, the U.S. imposed sanctions on nearly 60 individuals, entities and vessels linked to Iran’s oil trade, weapons procurement and other activities, signaling a continued effort to isolate Iran economically and reduce disruptions to global energy markets.
Threats
- On Friday, Fed Chair Kevin Warsh emphasized in his Jackson Hole speech that inflation remains above the Fed’s 2% target and said policymakers must be confident that inflation is moving toward that goal at a sufficient pace. He also noted that financial conditions do not appear particularly restrictive and that the economy remains strong, supported by healthy consumer spending and elevated corporate profits. His comments opened the door to additional rate hikes if inflation fails to make further progress.
- According to Bain & Company, China’s secondhand luxury market grew 15% to 20% in 2025, making it one of the fastest-growing segments of the luxury industry. While still relatively small compared with the overall luxury market, it remains much less developed than Japan’s more mature resale market. The trend reflects Chinese consumers becoming more value-conscious.
- Growing trade tensions between the U.S. and Canada have escalated into a new tariff dispute after trade negotiations collapsed on August 21. The U.S. imposed 50% tariffs on approximately $20B of Canadian goods effective August 22, prompting Canada to announce matching retaliatory tariffs on August 25. Higher import costs and supply chain disruptions could lead to higher prices, potentially weakening consumer confidence and weighing on spending across the consumer discretionary sector.
Energy and Natural Resources
Strengths
- The best-performing commodity for the week was wheat, up 12.05%. Intensifying military strikes against Black Sea ports and grain infrastructure have disrupted regional exports, creating a supply bottleneck that could push global wheat prices higher.
- London Metal Exchange copper futures crossed $14,300 per ton this week, trading near historic highs and on track for a ninth consecutive weekly gain. U.S. pre-tariff stockpiling drained global inventories, with Shanghai stockpiles plunging 19% in one week and tightening physical supply.
- Met coal prices have rallied sharply over the past month, with premium low-volatility hard coking coal now above $260 per ton, the highest level since March 2024. Prices are 20% above consensus estimates for the second half (2H) of 2026 of $220 per ton and UBS’s $238 per ton forecast.
Weaknesses
- The worst-performing commodity for the week was crude oil, down 4.22%. On the demand side, Sinopec said China has reached peak oil demand, as second-quarter crude imports fell by 3.3M barrels per day. On the supply side, Venezuela and the United Arab Emirates could potentially leave OPEC, raising concerns about weaker cartel discipline and increased price competition among major producers.
- July global crude steel output fell 0.3% year-over-year (YoY) and remained 0.6% lower year-to-date (YTD). The decline was entirely China-led, with output down 3.6% YoY and 3.1% YTD. Ex-China production rose 3.4% YoY and 2.4% YTD, according to Morgan Stanley.
- Lynas Rare Earths missed full-year profit estimates as costs increased and challenges emerged in ramping up new Australian facilities, despite a 76% increase in full-year revenue on stronger demand for rare earths outside China. Russian diamond miner ALROSA swung to a net loss of 9.53B rubles in the first half (1H) of 2026 under IFRS, compared with a profit of 40.62B rubles in the same period a year earlier, as the diamond market has been disrupted by synthetic diamonds.
Opportunities
- Morgan Stanley is forecasting a longer Middle East supply recovery, leaving the market in deficit through the fourth quarter (Q4) and first quarter (Q1). The firm raised its Brent forecast, with prices expected to peak at $100/barrel in Q4. This could benefit U.S. refiners like Valero Energy (VLO), which are helping fill the supply gap as global fuel markets remain tight due to the Strait of Hormuz disruption and Ukrainian attacks on Russian energy infrastructure.
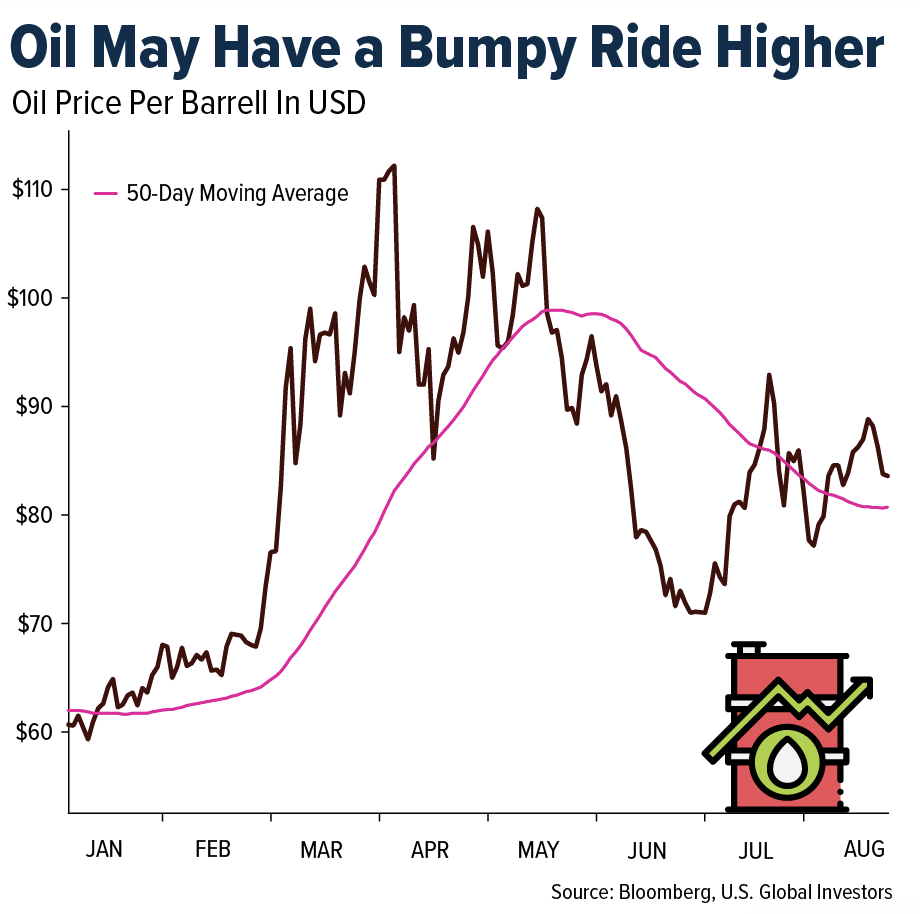
- A record 21 Ukrainian drone strikes in August, including an attack on the 300,000-barrel-per-day Yanos refinery, pushed Russian oil processing to a 20-year low of 3.8M barrels per day and prompted discussions about extending diesel export bans beyond September. The supply deficit is tightening global fuel markets ahead of winter, supporting refining margins and potentially benefiting refiners over exploration and production (E&P) stocks.
- According to Morgan Stanley, the U.S. Strategic Petroleum Reserve (SPR) is at a 44-year low. Last week, the SPR declined by another 3.7M barrels to 289.7M barrels. The SPR has a statutory floor of 252.4M barrels, below which the president loses routine limited-drawdown authority and would need to declare a severe supply emergency to release additional barrels. While this is more of a near-term concern, if oil prices fall after the conflict, U.S. purchases could help put a floor under prices.
Threats
- Aging port infrastructure is capping Venezuela’s oil exports at around 1.25M barrels per day despite rising output, with tankers waiting up to 30 days to load, Reuters reported, citing shipping data and sources. Chevron is among the companies seeking access to additional terminals to ease congestion.
- Restart schedules for CATL’s Jianxiawo lepidolite mine in Jiangxi face renewed regulatory uncertainty, putting a substantial amount of expected supply at risk. Analysts warn that the bottleneck could eliminate projected global surpluses and trigger sharp lithium price volatility into the fourth quarter (Q4).
- Natural gas has overtaken crude oil as the primary inflation threat for European bond traders, as winter contracts have doubled compared with last year. The persistent energy price spike has pushed 10-year government bond yields in Germany and the United Kingdom to multi-decade highs.
Bitcoin and Digital Assets
Strengths
- Funds tracking gold and Bitcoin drew a record $7 billion over five trading days, including $1.5 billion into BlackRock’s $60 billion iShares Bitcoin Trust ETF (IBIT). The surge pushed IBIT into the top 10 U.S. ETFs by weekly inflows, reinforcing Bitcoin’s growing role alongside gold as a hedge against fiscal and currency risks.
- More than a dozen financial institutions, including Bank of America, Wells Fargo and Santander, are advancing a global stablecoin venture, while 39 state banking associations representing roughly 3,000 banks are backing the BankChain Alliance. The shift highlights growing acceptance of blockchain-based payments as traditional banks move from resisting stablecoins to exploring direct participation in the market.
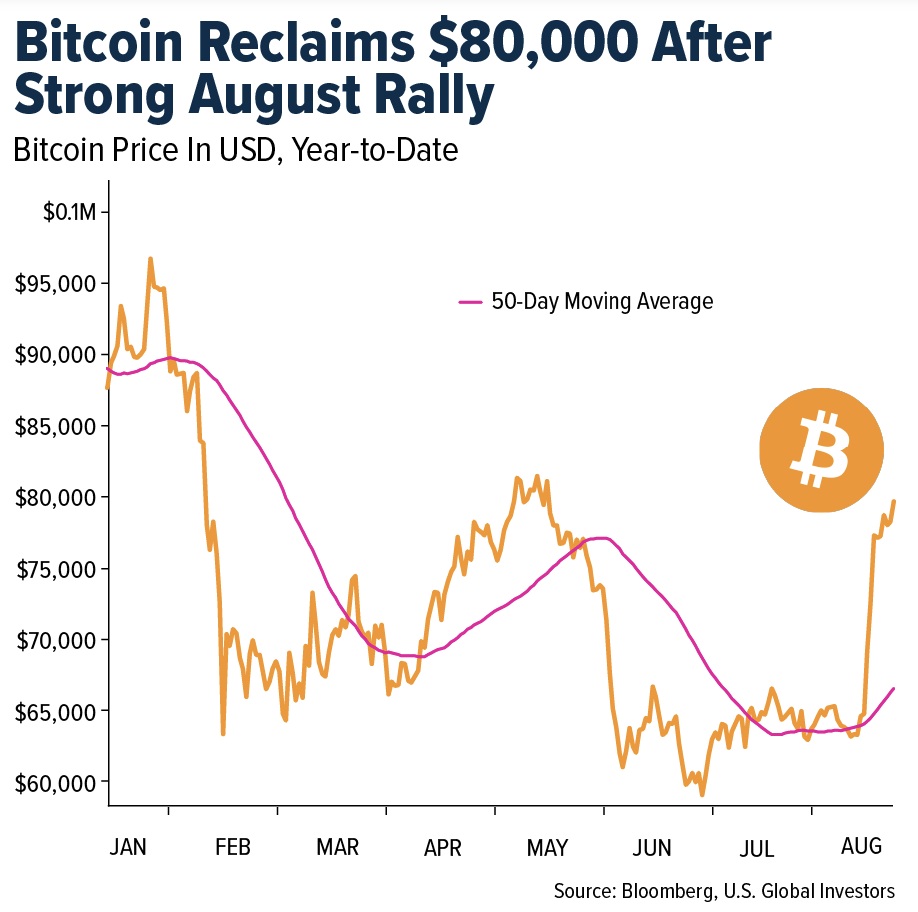
- Bitcoin has gained roughly 22% since August 20 and briefly topped $81,000 before profit-taking slowed momentum. U.S. spot Bitcoin ETFs have now recorded eight consecutive sessions of net inflows, attracting $2.8 billion in their longest streak since April, providing continued institutional support for the rally.
Weaknesses
- CryptoQuant said traders’ unrealized profit margins reached 20.5%, the highest since June 2025, while short-term holders realized $1.2 billion in profits between August 20 and 22. Bitcoin inflows to exchanges also rose to roughly 53,000 BTC, the highest since June 5, signaling increased potential for profit-taking after the recent rally.
- Glassnode data shows nearly 8% of Bitcoin’s total supply was acquired within this price range, including about 5% near $80,000 alone. As Bitcoin returns to these levels, investors who previously bought there may sell to recover their initial investment, potentially limiting further near-term gains.
- A pricing error involving Coinbase’s staked-ETH token (cbETH) caused roughly $1.8 million in user positions to be liquidated after the reported price deviated from the asset’s actual value. The incident highlights how DeFi lending platforms remain vulnerable to inaccurate price data used to value collateral.
Opportunities
- The SEC submitted a proposal to the White House that would clarify how investment advisers and investment companies can custody digital assets while eliminating certain requirements the SEC considers outdated. If adopted, the framework could reduce regulatory uncertainty and make it easier for investment firms to expand their participation in digital assets.
- Shinhan, one of South Korea’s five largest financial groups, with about $100B in assets under management, will use Visa’s platform to test stablecoin issuance, remittances and redemptions. The partnership will also pilot stablecoin settlement for card payments and business-to-business (B2B) and business-to-consumer (B2C) transactions, expanding real-world use cases for digital assets.
- The Bank of Japan, Ministry of Finance and Financial Services Agency are developing a system to settle stocks and government bonds using blockchain, potentially reducing the current two-day process to near real time. The initiative could improve the efficiency of Japan’s capital markets while expanding institutional use of tokenized financial infrastructure.
Threats
- Bitcoin is holding near $80,000 as investors await Fed Chair Kevin Warsh’s Jackson Hole speech, with July personal consumption expenditures (PCE) inflation at 3.7%, well above the Fed’s 2% target. A more restrictive policy outlook could push yields higher and tighten financial conditions, weakening the liquidity environment that has supported Bitcoin’s recent gains.
- Core Lightning, software used to operate Bitcoin’s Lightning Network, a layer designed for faster, lower-cost payments, issued an emergency warning after AI-assisted research uncovered multiple vulnerabilities. Operators unable to immediately patch were advised to temporarily take nodes offline, marking the second Lightning security emergency this month after an earlier BTCPay Server flaw allowed attackers to drain funds.
- Prediction markets face mounting legal uncertainty across the U.S. Connecticut sued Kalshi, a federally regulated prediction-market platform that allows users to trade contracts on the outcomes of real-world events, seeking to block its sports-related contracts as illegal gambling. Nearly half of U.S. states are now involved in prediction-market disputes, highlighting uncertainty over whether federal Commodity Futures Trading Commission (CFTC) oversight or state gambling laws should govern the industry.
Defense and Cybersecurity
Strengths
- In Second quarter (Q2) FY2027, NVIDIA posted record revenue of $96.2B, up 106% year-over-year (YoY) and above the $92.0B consensus estimate. Data Center sales rose 117% YoY to $89.0B, while free cash flow reached $26.14B. GAAP diluted EPS jumped 115% YoY to $1.76 as production of Blackwell Ultra GPUs accelerates. CEO Jensen Huang said AI demand remains strong as businesses and governments expand AI infrastructure.
- CrowdStrike posted Q2 FY2027 revenue of $1.47B, up 26% YoY, while annual recurring revenue (ARR) rose 25% YoY to $5.84B. Strong demand for AI and cloud security helped drive results. The company raised its full-year FY2027 revenue guidance to $5.99B–$6.01B.
- The U.S. Department of War awarded The Boeing Company a $131.23B ceiling indefinite-delivery/indefinite-quantity contract on August 26, 2026, for F-15 Eagle Crest aircraft production, modernization and foreign military sales. It is one of the largest single-contract fighter aviation ceilings in U.S. defense history.
Weaknesses
- Recent Taiwanese defense reports and inventory audits estimate the U.S. has used 65% of its pre-war Patriot interceptor stockpile and up to 80% of its THAAD missile inventory following heavy air-defense use in the Middle East. Analysts warn that replenishing these stocks could take well beyond 2030 due to production bottlenecks.
- The Bellevue Village Board unanimously passed a temporary data center construction moratorium through August 2027 on August 24, 2026, citing electrical grid capacity and municipal water constraints.
- A new Government Accountability Office (GAO) report found that shipyard congestion and drydock shortages caused U.S. attack submarines to lose more than 15,000 operational days from 2016 to 2025, costing $3.4B in idle maintenance time. The GAO projects another 14,000 lost operational days, costing $3.1B, through 2030 due to nuclear defueling and repair backlogs.
Opportunities
- Global semiconductor revenue is projected to surge 92% year-over-year (YoY) to $1.60T in 2026, up from $809B in 2025. AI demand is driving a major memory boom, with memory revenue projected to reach $837B.
- Kratos is expanding production at its Michigan facility to mass-produce Spartan TDI-J85 engines for Boeing’s Joint Direct Attack Munition Long Range (JDAM LR) program. The expansion follows a $75M U.S. military contract awarded to Boeing for the long-range weapon.
- AeroVironment is investing $100M to develop a 20-acre defense campus in Moorpark, California, bringing five regional facilities together for research, engineering and manufacturing. The campus is expected to be fully operational by 2029 and follows major U.S. Army contract wins for the company’s P550 autonomous reconnaissance drone.
Threats
- The Department of Defense’s (DoD) proposed Pricing Transparency Memo has raised concerns across the defense sector. The policy would give the government greater access to contractor cost data and increase scrutiny of pricing and profit structures. Critics warn it could discourage commercial technology companies from pursuing defense contracts and slow innovation.
- With U.S. Patriot and THAAD interceptor inventories under pressure from sustained Middle East air-defense engagements, the Department of Defense is accelerating low-cost solid rocket motor (SRM) and modular interceptor programs to reduce reliance on legacy suppliers.
- China sent a record 244 coast guard and research vessels around Taiwan in August, conducting hydrographic seabed mapping to support People’s Liberation Army (PLA) submarine operations. The activity raises the risk of an unannounced maritime quarantine or blockade affecting key Indo-Pacific shipping lanes.
Gold Market
This week gold futures closed the week at $4,508.30, down $172.30 per ounce, or 3.68%. Gold stocks, as measured by the NYSE Arca Gold Miners Index, ended the week lower by 2.2%. The S&P/TSX Venture Index came in up 0.08%. The U.S. Trade-Weighted Dollar rose 0.87%.
Strengths
- The best-performing precious metal for the week was palladium, up 5.30%, on persistent supply constraints from South Africa and Russia. Meanwhile, share prices for South African precious-metal miners are on track for their best month on record. The FTSE/JSE Precious Metals and Mining Total Return Index has surged 38% in August, putting it on track for its strongest monthly performance since records began in 2006. AngloGold Ashanti, Pan African Resources and Gold Fields have each gained more than 40% month-to-date, highlighting strong investor momentum across the precious-metals mining sector, according to Bloomberg.
- Gold ETFs saw their biggest inflow since October 2025, with $7.3B flowing in during the week ended August 26, according to BofA, citing EPFR Global data. Gold is heading for its biggest monthly gain this century after advancing nearly 14% in August, according to Bloomberg, fueled in part by a U.S. Treasury intervention in the bond market that revived the debasement trade.
- China’s gold accumulation may be significantly higher than official figures suggest. China is estimated to have acquired 88 tons of gold through the London OTC market in May and June, including roughly 40 tons in June, compared with the 15 tons officially reported for the month. The accumulation comes as Beijing reduces its U.S. Treasury holdings and expands gold reserves, reinforcing the broader trend toward central-bank diversification into physical bullion.
Weaknesses
- The worst-performing precious metal for the week was silver, down 4.65%, as Fed Chair Kevin Warsh emphasized the need to bring inflation back to the Fed’s 2% target. Spot gold and silver fell 3% and 4%, respectively, following his Jackson Hole speech Friday morning. Zhaojin Mining also reported weaker-than-expected gold production. First-half attributable net profit rose 10% year-over-year (YoY) to RMB1.58B, but first-half earnings were only 30% of full-year market consensus estimates, with UBS citing lower-than-expected gold production and investment losses.
- Gold’s elevated valuation relative to Treasuries raises reversion risk. Bloomberg Intelligence warns that gold could face a prolonged period of underperformance following its surge above $5,000 an ounce in the first quarter (Q1). Gold’s premium relative to long-term U.S. Treasury bonds has reached its highest level since 1987, suggesting stretched valuations and increasing the risk of a potential reversal.
- Sibanye Stillwater’s production and earnings fell short of expectations. South African gold production came in 5% below UBS estimates, while U.S. platinum group metal (PGM) production was 4% below forecasts. EBITDA from both businesses also missed expectations, reflecting weaker operational performance across key precious-metals assets, according to UBS.
Opportunities
- Agnico Eagle Mines agreed to invest C$57.2M (approximately US$41.5M) for a roughly 10% stake in Radisson Mining Resources, providing funding for underground exploration at Radisson’s flagship Quebec gold project. The investment brings backing from a major gold producer and could help advance exploration and unlock additional value at the project, according to Dow Jones.
- Dollar concerns are strengthening the outlook for further gold gains. Crédit Agricole expects gold to return to $5,000 an ounce by year-end and extend gains into 2027, citing concerns that U.S. policies could further undermine confidence in the dollar. Continued pressure on the greenback could reinforce demand for gold as an alternative store of value.
- Northam Platinum could benefit from competitive merger and acquisition (M&A) interest. Northam received an unsolicited approach from a major South African platinum group metal (PGM) producer regarding a potential asset- or corporate-level transaction. The company plans to engage additional potential counterparties, a move Morgan Stanley believes could create a competitive bidding process and help maximize transaction value for shareholders.
Threats
- Thailand is considering a new low-rate tax on certain gold transactions, potentially including imports, as authorities seek to curb money laundering and improve financial oversight. The Finance Ministry plans to consult with the Gold Traders Association. Any new tax could increase transaction costs and weigh on domestic gold activity.
- Gold Fields faces uncertainty over the renewal of its Tarkwa mining leases in Ghana. The company said it will not “just roll over” in negotiations with Ghana’s government over leases set to expire in April. Bloomberg previously reported that the government may consider transferring the leases to local parties, creating uncertainty over Gold Fields’ continued control of the mine.
- Illegal gold mining is surging in Peru as record prices fuel illicit activity. Illegal gold exports reached an estimated $11.5B in 2025, up 55% from the prior year and more than six times the level a decade ago. The expansion poses growing environmental, regulatory and supply-chain risks for Peru’s formal gold industry, according to Bloomberg.
U.S. Global Investors, Inc. is an investment adviser registered with the Securities and Exchange Commission (“SEC”). This does not mean that we are sponsored, recommended, or approved by the SEC, or that our abilities or qualifications in any respect have been passed upon by the SEC or any officer of the SEC.
This commentary should not be considered a solicitation or offering of any investment product. Certain materials in this commentary may contain dated information. The information provided was current at the time of publication. Some links above may be directed to third-party websites. U.S. Global Investors does not endorse all information supplied by these websites and is not responsible for their content. All opinions expressed and data provided are subject to change without notice. Some of these opinions may not be appropriate to every investor.
Holdings may change daily. Holdings are reported as of the most recent quarter-end. The following securities mentioned in the article were held by one or more accounts managed by U.S. Global Investors as of (06/30/2026):
AngloGold Ashanti
Pan African Resources
Gold Fields
Sibanye Stillwater
Agnico Eagle Mines
Radisson Mining Resources
United Airlines
Crowdstrike Holdings
Nvidia
Boeing
Air France-KLM
Ferrari
Pernod Ricard
Valero
*The above-mentioned indices are not total returns. These returns reflect simple appreciation only and do not reflect dividend reinvestment.
The Dow Jones Industrial Average is a price-weighted average of 30 blue chip stocks that are generally leaders in their industry. The S&P 500 Stock Index is a widely recognized capitalization-weighted index of 500 common stock prices in U.S. companies. The Nasdaq Composite Index is a capitalization-weighted index of all Nasdaq National Market and SmallCap stocks. The Russell 2000 Index® is a U.S. equity index measuring the performance of the 2,000 smallest companies in the Russell 3000®, a widely recognized small-cap index.
The Hang Seng Composite Index is a market capitalization-weighted index that comprises the top 200 companies listed on Stock Exchange of Hong Kong, based on average market cap for the 12 months. The Taiwan Stock Exchange Index is a capitalization-weighted index of all listed common shares traded on the Taiwan Stock Exchange. The Korea Stock Price Index is a capitalization-weighted index of all common shares and preferred shares on the Korean Stock Exchanges.
The Philadelphia Stock Exchange Gold and Silver Index (XAU) is a capitalization-weighted index that includes the leading companies involved in the mining of gold and silver. The U.S. Trade Weighted Dollar Index provides a general indication of the international value of the U.S. dollar. The S&P/TSX Canadian Gold Capped Sector Index is a modified capitalization-weighted index, whose equity weights are capped 25 percent and index constituents are derived from a subset stock pool of S&P/TSX Composite Index stocks. The NYSE Arca Gold Miners Index is a modified market capitalization weighted index comprised of publicly traded companies involved primarily in the mining for gold and silver. The S&P/TSX Venture Composite Index is a broad market indicator for the Canadian venture capital market. The index is market capitalization weighted and, at its inception, included 531 companies. A quarterly revision process is used to remove companies that comprise less than 0.05% of the weight of the index, and add companies whose weight, when included, will be greater than 0.05% of the index.
The S&P 500 Energy Index is a capitalization-weighted index that tracks the companies in the energy sector as a subset of the S&P 500. The S&P 500 Materials Index is a capitalization-weighted index that tracks the companies in the material sector as a subset of the S&P 500. The S&P 500 Financials Index is a capitalization-weighted index. The index was developed with a base level of 10 for the 1941-43 base period. The S&P 500 Industrials Index is a Materials Index is a capitalization-weighted index that tracks the companies in the industrial sector as a subset of the S&P 500. The S&P 500 Consumer Discretionary Index is a capitalization-weighted index that tracks the companies in the consumer discretionary sector as a subset of the S&P 500. The S&P 500 Information Technology Index is a capitalization-weighted index that tracks the companies in the information technology sector as a subset of the S&P 500. The S&P 500 Consumer Staples Index is a Materials Index is a capitalization-weighted index that tracks the companies in the consumer staples sector as a subset of the S&P 500. The S&P 500 Utilities Index is a capitalization-weighted index that tracks the companies in the utilities sector as a subset of the S&P 500. The S&P 500 Healthcare Index is a capitalization-weighted index that tracks the companies in the healthcare sector as a subset of the S&P 500. The S&P 500 Telecom Index is a Materials Index is a capitalization-weighted index that tracks the companies in the telecom sector as a subset of the S&P 500.
The Consumer Price Index (CPI) is one of the most widely recognized price measures for tracking the price of a market basket of goods and services purchased by individuals. The weights of components are based on consumer spending patterns. The Purchasing Manager’s Index is an indicator of the economic health of the manufacturing sector. The PMI index is based on five major indicators: new orders, inventory levels, production, supplier deliveries and the employment environment. Gross domestic product (GDP) is the monetary value of all the finished goods and services produced within a country’s borders in a specific time period, though GDP is usually calculated on an annual basis. It includes all private and public consumption, government outlays, investments and exports less imports that occur within a defined territory.
The S&P Global Luxury Index is comprised of 80 of the largest publicly traded companies engaged in the production or distribution of luxury goods or the provision of luxury services that meet specific investibility requirements.
The FHFA House Price Index is a public economic tool that tracks average price changes for single-family homes in the United States.
The NAHB/Wells Fargo Housing Market Index (HMI) is a monthly survey that measures the confidence and sentiment of single-family home builders regarding market conditions.
The S&P Homebuilders Select Industry Index is a stock market benchmark that tracks the performance of publicly traded companies involved in homebuilding and related housing industries in the United States.
The Producer Price Index (PPI) measures the average change over time in the selling prices received by domestic producers for their output.
Membership required
Membership is now required to use this feature. To learn more:
View Membership Benefits