Many market participants have highlighted how value investing is back as the equity market rally broadened out beyond high-flying growth names. However, taking an index-based approach to the value style requires looking under the hood. Not all value ETFs are created equally.
Key Takeaways
A Tale of Two Benchmarks: Performance Divergence in Large-Cap Value
Consider the $83 billion iShares Russell 1000 Value ETF (IWD) and the $37 billion SPDR Portfolio S&P 500 Value ETF (SPYV). While both target large-cap U.S. value equities, their 2026 performance has diverged significantly. As of September 10, IWD was up 21% year-to-date. Meanwhile, SPYV gained only 11% over the same period. For perspective, the S&P 500 and the Russell 1000 parent indexes were up 11-12% for the year.
What explains this roughly 1,100-basis-point performance gap between the value ETFs? The answer comes down to index construction and specific criteria for inclusion.
FTSE Russell uses price-to-book ratios alongside medium-term growth forecasts to select value constituents for IWD, while S&P Dow Jones Indices evaluates book value, earnings-to-price, and sales-to-price ratios for SPYV.
Sector Exposure vs. Stock-Level Reality
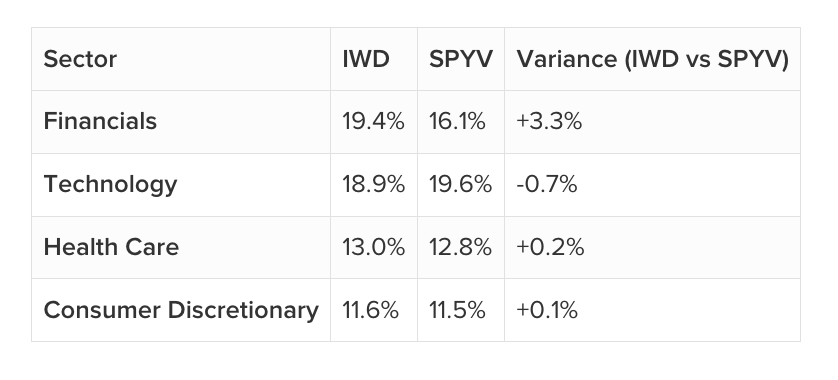
At first glance, a sector-level breakdown suggests both funds are similar. Financials dominate both portfolios at 19.4% for IWD and 16.1% for SPYV, followed closely by Technology at 18.9% and 19.6%, respectively. Health Care and Consumer Discretionary also show nearly identical top-level sector allocations.
Yet, focusing solely on sectors misses the crucial nuance: it matters which individual stocks are inside. In addition, how much do the funds own certain stocks.
-
Tesla (TSLA): TSLA appears as a top 10 holding in SPYV at 1.32%, but it is completely absent from IWD.
-
Visa (V): Visa earns a top 20 spot in SPYV, yet finds no place in IWD’s portfolio.
-
JPMorgan Chase (JPM): Both funds carry exposure to the banking giant, but IWD gives JPM a top 5 weighting at 2.6%, compared to a smaller 1.0% weight in SPYV.
-
Growth Giant Weightings: While many think of Apple (AAPL) and Amazon (AMZN) as growth stocks, they are in both value funds, IWD allocates 6.0% to Amazon compared to SPYV’s 3.9%. Conversely, SPYV leans heavier into Apple at 7.8% versus IWD’s 5.6%.
Indeed, the two ETFs share only a 70% overlap according to VettaFi. What’s inside has driven the difference in 2026
An Alternative Value Approach: Fundamental Screening
Beyond traditional market-cap-weighted value indexes, investors often consider alternative strategies. The Schwab Fundamental U.S. Large Company Index ETF (FNDX) uses fundamental metrics—such as adjusted sales, operating cash flow, and leverage-adjusted distributions—to select and size holdings. Unlike IWD and SPYV, the $28 billion FNDX rebalances rather than just reconstituting.
FNDX is also another value ETF performing better than SPYV this year, delivering a 19% gain as of September 10. The Schwab ETF has a 67% overlap with IWD and 64% with SPYV, as it distributes single-stock weightings far more evenly. Top holdings feature Apple (4.5%), Microsoft (2.8%), and ExxonMobil (2.5%), while tilting slightly heavier toward Energy (11%). Some investors see it as a compliment to their market-cap weighted approach.
When choosing a value allocation, advisors cannot rely on the name alone. Rather by popping the hood to understand index rules and stock-level weightings is essential.
Originally posted on ETF Trends
For more news, information, and analysis, visit VettaFi | ETF Trends.
VettaFi LLC (“VettaFi”) is the index provider for FNDX, for which it receives an index licensing fee. However, FNDXis not issued, sponsored, endorsed, or sold by VettaFi, and VettaFi has no obligation or liability in connection with the issuance, administration, marketing, or trading of FNDX.
A message from Advisor Perspectives and VettaFi: Discover something new! Click here to register for our upcoming webcasts.
More ETF Topics >