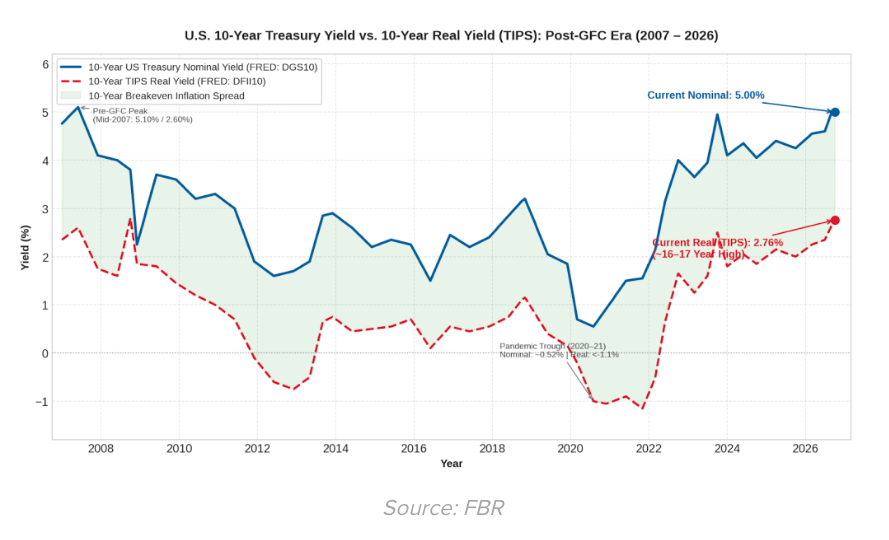
The bond market is flashing levels not seen in nearly two decades. The 10-year Treasury yield is hovering near 5%, while real yields — measured by Treasury inflation-protected securities (TIPS) — are at their highest since before the 2008 financial crisis. Resilient growth, persistent inflation concerns, and heavy debt issuance have led futures markets to price in a mild tightening cycle of roughly two to four additional rate hikes through 2027.
Key Takeaways
- Macro Risks Drive Bond Demand: AI concerns, earnings doubts, and Middle East tensions revive bonds as a safe-haven portfolio hedge.
- Peak Rates Offer Opportunity: With yields near decade highs and rate hikes priced in, intermediate duration offers attractive total returns.
- Flows Shift: Allocators moved more than $45 billion into intermediate funds (BND, VCIT) and directed ~40% of net inflows to active ETFs.
In other words, much of the Federal Reserve’s path may already be reflected in today’s yields.
Meanwhile, equity markets have been on shaky footing, rattled by doubts over AI returns, earnings sustainability, and geopolitical strain. But during last week’s sell-off, fixed income delivered a welcome change of pace — functioning as a portfolio hedge. As Treasury yields eased, bonds cushioned the blow and revived the classic negative stock/bond correlation that asset allocators had long been missing.
For ETF investors who have stayed parked in short-term cash proxies, this begs the question: Is it time to scale into intermediate bonds to lock in these near multidecade yields before they fall?
The Ultrashort Bond Obsession
Parking money at the front end has paid off over the past two years, making ultrashort bond funds and Treasury bill ETFs the undisputed flow darlings of 2026. The catch? Cash yields are only as durable as the Fed’s current stance. Once policy turns, T-bill yields reset lower at the next rollover, leaving investors with no locked-in yield or price gains to cushion the drop.
Steve Laipply, global co-head of iShares Fixed Income ETFs, told me moving beyond bills means trading modest duration risk for higher income and total return upside.
“The move from T-bills to 2-year notes offers about 70 basis points of additional yield, while extending to the 10-year point adds roughly another 30 basis points,” he said. “If longer-term yields fall substantially, longer-duration bonds benefit both from having locked in higher yields and from price gains.”
He offered an example: “With a duration of roughly 7.7, a 10-year Treasury yielding around 5% could see approximately 7.7% of price appreciation if yields fell to 4%.”
Because the first step out of cash captures 70% of the total yield pickup with far less rate risk than a full move to 10 years, investors are favoring the middle of the curve over the long end.
ETF Flow Signals: Where the Money Is Moving
Flow data shows investors stepping out of cash in stages, with the strongest demand in the middle of the curve.
The belly of the curve. Net redemptions in front-end 2026 defined-maturity funds have coincided with inflows into intermediate buckets, with 2028 and 2030 maturity funds adding about $5 billion and $4 billion, respectively. Meanwhile, the Vanguard Intermediate-Term Corporate Bond ETF (VCIT) has drawn more than $12 billion year-to-date, a sign that investors are willing to take on some credit risk in exchange for a higher yield baseline.
Core bond exposure. Ultrashort funds still lead on raw volume, but broad aggregate funds are drawing serious money. The Vanguard Total Bond Market ETF (BND) has pulled in more than $26 billion year-to-date, and the iShares Core Total USD Bond Market ETF (IUSB) has drawn more than $16 billion. Combined with VCIT, that’s roughly $54 billion — surpassing the nearly $48 billion the iShares 0-3 Month Treasury Bond ETF (SGOV) has taken in on its own.
The long end. Demand here remains opportunistic, showing up when yields spike. The iShares 20+ Year Treasury Bond ETF (TLT) took in more than $1.4 billion in a single week in late August, as investors eagerly sought to buy the dip.
Outsourcing the call. For those unsure how far out the curve to go, active funds let a fund manager decide. Active fixed income ETFs now capture almost 40% of net bond ETF inflows, with consistently strong interest in floating-rate funds like the Janus Henderson AAA CLO ETF (JAAA) and the PGIM AAA CLO ETF (PAAA), along with multisector strategies like the PIMCO Multisector Bond Active ETF (PYLD).
Managing Reentry Risks
Of course, duration cuts both ways. Inflation, oil prices and heavy Treasury issuance could all push yields higher before they fall. Consequently, a phased approach — such as dollar-cost averaging, building a bond ladder, or anchoring in intermediate maturities before adding longer duration — remains the most prudent strategy.
Cash still plays a key role in liquidity management, but holding excess dry powder at the front end carries a rising opportunity cost. With peak rates largely priced in, the question for sidelined investors is less whether to own duration, but how much — and how gradually.
For more news information and analysis, visit the Equity ETF Content Hub.
Originally posted on ETF Trends
A message from Advisor Perspectives and VettaFi: Discover something new! Click here to register for our upcoming webcasts.
Read more commentaries by VettaFi