Value Traps Are Painful ... Read the Footnotes
Membership required
Membership is now required to use this feature. To learn more:
View Membership Benefits
Key Points
-
Mr. Market may be moody, but he is not always wrong. Benjamin Graham’s famous metaphor emphasizes that a low price may signal an opportunity or a warning sign. Distinguishing bargains from value traps requires looking beyond traditional valuation ratios.
-
Syzygy’s systematic active equity process converts value, quality, and momentum signals into stock positions and weights that often diverge from the Russell 1000 Value Index.
-
Paired stock case studies – Marathon Petroleum and Valero Energy, Seagate Technology and Lam Research, Berkshire Hathaway and JPMorgan Chase, and Accenture and Salesforce – illustrate how benchmark overweights, investments outside the index, deliberate exclusions, and benchmark underweights can influence portfolio performance.
-
Contradictory signals call for assessment, not automatic decisions. By weighing competing criteria, the model can help distinguish when prices reflect Mr. Market’s moods or information that investors may have missed.
Benjamin Graham, the godfather of value investing, gave us an enduring friend: Mr. Market. This mercurial business partner offers to buy our shares or sell us his at ever-changing prices. His enthusiasm can be infectious; his despair extravagant. Graham’s advice was simple: consider Mr. Market’s prices without sharing his moods. Graham also gave us a yardstick for judging those prices. He called it intrinsic value. Today we call it fair value. It is the value justified by the facts about a business: quality, growth prospects, intangible assets, and the latest news, rather than a single ratio from last year’s annual report.
Value investors love Mr. Market. When he panics, we buy. When he’s euphoric, we sell. His emotional excesses become our opportunities. Naive value strategies push the story one step further. When a simple ratio, such as price to book, is low, they assume Mr. Market must be wrong.
Graham never made that assumption. In his telling, Mr. Market is moody, but he is nobody’s fool: “Sometimes his idea of value appears plausible and justified by business developments and prospects as you know them.”1 His moods do not relieve us of the responsibility of doing our homework. After all, what if he is right? Before we congratulate ourselves on being smarter than Mr. Market, we might ask whether he knows something we don’t. Sometimes he has read the footnotes.
Before we congratulate ourselves on being smarter than Mr. Market, we might ask whether he knows something we don’t.
A stock trading at half its former price is not necessarily a bargain. Perhaps its earnings power has halved or its balance sheet can no longer support the business. Maybe its generous dividend is being financed with borrowed money. A low valuation ratio tells us what we are paying relative to one measure of fundamentals. It does not, by itself, tell us what the business is worth or whether those fundamentals will endure.
See more: Tuning Up Your Growth Engine
Our task, then, is to distinguish an unwarranted markdown from a well-founded warning. Can the business service its debt? Does it earn a decent return on the capital it invests? And if a stock’s price keeps falling, is the market overreacting, or is there more bad news in the pipeline? Conviction is useful. Confusing it with stubbornness can be expensive.
Conviction is useful. Confusing it with stubbornness can be expensive.
A good year for value puts these questions in an interesting light. Year to date (YTD) through September 30, 2026, the Russell 1000 Value Index rose 19.27% compared to 6.30% for the Russell 1000 Growth Index. A favorable environment did not lift every value fund equally. Citywire’s September review of Large Value funds reported YTD gains of 26% to 48% for its listed leaders, while its laggards ranged from a 2% loss to a 4% gain.2 Same wind, very different voyages
Graham did this analysis one company at a time, with a pencil and an annual report. Today we apply his wisdom systematically, across an entire market. Syzygy’s active equity process uses three complementary signals: value, quality, and momentum.3 Value asks what we are paying relative to company fundamentals. Quality asks how strong the business is, including its profitability and balance sheet. Momentum adds information from recent price trends.
A stock can look compelling on valuation and far less attractive on the other two. Think of the three as a way to catch up with Mr. Market: Value tells us his mood, quality what knowledge may change his mood, and momentum what he is still learning. Momentum often reflects news that has not yet reached the financial statements: It can counsel patience with a stock that keeps falling, or discourage a premature exit from one whose recovery is still unfolding. Only then can we judge whether a low price reflects his knowledge or his mood.
Cheapness is where the inquiry begins, not where it ends. Syzygy’s U.S. Active Equity Model Portfolio evaluates U.S. large-cap equities using value, quality, and momentum signals. It converts these integrated assessments into holdings and weights while accounting for diversification, liquidity, and trading costs. We then demonstrate this approach through four pairs of stocks, exploring how the signals informed portfolio positions and how those positions contributed to returns.
Beyond the Value Label
Exhibit 1 compares the U.S. Active Equity Model Portfolio with the Russell 1000 Value Index over different time horizons.4 Over the 10 years ended September 30, 2026, the portfolio 14.7% in annualized returns compared to 11.4% for the Russell 1000 Value Index. YTD through September 30, 2026, it outperformed the benchmark 33.5% to 19.3%. In other words, this is not merely a story about one good year for value.
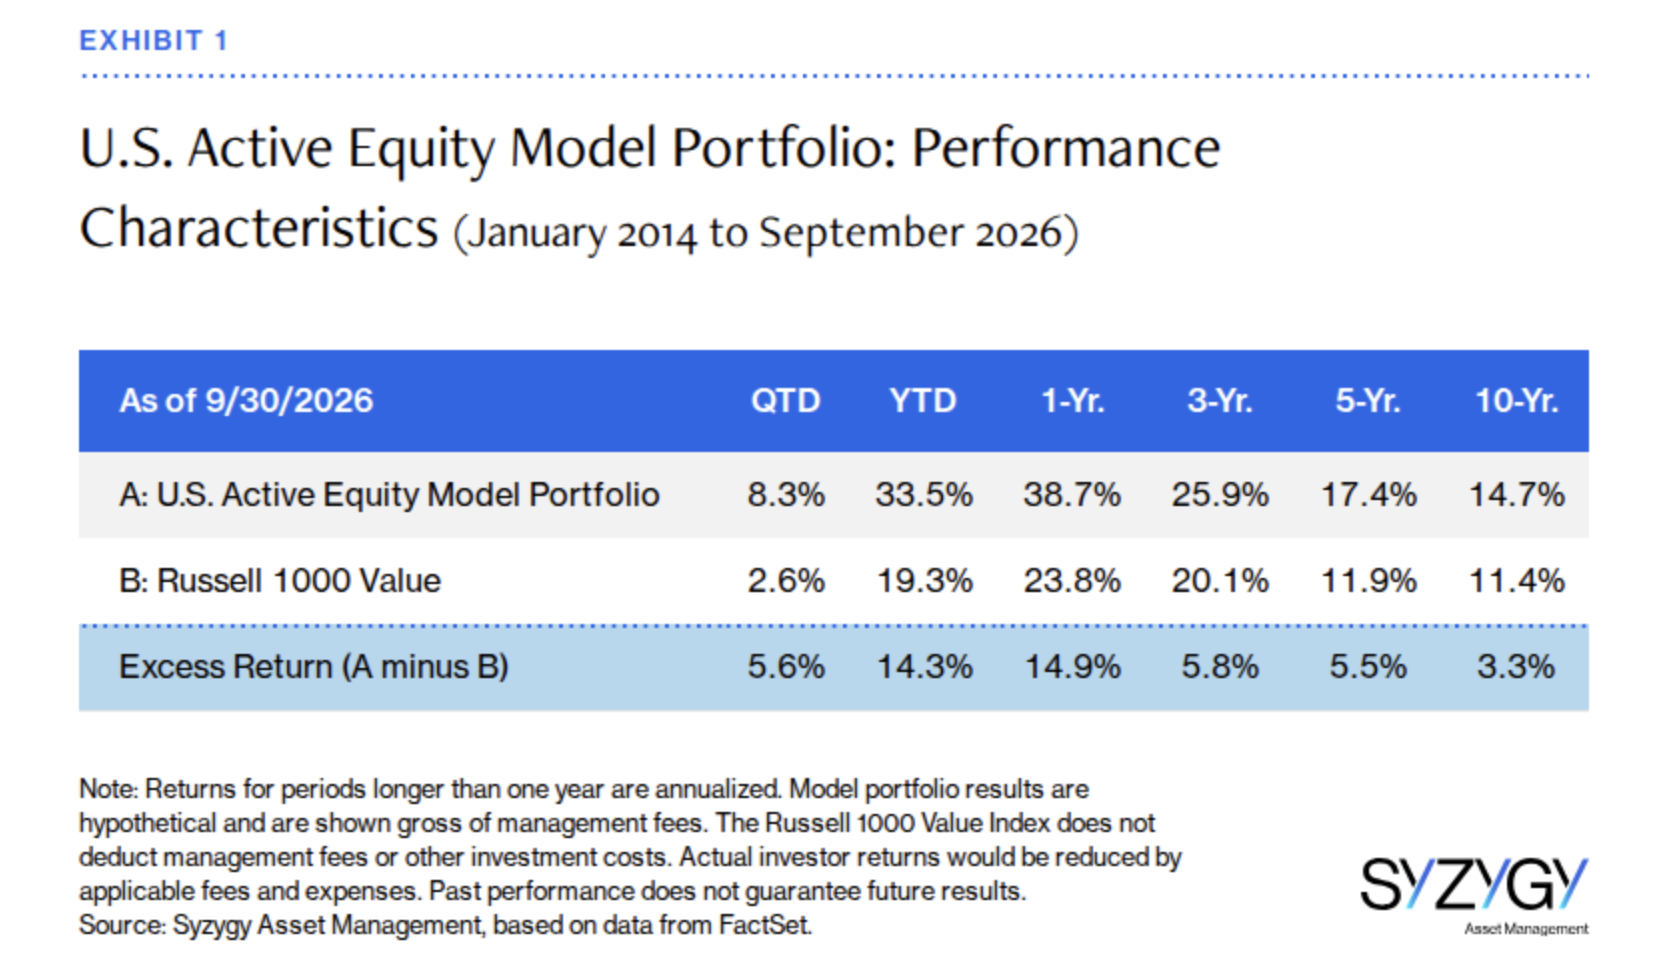
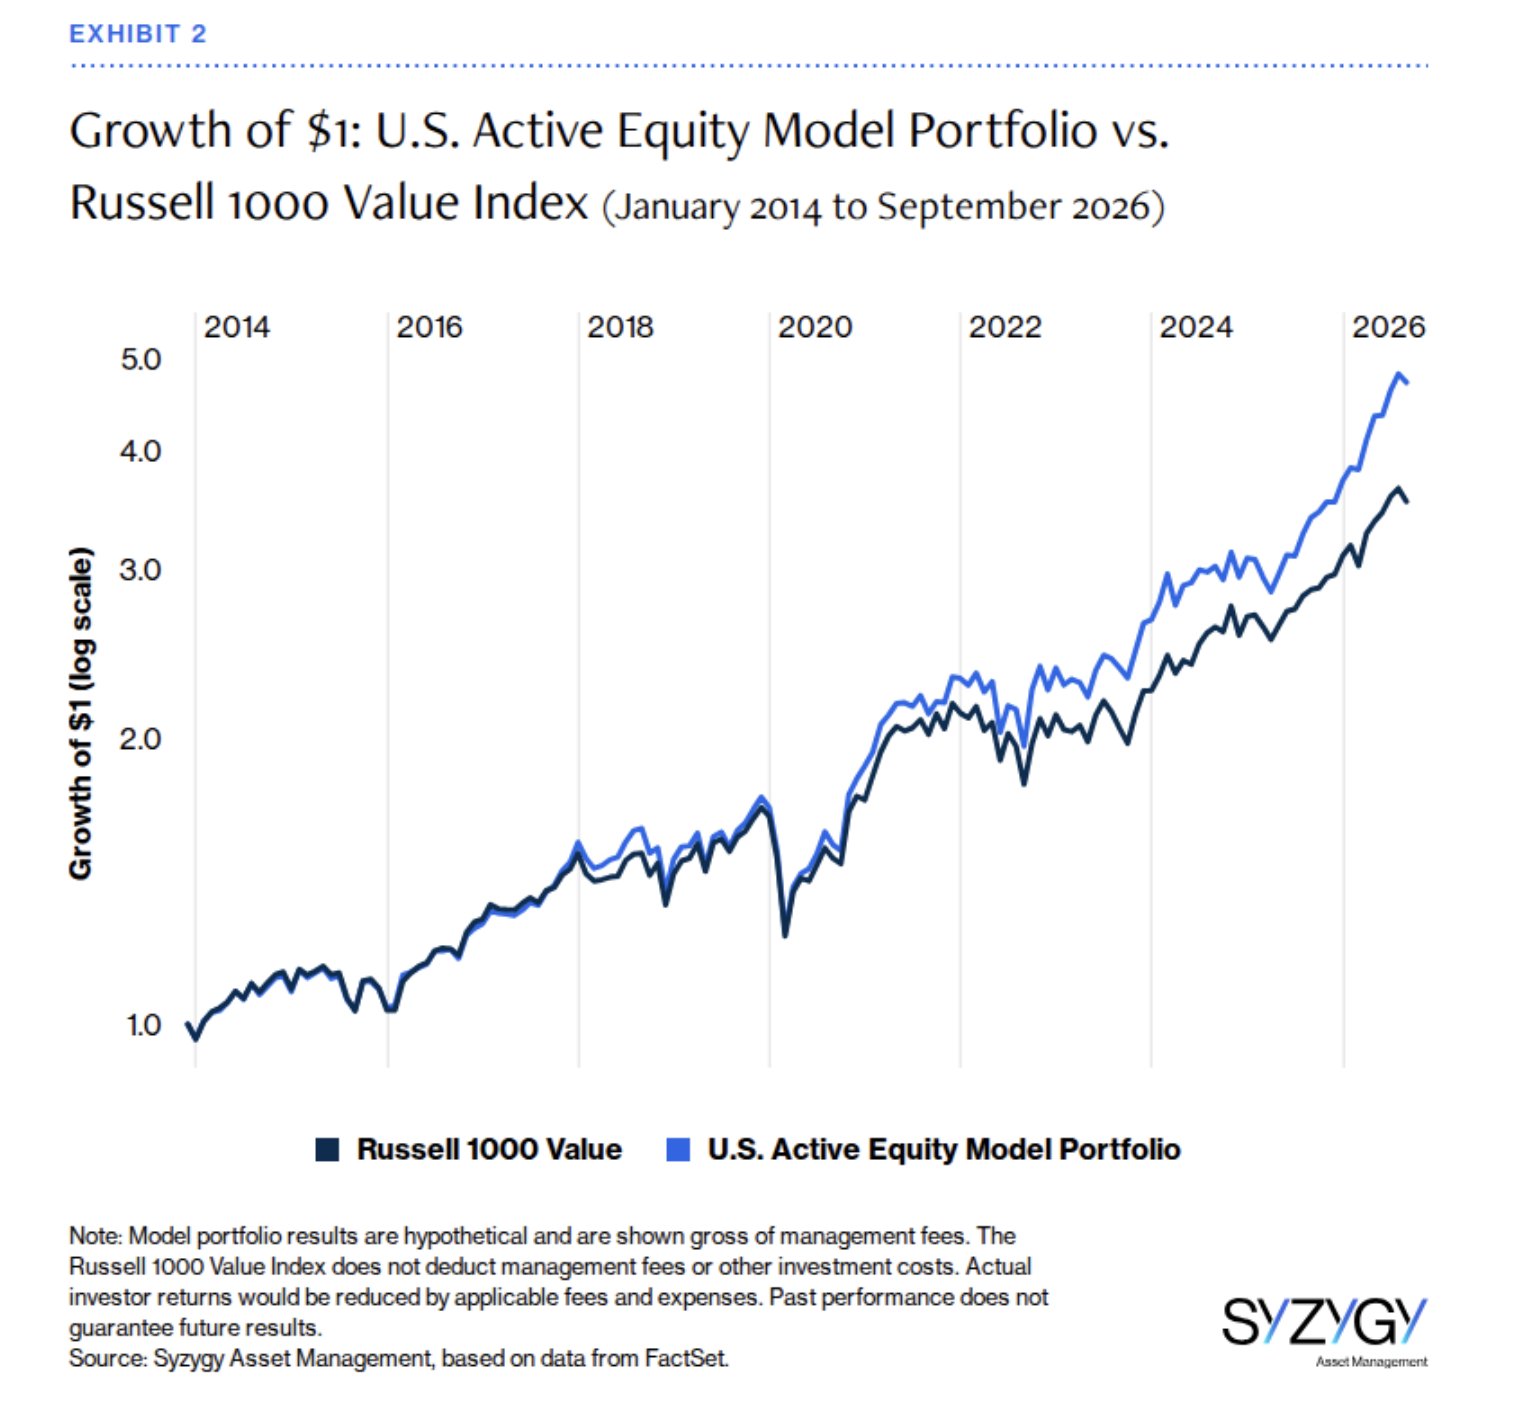
Exhibit 2 shows the growth of a $1 investment in the model portfolio and the Russell 1000 Value Index. After tracking the benchmark closely for several years, our model portfolio widened its lead. By September 2026, the initial $1 had grown to roughly $4.70 compared to $3.50 for the benchmark. That is compounding at work: Two seemingly parallel paths diverge and end up in very different places.
Cheap on the Cover? What’s in the Footnotes?
Our four pairs of stocks provide a more nuanced portrait. Each represents a divergence from the Russell 1000 Value Index: owning more or less of the same stock, investing outside the benchmark, or excluding some benchmark stocks altogether.
For each pair, we compare valuations on December 31, 2025, with model’s signal rankings at January 31, 2026.5 The rankings illustrate the assessments used in portfolio construction. Average weights and return attribution capture positioning and its effects over January 1 to September 30, 2026. The examples were, of course, selected with the benefit of hindsight. We do not pretend to know the winners in advance.
Same Names, Different Conviction
Finding a bargain is one thing. Owning enough of it to make a difference is another. Marathon Petroleum and Valero Energy, two of the largest U.S. oil refiners, were held by both the model portfolio and the Russell 1000 Value Index. Both companies turn crude oil into gasoline, diesel, and jet fuel. But huge sales may not translate into huge profits. What matters is what is left after buying and processing the crude. That margin swings with the cycle.
Finding a bargain is one thing. Owning enough of it to make a difference is another.
Consider the mixed picture in Exhibit 3, Panel A. Marathon traded at 12.3x earnings, comfortably below the Russell 1000 Value Index’s 21.0x. Valero, at 21.5x earnings, hardly announced itself as a bargain, although both stocks traded below the broader Russell 1000 Index’s 27.3x. On P/E alone, Marathon looked more inviting than Valero based on P/E, but both offered lower sales and book value multiples and higher dividend yields than either index.
So which price tag should we trust? Refiners keep only a small portion of each sales dollar as profit, so a low price-to-sales multiple may be less impressive than it first appears. Since earnings fluctuate based on the gap between crude costs and fuel prices, a low P/E can make a stock appear cheap when profits are robust while a high one may make it seem expensive when profits are depressed
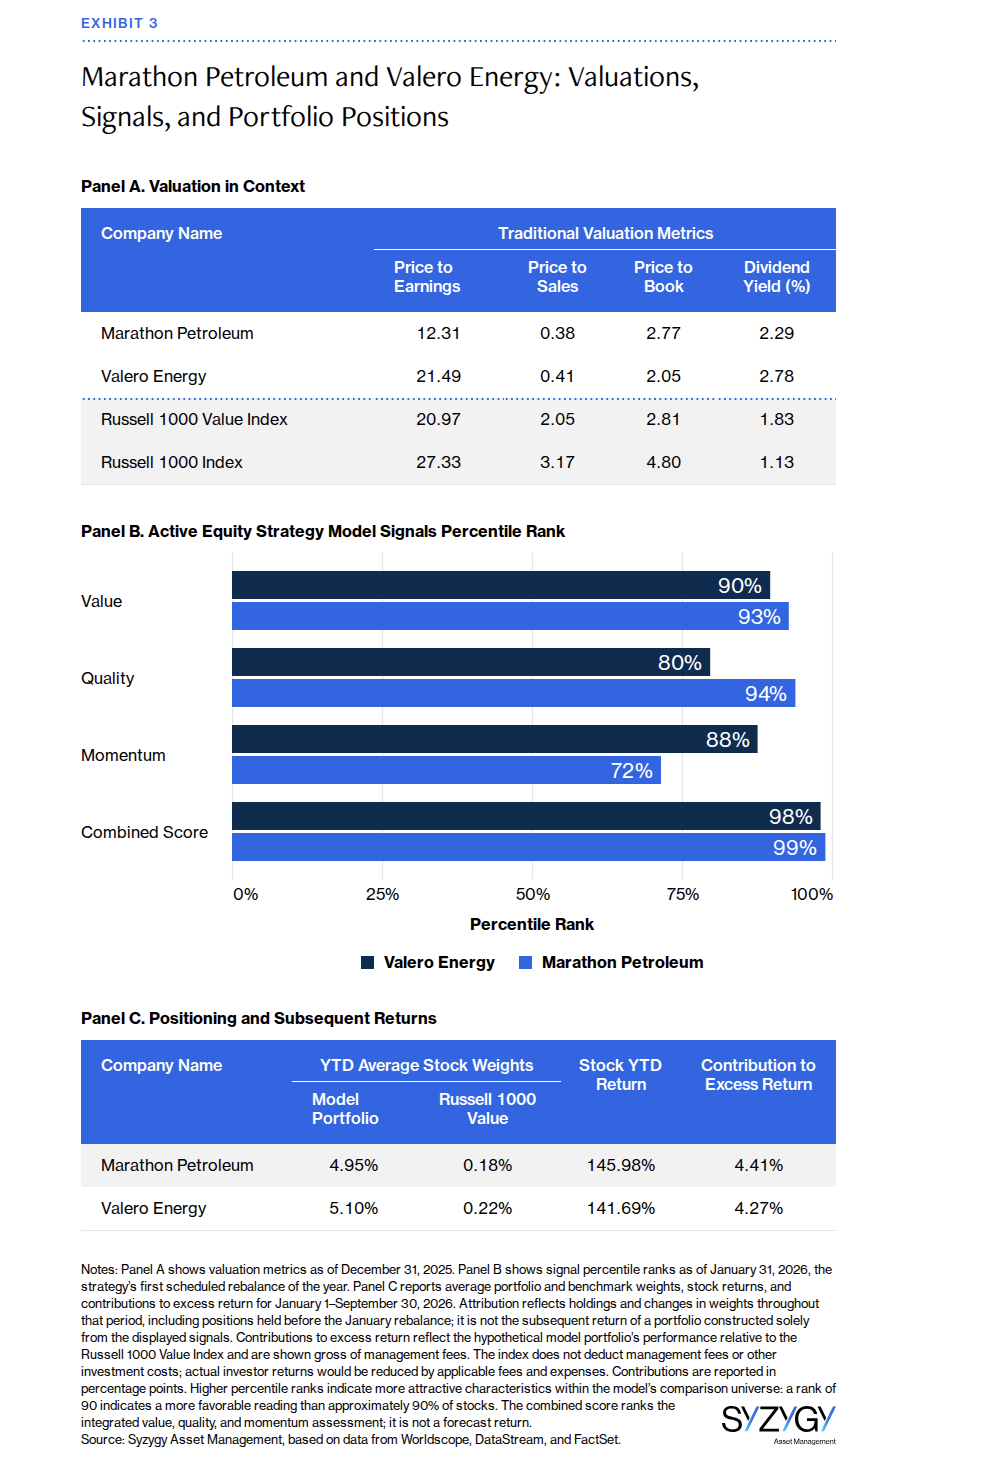
Syzygy’s process looks beyond the price tag. Exhibit 3, Panel B, shows Marathon and Valero ranked at the 93rd and 90th percentiles on value, respectively. Marathon had the stronger quality rank, but Valero led on momentum. On the combined score, the signals placed Marathon at the 99th and Valero at the 98th percentiles.
YTD to September 30, 2026, Marathon had a 4.95% average weight in the model portfolio but just 0.18% in the benchmark. Valero’s was 5.10% versus 0.22%. While the benchmark owned both stocks, the model portfolio owned enough for their fortunes to matter.
And matter they did. Unexpected disruptions to global fuel supplies provided a powerful tailwind for refiners.6 Marathon’s stock gained 146% and Valero’s 142%, contributing 4.41 and 4.27 percentage points, respectively, to the model portfolio’s excess return.
A low multiple may catch our eye, but earning our conviction takes more than that, particularly when profits move with the refining cycle. For Marathon and Valero, favorable quality and momentum scores reinforced the valuation appeal, helping support much larger positions than the benchmark held. These stocks were not merely cheap. They were bargains.
Bargains Beyond the Benchmark
A value investor’s first instinct is to look for a low price. High multiples and a meager dividend yield hardly invite a closer look. But dismissing a stock on that basis can end the inquiry too soon. Graham’s intrinsic value reflects a company’s prospects, not just its past. The tech manufacturing companies Seagate Technology and Lam Research were not cheap based on the traditional metrics. Neither warranted inclusion in the Russell 1000 Value Index. Our model portfolio owned both. Why?
Let’s start with the price tags in Exhibit 4 Panel A. Seagate traded at 31.1x earnings and Lam at 35.1x, both the Russell 1000 Value Index’s 21.0x and the broader Russell 1000 Index’s 27.3x. Their multiples of sales and book value were also higher, and their dividend yields lower than either index. These were hardly clearance rack stocks, Seagate’s extraordinary 131 price-to-book ratio deserves particular attention. Years of buybacks and a huge 2023 loss had left very little book value to measure against, making the metric a much less useful guide to the business’s worth.
But those multiples were backward-looking while the company was moving forward. When cloud customers cut purchases of its data-storage drives, Seagate plummeted. By January 2026, however, demand had strengthened thanks to its new, more powerful drives. Profitability was on the upswing. Trailing P/E functions like a rearview mirror and can miss a business gathering speed.
Lam served a different part of the same investment cycle, supplying the equipment used to manufacture increasingly sophisticated microchips. Growing demand for the memory that powers artificial intelligence (AI) encouraged investment in production capacity. But Lam’s exposure to China and U.S. export restrictions stressed the need for caution even as business prospects were improving.
Mr. Market’s asking prices were steep. As Exhibit 4 Panel B shows, both companies had negative value scores, ranked at just the 4th percentile on value. Quality and momentum supplied reasons to keep looking. Seagate ranked at the 86th percentile on quality and Lam at the 71st, while both stood near the very top on momentum, with ranks rounding to 100%. The valuation signal registered the expense; the other signals strengthened the case for owning them. Together, they placed Seagate at the 89th percentile and Lam at the 80th on the combined score.
From January 1 to September 30, 2026, Seagate’s average portfolio weight was 0.70% versus Lam’s 2.13%. These averages reflect positions across the period, rather than allocations fixed at the January rebalance. The benchmark held neither. Seagate and Lam returned about 236% and 92%, respectively, and contributed 1.67 and 1.37 percentage points to the portfolio’s excess return.
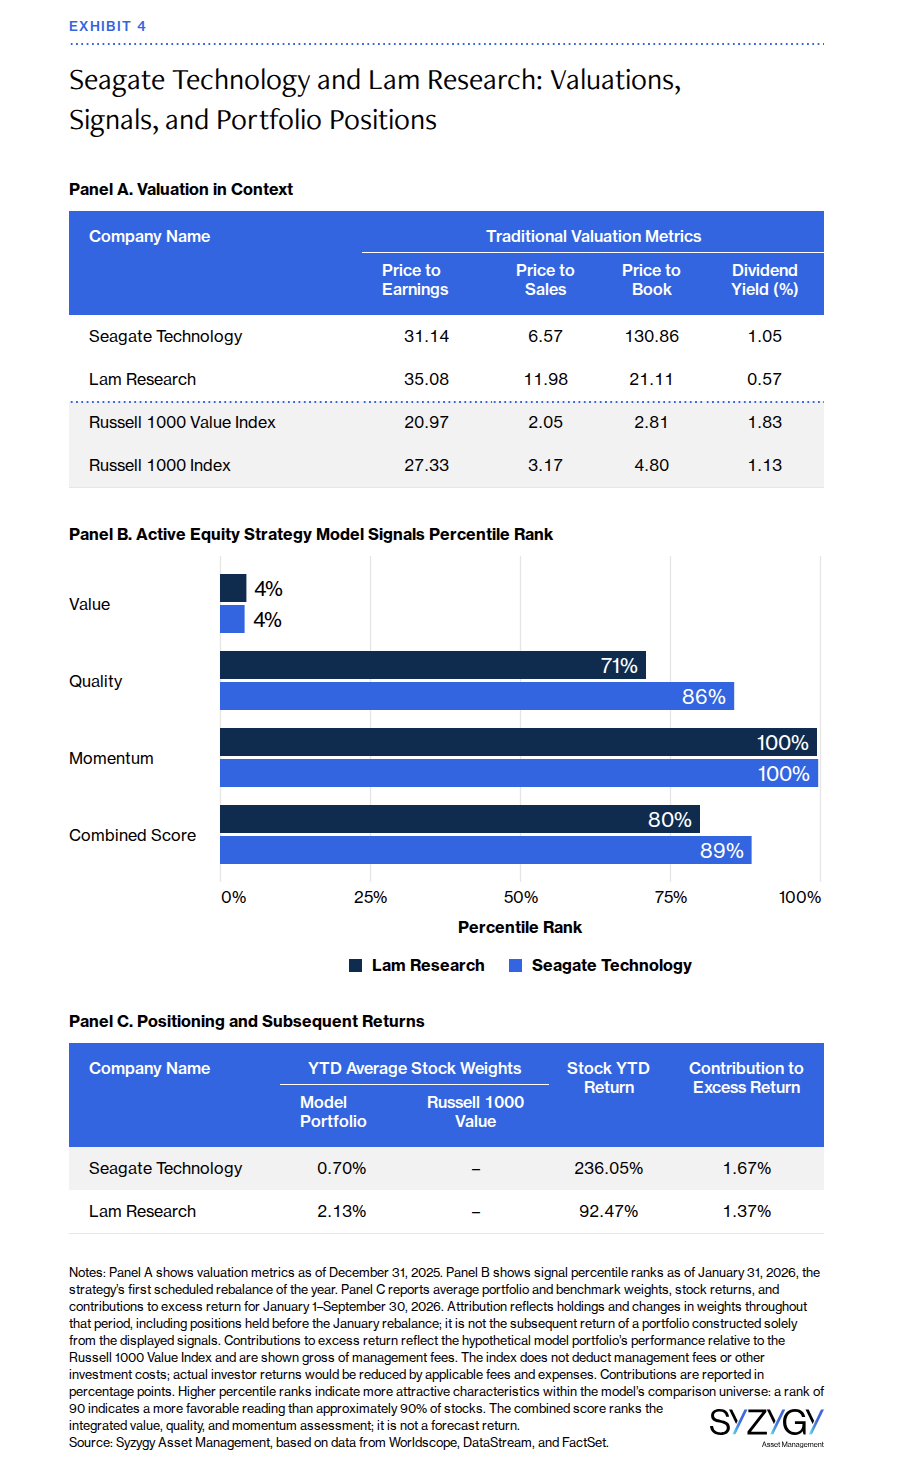
A low multiple can catch our eye. A high one need not end the conversation. For Seagate and Lam, unfavorable valuation scores were weighed alongside favorable quality and exceptionally strong momentum. Looking beyond cheapness gave the model reasons to own stocks the value benchmark did not hold—and participation when those positions paid off.
Famous Names, Different Verdict
Some investment decisions stand out because of what we buy. Others because of what we leave out. A familiar name and a seemingly reasonable price can make a stock comfortable to own. But in investing, what is comfortable is rarely profitable. Nor is a modest multiple proof of a bargain. Berkshire Hathaway and JPMorgan Chase were among the Russell 1000 Value Index’s largest holdings. Our model portfolio held neither.
Exhibit 5, Panel A, shows that both Berkshire and JPMorgan had P/E ratios and book value multiples well below those of the market and the benchmark traded at approximately 16.2x and 16.1x earnings, respectively below both the value benchmark’s 21.0x and the broad market’s 27.3x. Their book-value multiples were also lower than those of either index. Sales multiples gave a less flattering picture: both exceeded the value benchmark’s 2.05x, while Berkshire’s 2.92x was below the broad market’s 3.17x and JPMorgan’s 3.21x was slightly above it. JPMorgan’s 1.72% dividend yield likewise fell between the two indices; Berkshire paid no dividend. On earnings and book value, both looked inexpensive against either comparison. The other measures made their valuation pictures less clear-cut.
Berkshire’s reported profits included changes in the market value of its equity investments, which can obscure the performance of its operating businesses. JPMorgan raised different questions. Its earnings had neared a cyclical peak. In January, management guided 2026 expenses up to roughly $105 billion. Days earlier, President Donald Trump proposed a 10% cap on credit card interest rates, a direct shot at one of the bank’s most profitable businesses. The stock slipped. Is JPMorgan a great franchise? Absolutely. A clearance item? Not obviously.
Exhibit 5, Panel B, shows Berkshire and JPMorgan had modest value rankings. Lower earnings and book value multiples did not differentiate them either.
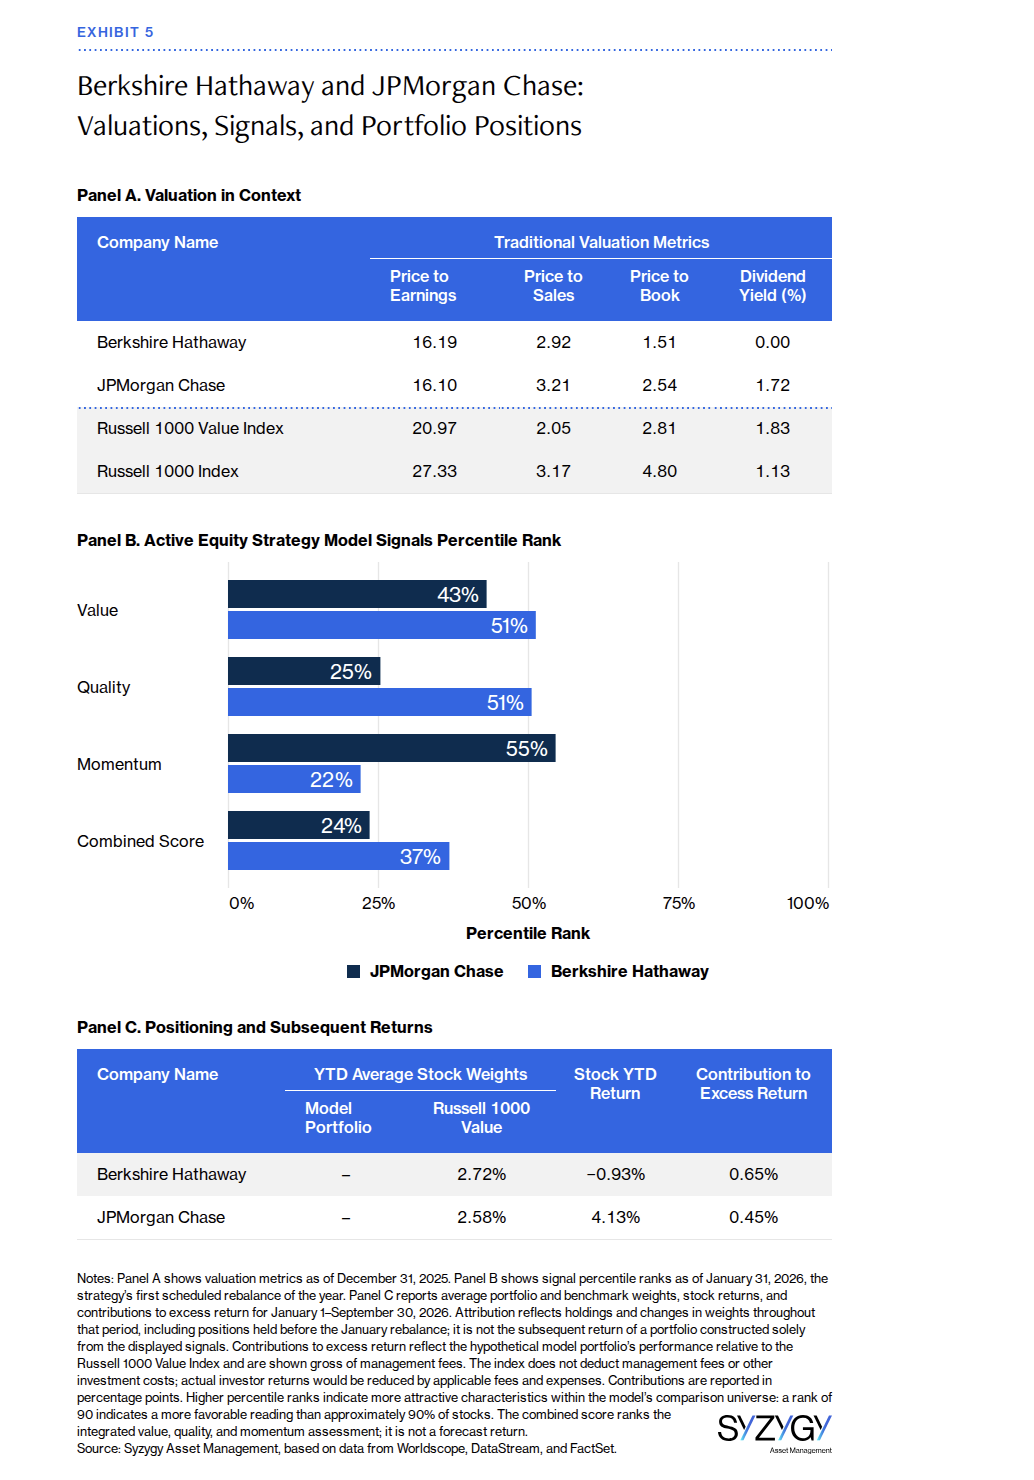
The other signals did little to strengthen the case. Berkshire ranked at the 51st percentile on quality, but just the 22nd on momentum. JPMorgan’s momentum rank was slightly above the midpoint at the 55th percentile, while its quality rank was only the 25th. These are relative assessments under the model’s definitions, not sweeping verdicts on either business. Together, the signals placed Berkshire at the 37th percentile and JPMorgan at the 24th on the combined score.7 Familiar names with modest multiples were worth a look, but they were not worth buying.
Over our sample period, Berkshire averaged a 2.72% portfolio weight in the benchmark and JPMorgan 2.58%. Neither held a position in the model portfolio.
That caution has been vindicated thus far in 2026. Through September 30, Berkshire fell 0.93% while JPMorgan gained 4.13%. The value benchmark returned 19.27%. By avoiding these stocks, the model portfolio added 1.10 percentage points in excess return.
A lower multiple can make a stock worth examining. It does not oblige us to buy. For Berkshire and JPMorgan, the wider value signal was less favorable than the headline ratios suggested, and quality and momentum provided little additional encouragement. Looking beyond the familiar price tags helped the model remain selective, even when the names were anything but obscure.
A Smaller Vote of Confidence
An attractive valuation can give us a reason to buy. It does not necessarily give us a reason to hurry. Is the opportunity improving or is the market still marking down the stock’s prospects? Accenture and Salesforce illustrate how that tension can influence portfolio positioning.
Exhibit 6, Panel A, shows signals were mixed. Based on their multiples, Salesforce and Accenture were not strong buys. But both have business strengths that are not fully captured on the balance sheet: For Accenture, its human resources and client relationships; for Salesforce, its software and customer base. The latter appeared well priced, the former not so much.
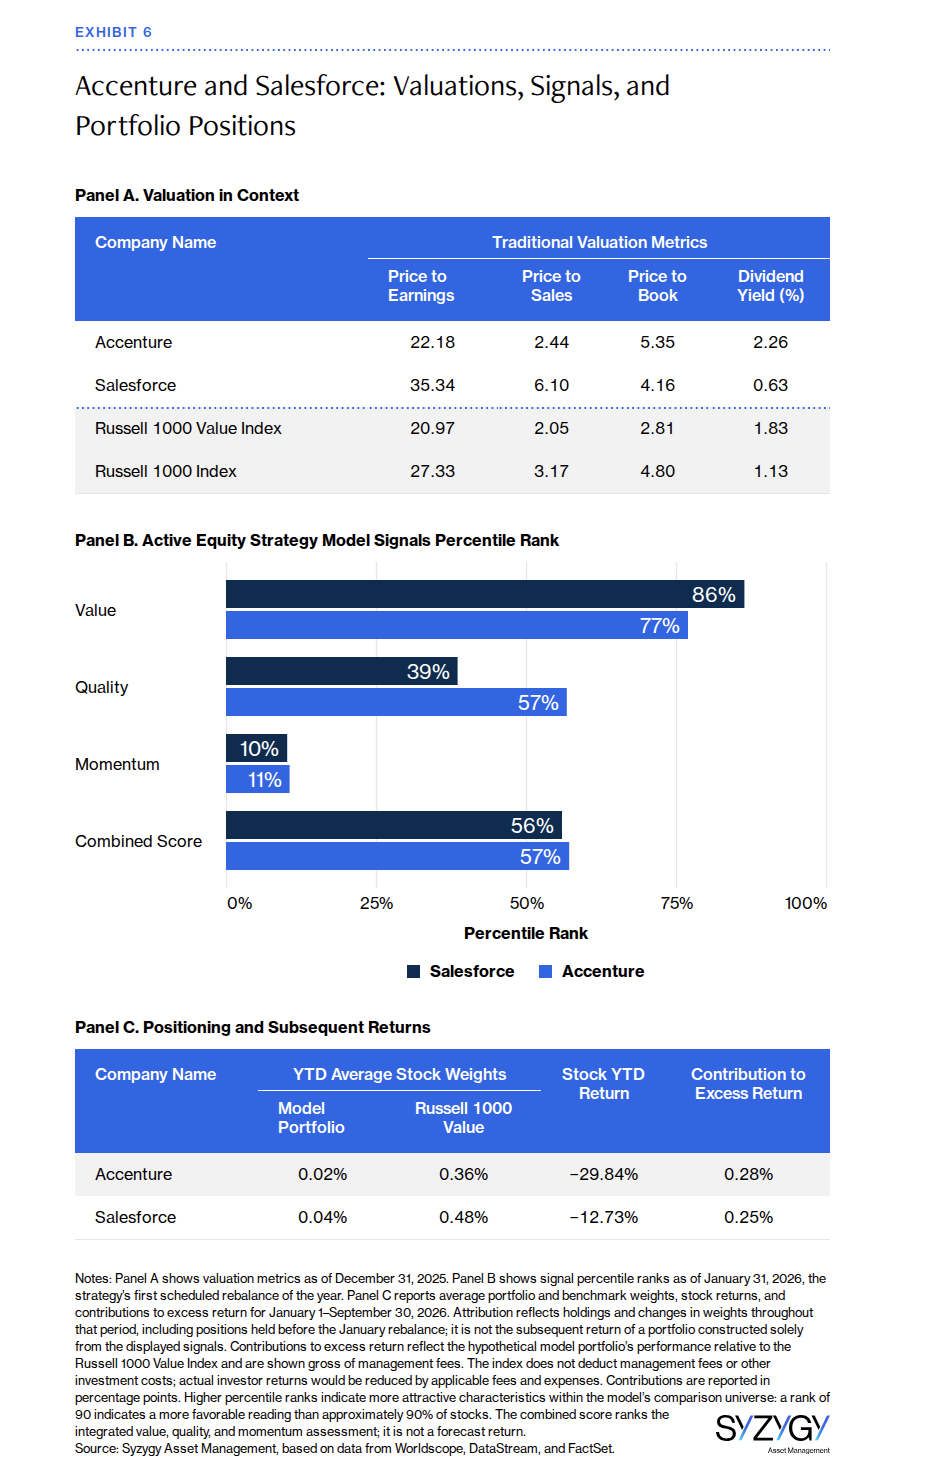
The model’s combined value signal was more bullish. Exhibit 6, Panel B, shows Accenture and Salesforce ranked in the top quartile. Their prices were compelling. But the outlook for both companies was concerning. Accenture faced federal contract cuts and growing fears that AI would shrink consulting’s lifeblood: billable hours. Salesforce confronted a similarly existential question: If AI agents do the work, who will purchase software licenses?
Low momentum ratings gave us cause to hesitate, with Accenture at the 11th percentile and Salesforce at the 10th.8 Quality offered limited reassurance. Their combined scores put them in the middle of the pack.
The model took modest positions, holding both stocks but committing much less capital than the benchmark.
Restraint worked. Accenture returned −29.84% and Salesforce −12.73% and their smaller positions added 0.28 and 0.25 percentage points, respectively, to the model portfolio’s excess return.
A favorable value score can catch our attention. It need not command our capital. For Accenture and Salesforce, weak momentum tempered the valuation appeal, while quality offered limited support. The combined assessment was subdued, and the model’s average positions were small. Looking beyond cheapness mattered for how much it owned, as well as what it bought.
Conclusion
Benjamin Graham gave us Mr. Market and a metric evaluating his offers: intrinsic or fair value. Naive value investing treats every low ratio as proof that Mr. Market has lost his head. Graham knew better. Mr. Market is well informed, but he can be volatile. The opportunity lies in his mood swings. His mood swings are not always irrational. We cannot distinguish his moods from his knowledge until we know what he knows: a company’s earnings power, quality, intangibles, and the news that has yet to reach the financial statements.
Our four pairs make the point. With Marathon and Valero, distorted P/Es obscured what the companies were earning. Once we caught up, we found bargains. Seagate and Lam looked expensive, but their businesses were improving faster than even Mr. Market had priced in. Berkshire and JPMorgan seemed cheap, yet Mr. Market was on to something. Accenture and Salesforce scored well on value, but Mr. Market was still digesting bad news, and this time he was right.
Cheap is a ratio. A bargain is a price below fair value. They are not the same thing. Combining value, quality, and momentum reduces the knowledge gap between us and Mr. Market, so that we can profit from his moods rather than bet against his insights. In a strong year for value, the difference mattered.
Combining value, quality, and momentum reduces the knowledge gap between us and Mr. Market, so that we can profit from his moods rather than bet against his insights.
Mr. Market will keep making offers. Sometimes he panics. Sometimes he knows something we don’t. The naive value investor assumes the first. The Graham investor checks for the second. That means reading the footnotes.
Important Information
The U.S. Active Equity Model Portfolio is a model maintained by Syzygy Asset Management. Its performance results are hypothetical and are shown gross of management fees. Actual investor returns would be reduced by applicable fees and expenses. The Russell 1000 Value Index is an unmanaged index of U.S. large-cap value stocks; index returns do not reflect fees, and investors cannot invest directly in an index.
Rob Arnott, Chairman
Endnotes
1. See Benjamin Graham, The Intelligent Investor, rev. ed., with commentary by Jason Zweig (Harper Business, 2003), chap. 8, “The Investor and Market Fluctuations.”
2. See John Coumarianos, “The Best Large Value Funds of the Year So Far,” Citywire, September 23, 2026. Performance figures are through September 15, 2026.
3. See Que Nguyen and Noah Beck, “Why Value, Quality, and Momentum Belong Together,” Syzygy Asset Management, March 2026. Each signal combines several underlying measures. Quality incorporates profitability, investment characteristics, and indicators of financial distress; momentum combines several assessments of price trends. Portfolio construction seeks to maximize the overall score within constraints on position sizes, liquidity, turnover, and diversification, with position limits also considering company fundamentals. See also Robert D. Arnott, Campbell R. Harvey, Vitali Kalesnik, and Juhani T. Linnainmaa, “Reports of Value’s Death May Be Greatly Exaggerated,” Financial Analysts Journal 77, no. 1 (2021): 44–67.
4. Model portfolio results are hypothetical and are shown gross of management fees. The Russell 1000 Value Index does not deduct management fees or other investment costs. Actual investor returns would be reduced by applicable fees and expenses.
5. January 31 was the strategy’s first scheduled rebalance of 2026. The displayed signals informed holdings and weights at that rebalance; they do not describe the signals underlying positions held earlier in January. Subsequent rebalances incorporated updated signals. Average weights and attribution reflect holdings throughout January–September, including changes during the period.
6. On February 28, 2026, U.S. and Israeli strikes on Iran led to the closure of the Strait of Hormuz. Attacks on Persian Gulf energy facilities, continued Ukrainian strikes on Russian refineries, and reduced Asian exports created a global fuel shortage. By late summer, the U.S. diesel crack spread had hit a record of more than $100 a barrel.
7. Percentile ranks indicate relative signal strength, not automatic inclusion in the portfolio. Holdings and weights reflect the combined scores across available stocks, subject to diversification, liquidity, turnover, and position-size constraints. These examples imply no fixed percentile cutoff.
8. Momentum remained weak or deteriorated further in the subsequent quarters in 2026. The model portfolio’s corresponding increases in these holdings did not follow a momentum reversal. Instead, their valuation appeal strengthened: Between January and July, Accenture’s value rank rose from the 77th to the 92nd percentile and Salesforce’s from the 86th to the 95th. The combined assessment supported larger positions as the stocks became more deeply discounted, even while momentum continued to counsel caution.
A message from Advisor Perspectives and VettaFi: Discover something new! Click here to register for our upcoming webcasts.
Membership required
Membership is now required to use this feature. To learn more:
View Membership BenefitsSponsored Content
Upcoming Virtual Events View All