What Stocks Have Done Under a Republican President and a Democratic Congress

Tuesday’s midterms were one for the history books. Democrats won control of both the House and Senate, and they picked up governorships in Ohio, Texas and Georgia. Kansas elected a Democrat to the Senate for the first time since 1932. Our home state of Texas did so for the first time in 38 years.
Voters were clearly focused on their wallets. Heading into the election, diesel averaged $6.34 a gallon, gasoline $4.23 and 30-year mortgage rates about 7.4%, according to CLSA. Even Vice President JD Vance said the war with Iran was the main reason Republicans lost.
Government policy is a precursor to change, so I asked my research team to dig into what the new lineup in Washington could mean for investors. When Congress is sworn in on January 3, a Republican president will face a Democratic House and Senate for the first time since George W. Bush’s final two years in office.
See more: What Is a Stock Really Worth? Understanding Fair Value with FAST Graphs
The Hard Part May Be Behind Us
Midterm years have historically been the toughest stretch of the four-year presidential cycle. Since 1944, the S&P 500 has averaged a gain of just 3.8% in midterm years, compared with 10.9% in the other three years, according to JPMorgan. Midterm years have also seen the deepest average drawdowns, at 18%.
This year has bucked the trend, with the S&P 500 up about 9.3% through October. And what comes after has historically been even better. The market has posted positive returns in the six and 12 months following every midterm since 1950. Deutsche Bank adds that the fourth quarter of a midterm year has been positive in 21 of the last 23 cycles, with an average gain of 7%.
Not All Gridlock Is Created Equal
Wall Street likes to say that political gridlock is good for stocks. The data says it depends on who holds which branch.
Since 1950, the S&P 500 has averaged a 16.1% annual price gain when a Democratic president faced a Republican Congress, and 17.6% when a Democratic president faced a split Congress. The composition we’re about to get—a Republican president and Democratic Congress—has averaged just 4.8%, the lowest of the six combinations, according to Bloomberg data.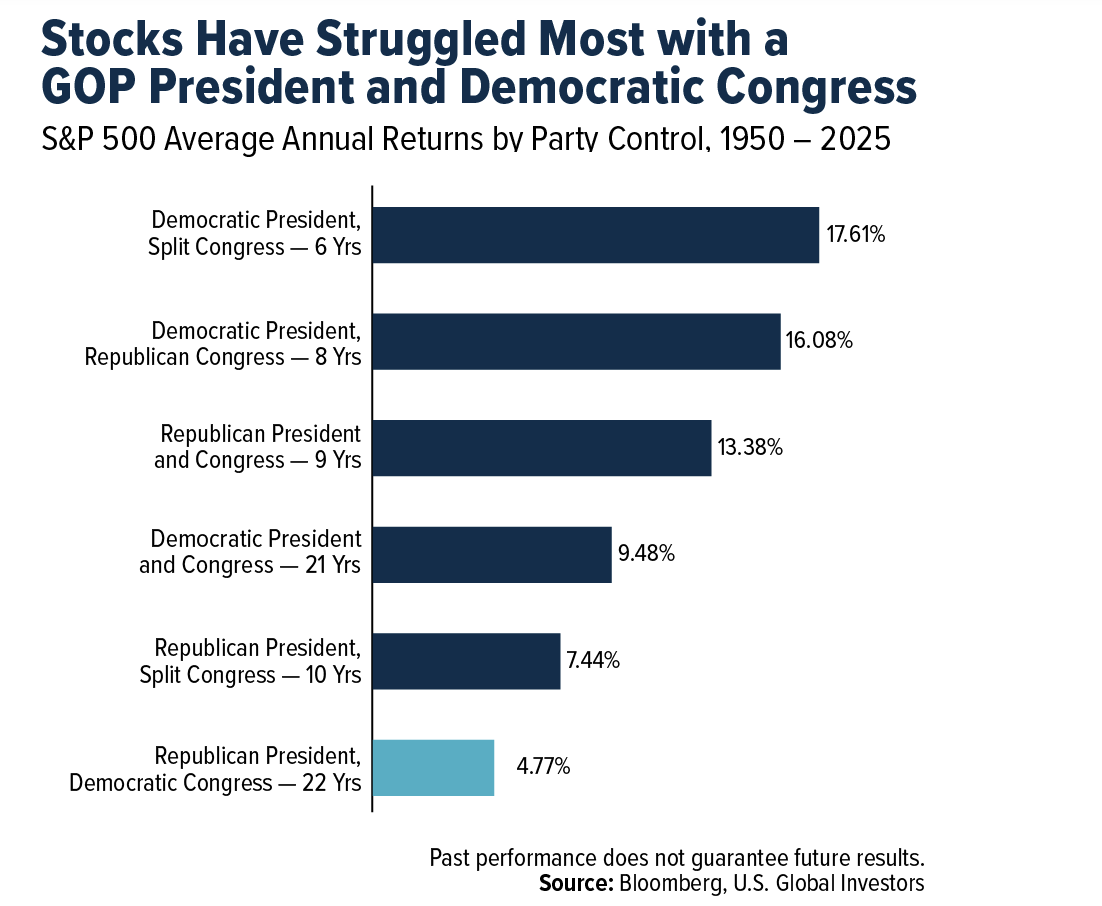
Before anyone runs for the exits, though, look closer. Much of the damage came in 1973 and 1974, during the Arab oil embargo and Watergate, and in 2008, during the global financial crisis. Congress didn’t cause those bear markets. The median year under this composition still gained 6.2%.
Year Three Has Been Positive Every Time
Timing matters as much as the lineup. 2027 will be the third year of President Trump’s second term, historically the strongest stretch of the presidential cycle. Since 1950, the market has risen in 17 of 19 third years, with an average gain of 17.3%.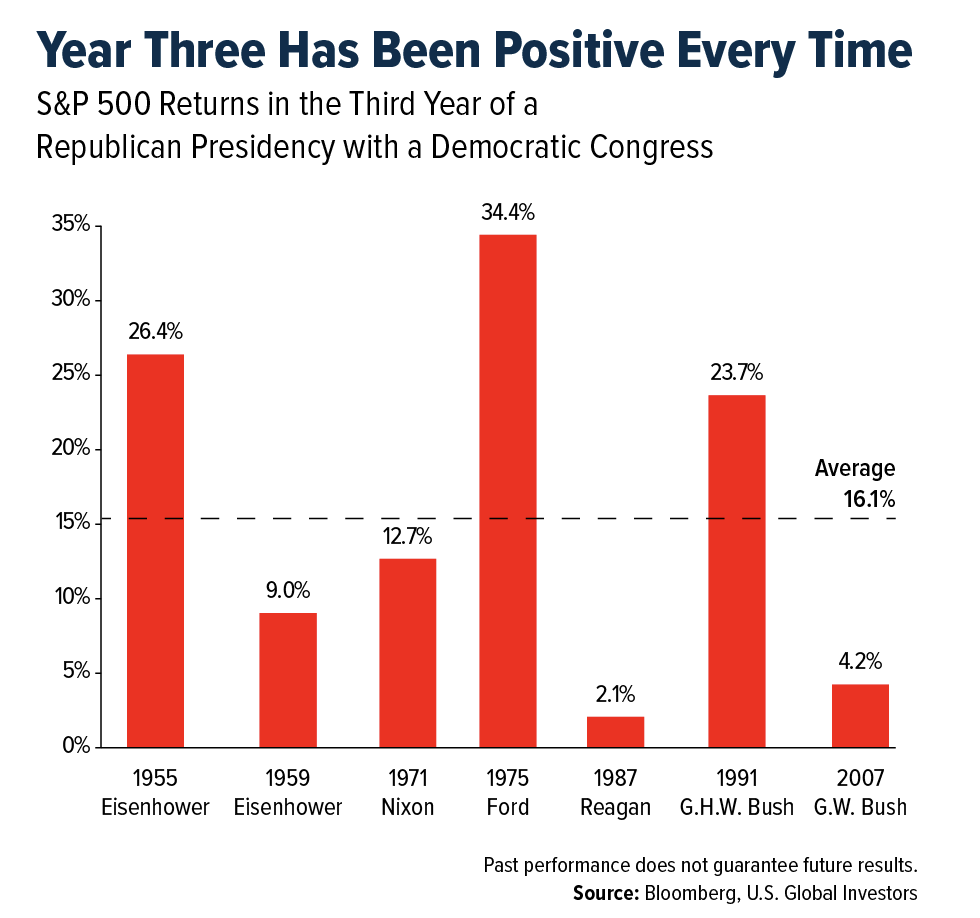
Under this makeup, the record is perfect. From Eisenhower to George W. Bush in 2007, the S&P 500 rose in all seven third years, by an average of 16.1%.
Defensive Sectors Have Led
S&P 500 sector data goes back to 1989, giving us five years under this makeup: 1990 through 1992 and 2007 through 2008. Only two sectors averaged gains, consumer staples at 9.6% and healthcare at 5.4%. Both beat the market in four of the five years. Financials fared worst, with an average loss of 7.7%.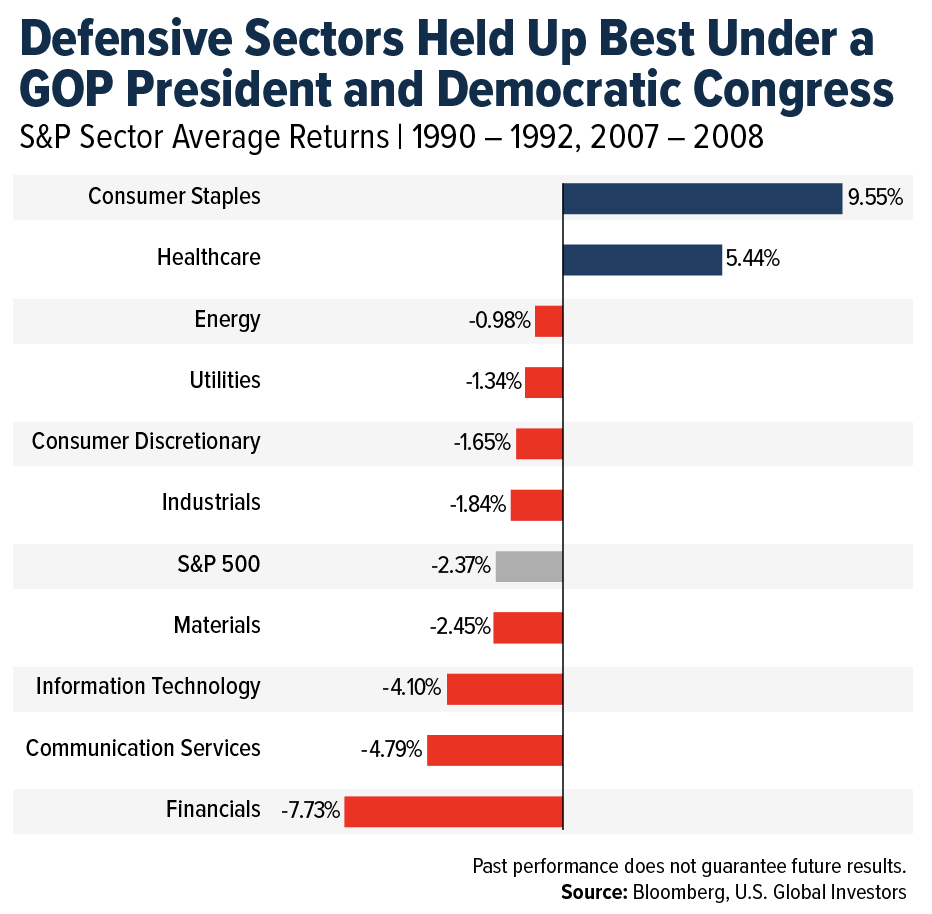
The market is already leaning that way. Health insurers and hospitals rallied Wednesday after Bernstein analysts said Democrats could delay parts of last year’s One Big Beautiful Bill Act that are expected to reduce Medicaid enrollment. Stifel notes that pushing back the 2027 start date for those cuts would be easier than restoring Obamacare subsidies. The exception may be pharmaceuticals, since drug prices are one area where the White House and congressional Democrats could find common ground.
Admittedly, five years is a small sample size, and both sectors have already had a strong 2026, with healthcare up about 21% and staples up about 18%. Investors may want to be selective rather than chase them.
The AI Backlash Starts at Home
One of the biggest surprises for me was the local ballot results. Data centers were the subject of 45 ballot measures in 10 states, and as of Wednesday morning, 33 measures to restrict them had passed, with six more projected to pass. In Ohio, home to 257 data centers, voters backed restrictions in all 20 local contests. Ohio, Texas and Georgia, three of the biggest hubs for data center construction, all elected Democratic governors. Texas Governor-elect Gina Hinojosa has called for a moratorium on new data centers.
I’m not counting AI out. Stifel expects little more than symbolic AI legislation from Congress over the next two years. But permits, power and tax breaks are largely decided by states and towns, and that’s where the backlash is.
Leadership in the market was already broadening. According to FactSet, the Magnificent Seven are on track for third-quarter earnings growth of 22.6%, compared with 32.6% for the other 493 companies in the S&P 500. If that holds, it would be the first time the group has trailed since late 2022. For investors heavily concentrated in mega-cap tech, this might be a good time to check your diversification.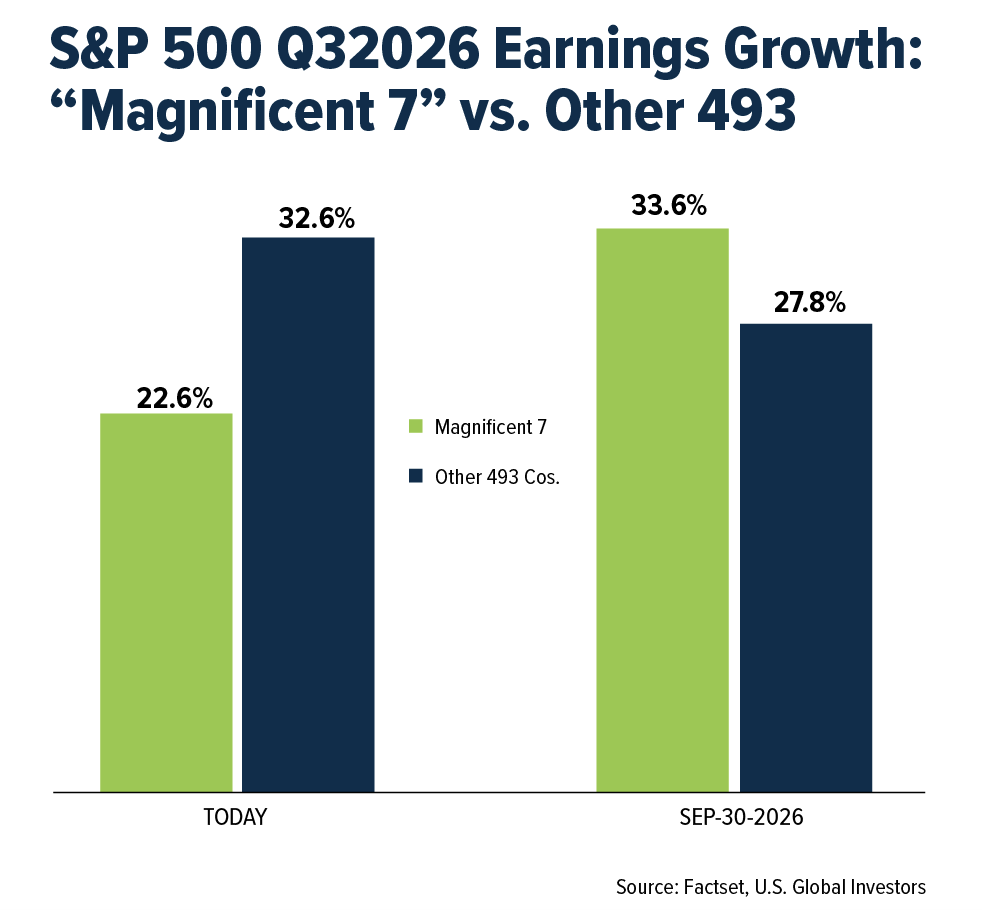
Defense Is Far from Dead
Defense stocks sold off Wednesday morning, with Lockheed Martin down 6.5% and L3Harris down nearly 8%. The defense budget has grown from $900 billion fiscal 2024 to $1 trillion in fiscal 2026, and the White House wants $1.5 trillion for 2027. Deutsche Bank warns that defense has become more politicized since the start of the Iran war.
But Stifel expects the budget to keep growing regardless of who runs Congress, and it calls a selloff on fears of spending cuts a potential overreaction.
History agrees. In 2007, the first-year Democrats ran Congress under George W. Bush, the S&P 500 Aerospace & Defense Index climbed 30.2%, seven times the gain of the S&P 500. China deterrence, missile defense, munitions and drones have support on both sides of the aisle. I believe the pullback is an opportunity for stock pickers.
Stay Selective
Washington will continue to keep markets busy. Government funding runs out December 12, the debt ceiling becomes binding next year and President Trump retains broad authority over tariffs through executive actions.
History doesn’t promise gains under a Republican president and a Democratic Congress.
It does, however, reward discipline. Rebalance when markets swing, make sure you’re not overexposed to any single theme and keep a steady allocation to gold. As always, I recommend a 10% weighting in gold, with 5% in bullion and 5% in high-quality gold mining stocks.
Airlines and Shipping
Strengths
- The best-performing airline stock for the week was Air France-KLM, up 30.4%. Airfares are continuing to rise, with the average domestic round-trip ticket for Thanksgiving travel forecast to cost 31% more.
- Lufthansa Group reported better-than-expected third-quarter results, supported by strong passenger demand, higher fares and solid performance in cargo and maintenance. Adjusted EBIT rose 6% to €1.4 billion despite a significant increase in fuel costs, highlighting the resilience of its business.
- LATAM Airlines Group reported strong third-quarter results, with revenue rising 18% year over year and earnings exceeding expectations. The airline benefited from robust passenger demand, higher unit revenues and disciplined cost management, maintaining strong profitability despite significantly higher fuel costs.
Weaknesses
- The worst-performing airline stock for the week was SkyWest, down 3.0%. Shares declined as investors remained concerned about the company’s lowered earnings outlook, higher fuel costs, and expectations for slower growth. Recent analyst downgrades also weighed on sentiment.
- China’s official manufacturing PMI fell to 49.3 in October from 50.1 in September, returning to contraction. More importantly for shipping, the new export orders index dropped to 48.7 from 50.0, signaling softer overseas demand for Chinese goods. If this weakness continues, slower export growth could reduce container volumes and put pressure on freight demand and shipping rates.
- The University of Michigan Consumer Sentiment Index came in at 48.0 in October 2026, down 10.4% year over year. The U.S. Travel Association reported that U.S. air passenger traffic declined 4.4% year-over-year in August and was 0.6% lower year to date.
Opportunities
- The Democratic victory in the U.S. midterm elections could be positive for travel stocks if it increases the likelihood of geopolitical de-escalation, particularly in the Middle East. Reduced tensions could remove some of the geopolitical risk premium embedded in oil prices, pushing crude lower. Lower oil prices would reduce fuel costs for airlines, improve margins and potentially support travel demand through lower airfares.
- Oil prices have declined as talks between Iran and Qatari mediators have raised hopes for a diplomatic resolution and a potential reopening of the Strait of Hormuz. If tensions continue to ease and oil prices fall further, airlines could benefit from lower fuel costs, improved margins and stronger earnings expectations, potentially providing additional upside for airline stocks.
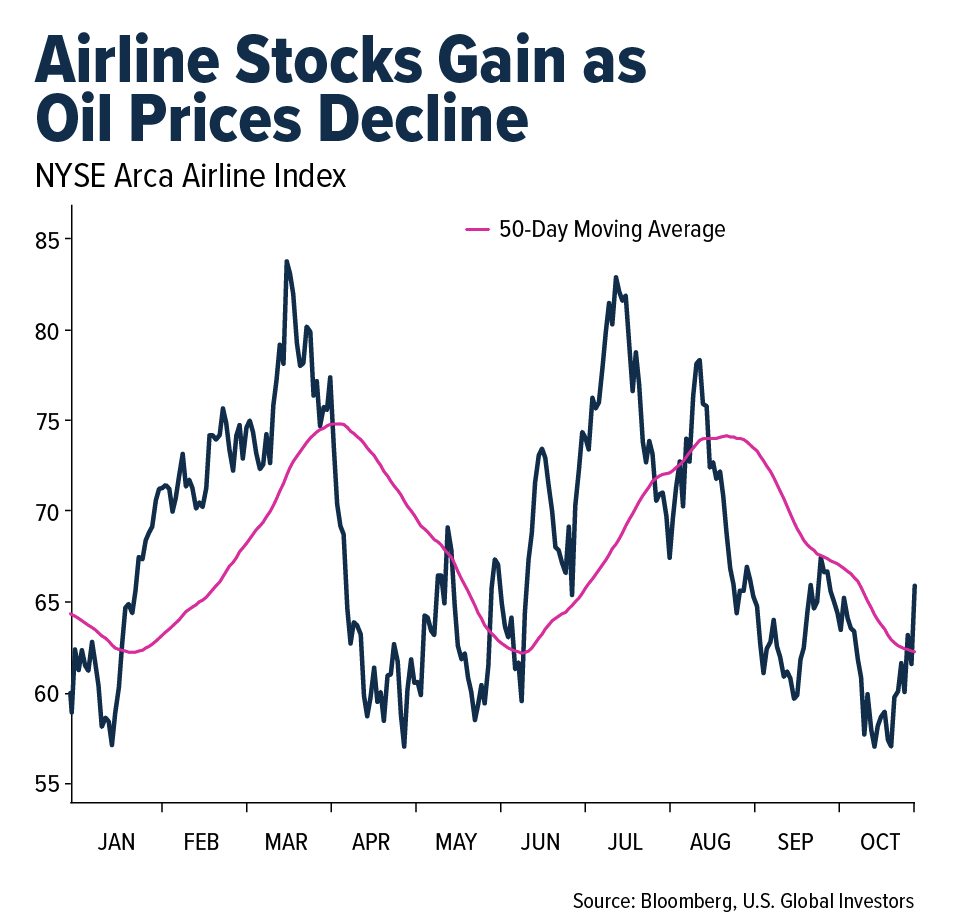
- Ryanair reported better-than-expected quarterly results despite rising fuel costs, supported by resilient passenger demand. The airline expects higher fuel expenses to be partly passed on through higher fares, while cost-cutting measures and fuel hedging should help protect profitability.
Threats
- A series of bomb threats disrupted air travel across Europe, affecting flights operated by Ryanair, Wizz Air, Scandinavian Airlines and LOT Polish Airlines. The incidents led to diversions, security inspections, temporary airport disruptions and, in Italy, military fighter escorts. All affected aircraft landed safely, and no explosives were found. However, the incidents highlight the potential for security threats to disrupt European travel and airline operations.
- Global container freight rates are beginning to soften as shipping capacity increases and some trade routes normalize. The Drewry World Container Index declined 3% at the end of October, including a 6% decline on the Shanghai-to-Los Angeles route and a 5% decline on the Shanghai-to-New York route. A continued return of vessels to the Suez Canal could add capacity and place further pressure on freight rates and shipping company profitability.
- Although Expeditors International, a holding in the SEA ETF, reported strong third-quarter results, management warned that tariffs, geopolitical uncertainty and volatile freight capacity and rates could pressure future demand and profitability. These risks could create greater earnings volatility across the global shipping and logistics industry, particularly if trade volumes weaken or freight rates normalize.
Luxury Goods and International Markets
Strengths
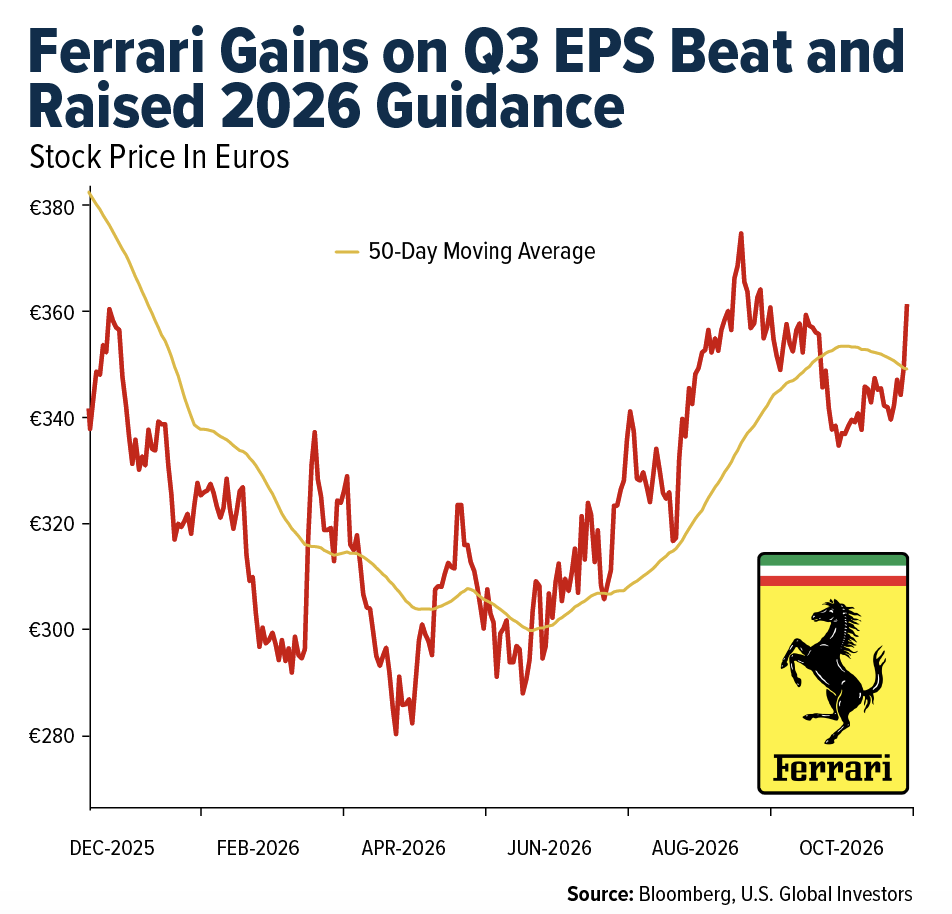
- Ferrari reported better-than-expected third-quarter results, with revenue reaching €1.9 billion and adjusted EPS of €2.44, both ahead of expectations. Strong demand for higher-value models and customer personalization supported earnings and margins. The company also raised its full-year 2026 guidance, reflecting continued confidence in demand.
- Capri Holdings reported better-than-expected quarterly results, with revenue of $809 million and adjusted EPS of $0.42, both ahead of expectations. The company also raised its full-year outlook, while strong growth at Jimmy Choo and improving profitability provided signs that its turnaround strategy is gaining traction.
- Interparfums, a fragrance company, was the best-performing stock in the S&P Global Luxury Index over the past five days, with shares climbing 16.4%. The gain followed strong quarterly results and continued momentum across the company’s fragrance portfolio, boosting investor confidence in its growth outlook.
Weaknesses
- U.S. equities weakened on Thursday following the midterm elections, with energy and technology the weakest sectors week to date. Technology came under particular pressure as investors reassessed the outlook for AI and data center investment, adding to broader market volatility and risk-off sentiment.
- China’s economic momentum weakened in October, with the official manufacturing PMI falling to 49.3 from 50.1 and the broader non-manufacturing PMI declining to 49.7 from 50.2. Readings below 50 indicate contraction, highlighting continued weakness in domestic demand and business activity. This softer economic backdrop could remain a headwind for consumer spending and demand for luxury goods in China.
- RH, a luxury furniture maker and retailer, was the worst-performing name in the S&P Global Luxury Index over the past five days, with shares declining 10.8%. Shares came under pressure amid concerns about the company’s growth outlook, high financial leverage, and the risks associated with its capital-intensive expansion strategy.
Opportunities
- Kepler Cheuvreux upgraded the luxury sector to Overweight from Neutral, signaling a more positive outlook for European luxury stocks. The firm also took a more constructive view of European banks, suggesting improving investor sentiment toward key European sectors and creating a potentially supportive backdrop for luxury equities.
- Estée Lauder’s strong results point to improving momentum in prestige beauty, particularly in fragrance and skincare. Fragrance sales grew 20% organically, while mainland China sales increased 9%, suggesting a recovery in an important luxury market. Continued strength in China and premium beauty could provide further upside for Estée Lauder and the broader luxury sector.
- China will release October trade data next week. Stronger import activity could signal improving domestic demand and support sentiment toward luxury companies with significant exposure to Chinese consumers.
Threats
- Tesla could face greater political and regulatory uncertainty in Texas following the state’s shift toward Democrats in the 2026 elections. Texas is important to Tesla because the company is headquartered there and, together with SpaceX, plans a major Terafab semiconductor project in Grimes County, with an initial investment estimated at $16.8 billion. A less politically aligned state government could increase uncertainty around incentives, permitting, infrastructure and oversight for large projects.
- Luxury companies are generally reporting solid results, with several beating revenue and EPS expectations. However, some stocks are selling off despite these beats as investors focus on expectations for moderating growth in the second half of 2026. For example, Ralph Lauren reported better-than-expected revenue and EPS on Thursday and raised its full-year outlook, yet shares fell about 8% as investors focused on an expected slowdown in growth during the second half of the year.
- The U.S. October CPI report is scheduled for release on November 10. A higher-than-expected inflation reading could increase interest rate expectations and pressure luxury and consumer discretionary valuations, while a softer reading would likely provide a more supportive backdrop.
Energy and Natural Resources
Strengths
- The best-performing commodity for the week was nickel, up 6.94%. Nickel was supported by expectations of tighter supply from Indonesia, the world’s largest producer. Prospects for more aggressive production quota cuts in 2027 have improved the supply outlook, helping nickel outperform a broadly weaker base metals complex.
- Global lithium demand in Brazil rose 48% through August, significantly outpacing the 34% increase in supply, according to Albemarle. The company now expects full-year lithium consumption growth at the high end of its 15%-40% forecast, pointing to continued strength in underlying lithium demand.
- Bloom Energy signed a framework agreement with NTT Global Data Centers to supply up to 900 MW of fuel cell capacity for hyperscale AI data centers, with initial deliveries beginning in 2027. The agreement highlights accelerating demand for reliable baseload power as AI infrastructure expands and grid constraints intensify.
Weaknesses
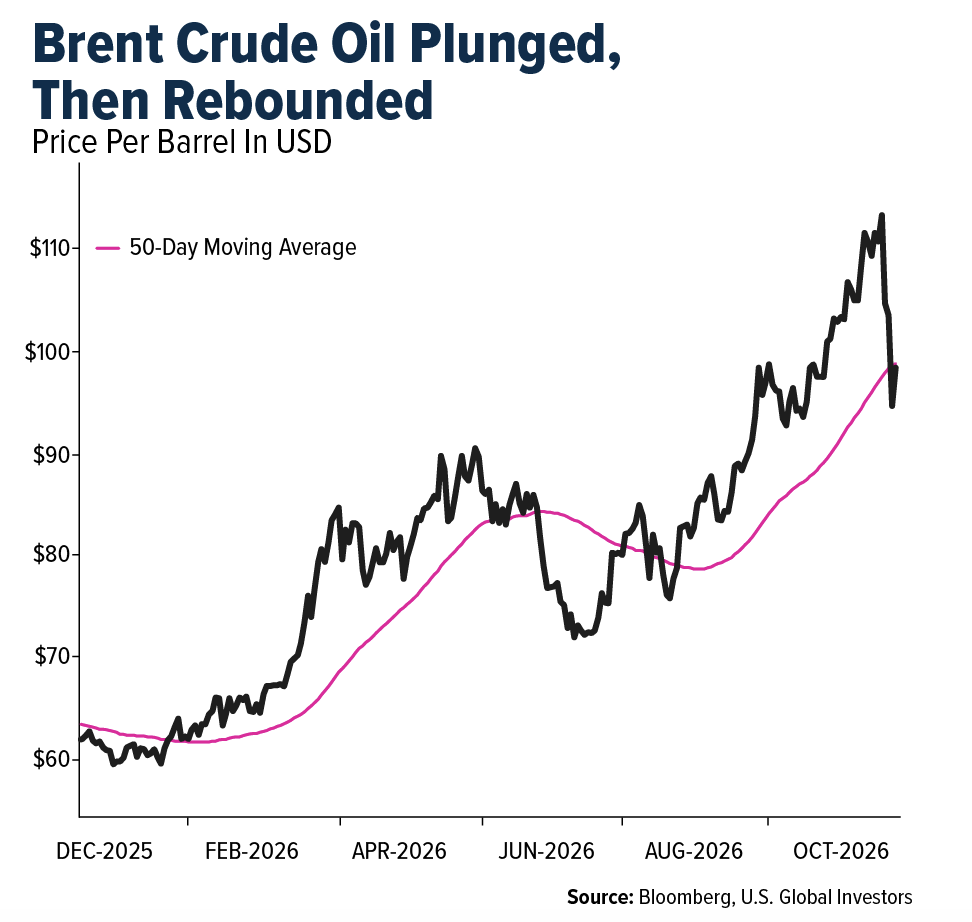
- The worst-performing commodity for the week was WTI crude oil, down 12.89%. Oil markets are heading for their biggest weekly decline since 2020 as the market rapidly unwinds the geopolitical risk premium built into prices during the Iran conflict. Expectations for a potential resolution have eased concerns over Middle Eastern supply disruptions, creating downside pressure on crude prices and the broader energy sector.
- Copper fell nearly 3% this week, touching its lowest level since late July as concerns over tighter U.S. AI regulations weighed on the outlook for AI infrastructure investment. The prospect of slower data center and power infrastructure expansion has raised concerns about future copper demand. However, copper producers continue to struggle to meet production targets. Ivanhoe Mines cut its 2027 production guidance by 20% this week.
- The outlook for aluminum has turned more bearish as increased exports from Gulf producers and expanding smelting capacity in Indonesia boost global supply. After a supply-constrained 2026, market participants increasingly expect the aluminum market to shift into a meaningful surplus in 2027, creating potential downside pressure on prices.
Opportunities
- Freeport-McMoRan’s board approved a $4.5 billion expansion and modernization program for its U.S.-based Bagdad operation in Arizona. The project aims to increase U.S. copper and molybdenum production. About 20% of project costs are expected to be funded in 2027. Freeport expects 30%-35% of the project to be completed in 2028, with the remainder finished in 2029-2030, according to Bloomberg.
- Diamondback Energy plans to keep its Permian shale drilling activity largely flat in 2027, despite crude prices near $100. CEO Kaes Van’t Hof said he expects prices to remain “higher-for-longer” but is taking a cautious approach to exploration and production. “It’s not a good way to run an E&P just to be a perma-bull,” Van’t Hof said, adding that the company should “prepare for a swing to the downside,” according to Bloomberg. Diamondback’s seasoned management team is taking a long-term approach rather than accelerating production, which could eventually put a cap on prices and set the market up for a pullback.
- China’s physical copper market is tightening, with Shanghai spot premiums rising to 2,100 yuan per ton, their highest level since 2021, as immediately available copper cathode becomes increasingly scarce. Production curbs at Chinese smelters could further tighten supply and provide support for copper prices.
Threats
- The collapse of Victoria’s A$1 billion Golden Beach gas storage project has increased concerns over future supply shortages on Australia’s east coast. With the project intended to provide critical winter storage capacity beginning in 2029, its potential loss could tighten the regional gas market and support higher domestic prices.
- Codelco identified 42,100 tons of copper production that was double-counted across 2024 and 2025, with the correction also expected to reduce 2026 inventories by 17,000 tons. The accounting discrepancy raises concerns about the reliability of reported production and inventory data as the company and authorities continue their investigation.
- European electricity prices have surged to levels last seen during the 2022 energy crisis as cold, windless weather reduces renewable generation and forces greater reliance on coal and natural gas. Repeated periods of similar weather this winter could keep power costs elevated, putting renewed pressure on energy-intensive industries and industrial activity.
Bitcoin and Digital Assets
Strengths
- Morgan Stanley is among the first major banks to use the Depository Trust & Clearing Corporation’s (DTCC) new tokenization service to create blockchain-based representations of U.S. stocks and Treasury securities. The initiative highlights growing institutional adoption of blockchain technology and could improve settlement efficiency, collateral mobility and liquidity in traditional financial markets. The involvement of major Wall Street institutions underscores the increasing convergence of conventional financial infrastructure and digital assets.
- Standard Chartered has introduced tokenized deposits for corporate clients in Hong Kong, expanding the use of blockchain technology in institutional banking. The initiative enables businesses to manage tokenized bank deposits through digital infrastructure, potentially improving transaction efficiency, liquidity management and settlement processes. The development highlights how traditional financial institutions are increasingly integrating blockchain solutions into their core banking services.
- The New York Stock Exchange (NYSE) has added Broadridge, Computershare, Equiniti and Superstate to its planned tokenized securities platform, strengthening the infrastructure needed to bring stock trading onto blockchain networks. According to CoinDesk, Broadridge, Computershare and Equiniti collectively serve nearly 5,000 publicly listed companies, including almost 99% of the S&P 500. The platform aims to enable 24/7 trading, instant settlement and stablecoin-based funding, subject to regulatory approval. The initiative highlights growing institutional momentum toward blockchain-based capital markets while preserving shareholder rights and corporate governance functions.
Weaknesses
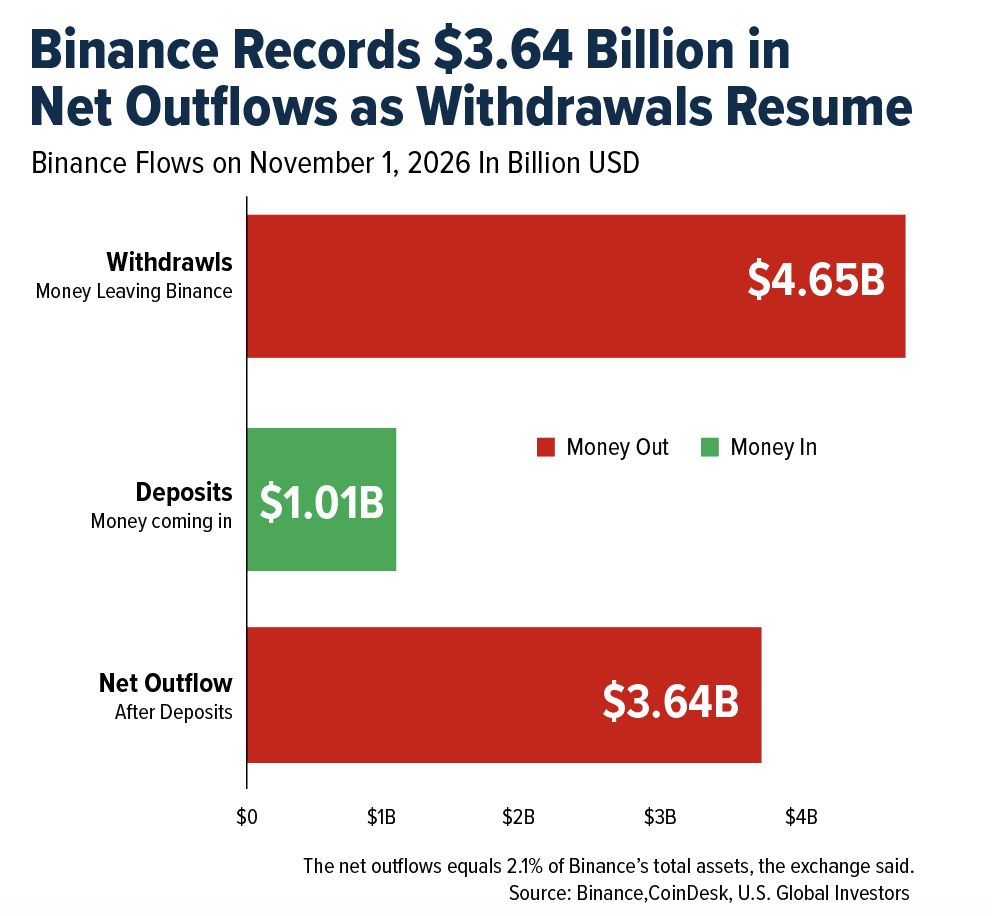
- Bitcoin declined to approximately $77,900 on November 2 as Binance customers withdrew a net $3.64 billion after the exchange reopened withdrawals following a major cyberattack. Binance processed approximately $4.65 billion in withdrawals against $1.01 billion in deposits. The FBI linked the $6.3 billion theft to TraderTraitor, a North Korean hacking group known for using sophisticated social engineering techniques to target cryptocurrency platforms. The incident highlights persistent cybersecurity vulnerabilities and the potential impact of major security breaches on investor confidence and digital asset markets.
- Morgan Stanley downgraded Coinbase and reduced its price target by 53%, citing a weaker earnings outlook for the cryptocurrency exchange. The downgrade reflects concerns about the company’s near-term profitability and exposure to challenging digital asset market conditions. The substantial reduction in the bank’s valuation expectations highlights the sensitivity of cryptocurrency-related equities to trading activity, market volatility and operating performance.
- U.S. spot bitcoin exchange-traded funds recorded $430.2 million in net outflows on November 5, led by Fidelity’s FBTC with $199.9 million and BlackRock’s IBIT with $105 million, bringing weekly net redemptions to approximately $869.8 million through Thursday. Bitcoin fell below $76,000 before recovering that level, while the broader cryptocurrency market faced selling pressure following a sharp decline in technology stocks. Approximately $1.26 billion in leveraged crypto positions were liquidated over 24 hours, highlighting weakening investor sentiment and the vulnerability of digital assets to broader market volatility.
Opportunities
- Schroders, the London-based asset manager overseeing approximately $1.1 trillion, is bringing its emerging markets bond strategy to the Solana blockchain through a partnership with tokenization specialist Centrifuge. Investors will be able to hold tokenized shares in a feeder fund linked to the underlying bond portfolio. The initiative expands real-world asset tokenization beyond money market funds and U.S. Treasuries, potentially opening new distribution channels for actively managed fixed-income strategies and increasing institutional participation in blockchain-based financial markets.
- Blockchain-based securities platform tZERO plans to go public through a merger with FG Imperii Acquisition Corp. in a transaction valuing the company at approximately $350 million before additional capital. The deal could provide up to $231 million in SPAC trust cash, subject to shareholder redemptions, with shares expected to trade on NYSE American under the ticker TZRO in early 2027. If completed, the listing could provide capital to expand regulated tokenized securities trading infrastructure, potentially supporting greater institutional participation and broader adoption of blockchain-based capital markets.
- Metals.io has issued digital tokens backed by 25 tonnes of physical copper stored in Germany, extending blockchain-based tokenization into industrial commodities. The initiative demonstrates how physical assets can be represented digitally, potentially enabling more efficient ownership transfers, broader investor participation and new financing opportunities. By connecting blockchain technology with tangible industrial resources, the development highlights the potential for real-world asset tokenization to expand beyond traditional financial securities into global commodity markets.
Threats
- Major U.S. corporations, including Nvidia, Costco and Nike, have joined opposition to OKX and Intercontinental Exchange’s plans involving tokenized equities, bringing the reported number of objecting companies to 50. The resistance underscores potential legal, governance and shareholder-rights challenges facing blockchain-based securities initiatives. Such objections could delay product launches and complicate efforts to integrate tokenized equities into traditional financial markets.
- Securities and Exchange Commission filed a criminal complaint against cryptocurrency exchange Bitget’s operator, BG Limited, alleging that it provided unlicensed trading services to Thai customers between 2022 and 2025. Authorities are seeking to block access to Bitget’s website and mobile application starting December 5, creating uncertainty around a proposed acquisition of licensed local exchange GMO-Z through a Bitget-linked company. The action highlights growing regulatory and market-access risks for global cryptocurrency exchanges, potentially complicating international expansion strategies and increasing compliance costs.
- Jack Dorsey’s Block faces a proposed $764 million settlement with the U.S. Department of Justice related to a federal anti-money-laundering investigation, while the company’s quarterly bitcoin gross profit declined approximately 50% amid lower Cash App trading fees. The combination of regulatory exposure and weakening cryptocurrency-related profitability highlights the compliance and earnings risks facing financial technology companies operating in digital asset markets. The potential settlement also underscores the financial consequences of deficiencies in anti-money-laundering controls.
Defense and Cybersecurity
Strengths
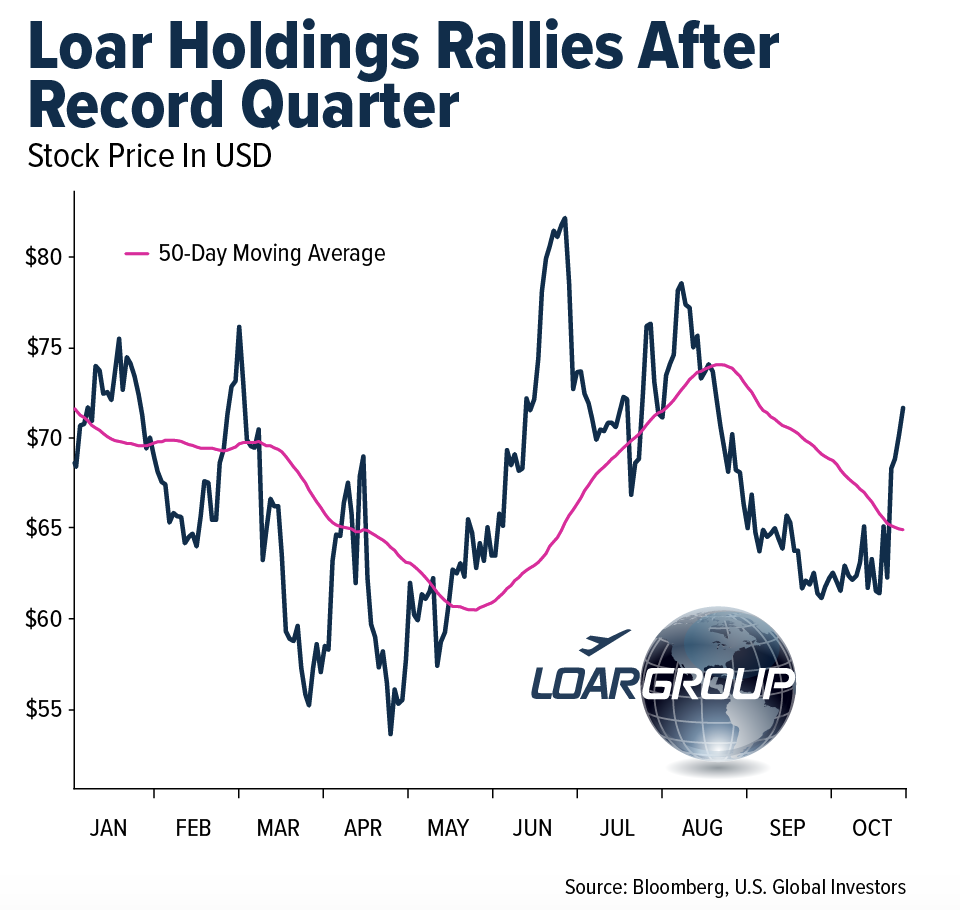
- Loar Holdings rallied this week after delivering another record quarter, with third-quarter (Q3) revenue rising 39% year-over-year (YoY) and 2.7% quarter-over-quarter (QoQ) to $176.2 million. Adjusted earnings per share (EPS) came in at $0.39, down 9.3% YoY but up 2.6% QoQ, beating consensus estimates of roughly $0.33. Management highlighted 15.8% organic sales growth, 46.5% EBITDA growth and record cash generation. The company also raised its 2026 guidance for the third time this year and introduced a bullish 2027 outlook, citing accelerating demand across commercial aerospace, aftermarket and defense. Loar now expects 2027 revenue of $745–755 million, adjusted EPS of $1.64–1.68 and EBITDA margins of roughly 42%, reinforcing expectations for continued strong growth and margin expansion.
- Cloudflare reported Q3 2026 revenue of $782.5 million, up 39% YoY and 7.8% QoQ, marking its fastest growth in nearly four years. Adjusted EPS reached $0.38, up 90% YoY and 22.6% QoQ. Growth was supported by a record addition of more than 158,000 paying customers and strong enterprise demand across security, developer and AI infrastructure products. Management also raised its full-year guidance and projected Q4 revenue of approximately $845.5 million, implying another 8.1% sequential increase.
- Global semiconductor industry sales reached $517.7 billion in Q3 2026, climbing 24.1% QoQ, as memory semiconductor revenue surged 305% YoY, driven by high-bandwidth memory (HBM) and co-packaged optics.
Weaknesses
- Despite U.S. efforts to restrict China’s access to advanced AI computing power, Chinese tech firms still have legal pathways to obtain Nvidia GPUs. Washington shifted H200 exports from a presumption of denial to case-by-case licensing in January 2026, while less powerful chips, such as the RTX Pro 5500, remain below the restricted performance threshold. This allows Alibaba, Tencent and ByteDance to continue sourcing Nvidia hardware, although severe supply constraints remain.
- U.S. AI and data center stocks were hammered following the U.S. midterm elections, as concerns about tougher regulations and restrictions on data center development triggered a broad selloff across semiconductor, AI infrastructure and neocloud companies. The downturn is adding pressure to an already capital-intensive industry, with tighter financing conditions threatening to slow new data center projects and the broader AI infrastructure buildout.
- Rheinmetall cut its 2026 sales guidance to approximately €13.2 billion from €13.7–€14.2 billion, citing delays in the Boxer armored vehicle program and Germany’s cancellation of six F126 frigates. The downgrade highlights execution and procurement risks despite the broader strength in European defense spending.
Opportunities
- Bloom Energy signed a landmark framework agreement with NTT Global Data Centers to supply up to 900 megawatts (MW) of solid-oxide fuel cell systems for primary baseload power at hyperscale AI data center campuses. Initial hardware deliveries are expected to begin in 2027.
- Nvidia instructed its multinational cloud infrastructure partners and server integrators to enforce strict compliance caps limiting secondary computing capacity available to Chinese entities. The measures aim to close gray-market, multi-tenant leasing channels for advanced Hopper and Blackwell AI accelerators.
- LG Energy Solution launched a multibillion-dollar expansion to increase its North American energy storage manufacturing capacity to more than 70 gigawatt-hours (GWh) by 2027, targeting rising power demand from AI data centers. The investment highlights how rapid AI infrastructure growth is creating significant new demand for batteries and grid-scale energy storage.
Threats
- SK Hynix is seeking U.S. export licenses to bring chipmaking equipment to its Dalian plant in China. The company argues that continued production in China is essential to helping finance its planned memory factories in New York. However, U.S. officials have delayed the necessary approvals through the Department of Commerce, putting the South Korean chipmaker’s U.S. expansion timeline at risk.
- Chinese component distributor Jiangxi Guangbo Optoelectronic Technology has begun volume deliveries of military-grade, spool-deployed fiber-optic tether cables to Russian tactical drone assembly hubs. The cables can reach continuous lengths of up to 100 kilometers (km) and are designed to bypass radio-frequency electronic warfare jamming.
- Intel issued a sharply weaker-than-expected fourth-quarter (Q4) outlook, projecting revenue of $15 billion to $16 billion, compared with expectations of approximately $17.1 billion. The company also forecast adjusted earnings per share (EPS) of $0.25, versus expectations of $0.43. The guidance points to continued PC market weakness, supply constraints and margin pressure, adding to concerns about the broader semiconductor recovery.
Gold Market
This week gold futures closed the week at $4,074.50, up $175.60 per ounce, or 4.50%. Gold stocks, as measured by the NYSE Arca Gold Miners Index, ended the week higher by 12.31%. The S&P/TSX Venture Index came in up 2.27%. The U.S. Trade-Weighted Dollar rose 0.43%.
Strengths
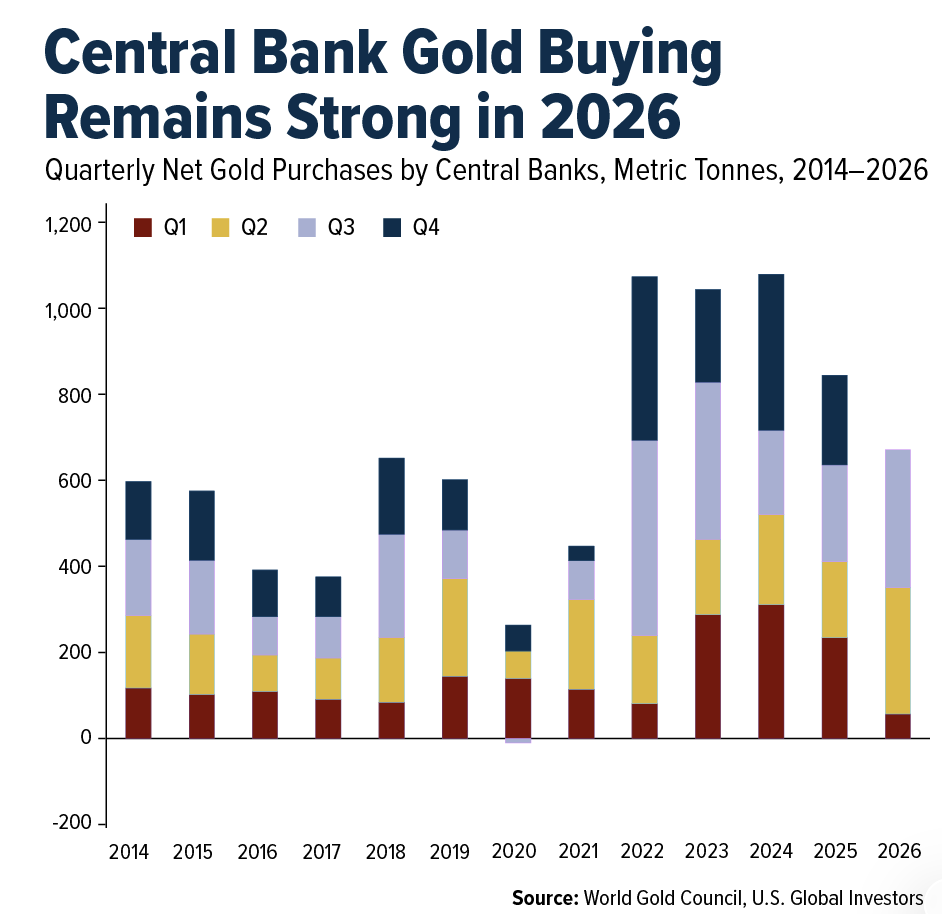
- The best-performing precious metal for the week was platinum, up 6.66%, outpacing palladium as global platinum inventories remain tight. According to the World Gold Council, central banks purchased a net 321 metric tons of gold in the third quarter of 2026, a 42% increase year-over-year and the highest quarterly total since late 2024. Year-to-date purchases reached 675 tons, up 6% from the same period last year. China and Poland led reported purchases, adding 63 and 40 tons, respectively, during the quarter. The sustained accumulation highlights gold’s strategic importance for reserve diversification and risk management, providing underlying support for demand despite elevated prices and recent market volatility.
- Gold surged 3.4% following the Democratic Party’s sweep of both chambers of Congress in the U.S. midterm elections, marking its largest single-day gain since August, according to Bloomberg. Investors anticipated greater political gridlock, pushing Treasury yields lower and weakening the U.S. dollar by as much as 0.6%. Bullion subsequently climbed toward $4,140 an ounce and was on track for a weekly gain of more than 5%, its strongest since August. However, gold later pared its gains on Friday, falling toward $4,078 as some investors sold bullion to cover equity losses, highlighting the fragility of the post-election rally.
- Wheaton Precious Metals reported strong third-quarter revenue growth, with revenue reaching $771.7 million, up 62% from $476.3 million a year earlier, as higher gold prices helped offset lower gold production. According to Bloomberg Intelligence, fourth-quarter EBITDA could increase 25% to approximately $795 million as previously produced metal is delivered and sold. Full-year production is projected at approximately 257,000 gold-equivalent ounces, slightly above the midpoint of guidance, highlighting the company’s ability to generate strong financial results despite fluctuations in precious metals production.
Weaknesses
- The worst-performing precious metal for the week was palladium, although it was still up 3.47%. Hedge funds reduced their net bullish gold positions by 1,281 contracts to 107,404 in the week ended October 27, the lowest level in 20 weeks, according to Commodity Futures Trading Commission data. Long-only positions declined to 124,352, their lowest level in more than five months, while short positions increased by 1,157 contracts to 16,948. The shift in speculative positioning reflects weakening investor confidence and growing caution about the near-term outlook for gold prices.
- Gold-backed exchange-traded funds recorded a fourth consecutive session of outflows, shedding another 34,200 troy ounces, equivalent to approximately $138.9 million, according to Bloomberg. Total holdings declined to 100.8 million ounces, their lowest level since September 25. Despite the recent withdrawals, ETF gold holdings remained 1.9% higher year-to-date, reflecting net purchases of approximately 1.87 million ounces. The persistent short-term outflows suggest cautious investor positioning, even as bullion recovered following the U.S. midterm elections.
- AngloGold Ashanti reported third-quarter gold production of 696,000 ounces, down approximately 9.4% from 768,000 ounces a year earlier, as lower ore grades weighed on output at its Sukari mine. Despite the production decline, adjusted EBITDA increased 12% year-over-year to $1.57 billion, supported by a higher average realized gold price of $4,239 an ounce. The company reaffirmed its full-year 2026 production guidance of 2.8 million to 3.17 million ounces, highlighting the operational challenges facing miners even as elevated gold prices support profitability.
Opportunities
- Gold Fields and Windfall Mining Group received Quebec’s environmental Certificate of Authorization on October 30 for the high-grade Windfall underground gold project. The mine is expected to produce approximately 300,000 ounces of gold annually once it reaches full production, while underground development activities, suspended since late August, are expected to resume shortly. Gold Fields is targeting a final investment decision by February 2027, subject to board approval, marking an important step toward expanding its future gold production capacity.
- Northern Star Resources received environmental approval for its Hemi gold project in Western Australia’s Pilbara region, clearing a major regulatory milestone for the proposed development. The open-pit operation could include up to six mining pits and a large processing facility, supporting the company’s longer-term production growth ambitions. Northern Star expects to make a final investment decision by July 2027, positioning Hemi as a potential contributor to future gold supply.
- Mayfair Gold’s Fenn-Gibb gold project in northern Ontario has been selected to participate in the province’s “One Project, One Process” initiative, which aims to reduce mining permit timelines by 50%. The accelerated approval framework could help shorten development schedules, reduce regulatory uncertainty and improve the economics of future mining investments. The initiative represents a potential catalyst for advancing new Canadian gold projects and expanding domestic production capacity.
Threats
- Gold’s outlook remains vulnerable to shifts in U.S. monetary policy expectations and Treasury yields, even after its recent post-election recovery. According to Bloomberg, the metal’s relationship with 10-year U.S. real yields has weakened considerably since 2022, with the R-squared declining from approximately 86% during 1998–2021 to 23% in the more recent period. Although lower yields and a weaker dollar have supported bullion’s latest rally, renewed upward pressure on interest rates could increase the opportunity cost of holding non-yielding gold and potentially weigh on investor demand.
- Global silver demand is expected to remain subdued through 2030 as elevated prices accelerate efforts to reduce silver consumption in solar technologies and discourage jewelry purchases, according to Bloomberg Intelligence. Industrial demand is projected to decline in 2026 before stabilizing in 2027, while weaker jewelry consumption, particularly in India, remains a significant headwind. Although data centers, automotive electrification and electricity grid investment provide some support, these sources of demand may be insufficient to offset broader structural weakness.
- Goldman Sachs lowered its year-end 2026 gold price forecast to $4,150 an ounce from $4,650, a reduction of approximately 11%, citing the Federal Reserve’s increasingly hawkish stance and its impact on investor positioning. The bank also reduced its year-end 2027 target to $4,800 from $5,400, reflecting concerns that tighter monetary conditions could weigh on bullion demand. Despite maintaining a constructive longer-term outlook supported by central bank purchases, the downward revisions highlight the risk that higher interest rates and shifting investor expectations could limit gold’s near-term upside.
A message from Advisor Perspectives and VettaFi: Discover something new! Click here to register for our upcoming webcasts.
U.S. Global Investors, Inc. is an investment adviser registered with the Securities and Exchange Commission (“SEC”). This does not mean that we are sponsored, recommended, or approved by the SEC, or that our abilities or qualifications in any respect have been passed upon by the SEC or any officer of the SEC.
This commentary should not be considered a solicitation or offering of any investment product. Certain materials in this commentary may contain dated information. The information provided was current at the time of publication. Some links above may be directed to third-party websites. U.S. Global Investors does not endorse all information supplied by these websites and is not responsible for their content. All opinions expressed and data provided are subject to change without notice. Some of these opinions may not be appropriate to every investor.
Holdings may change daily. Holdings are reported as of the most recent quarter-end. The following securities mentioned in the article were held by one or more accounts managed by U.S. Global Investors as of (09/30/2026):
Ferrari
Estee Lauder
Tesla
Ralph Lauren
JetBlue
Expeditors International
Ryanair
Lufthansa
LATAM Airlines
Wheaton Precious Metals
Gold Fields
Loar Holdings
Cloudflare
Nvidia
Rheinmetall
SK Hynix
Intel
*The above-mentioned indices are not total returns. These returns reflect simple appreciation only and do not reflect dividend reinvestment.
The Dow Jones Industrial Average is a price-weighted average of 30 blue chip stocks that are generally leaders in their industry. The S&P 500 Stock Index is a widely recognized capitalization-weighted index of 500 common stock prices in U.S. companies. The Nasdaq Composite Index is a capitalization-weighted index of all Nasdaq National Market and SmallCap stocks. The Russell 2000 Index® is a U.S. equity index measuring the performance of the 2,000 smallest companies in the Russell 3000®, a widely recognized small-cap index.
The Hang Seng Composite Index is a market capitalization-weighted index that comprises the top 200 companies listed on Stock Exchange of Hong Kong, based on average market cap for the 12 months. The Taiwan Stock Exchange Index is a capitalization-weighted index of all listed common shares traded on the Taiwan Stock Exchange. The Korea Stock Price Index is a capitalization-weighted index of all common shares and preferred shares on the Korean Stock Exchanges.
The Philadelphia Stock Exchange Gold and Silver Index (XAU) is a capitalization-weighted index that includes the leading companies involved in the mining of gold and silver. The U.S. Trade Weighted Dollar Index provides a general indication of the international value of the U.S. dollar. The S&P/TSX Canadian Gold Capped Sector Index is a modified capitalization-weighted index, whose equity weights are capped 25 percent and index constituents are derived from a subset stock pool of S&P/TSX Composite Index stocks. The NYSE Arca Gold Miners Index is a modified market capitalization weighted index comprised of publicly traded companies involved primarily in the mining for gold and silver. The S&P/TSX Venture Composite Index is a broad market indicator for the Canadian venture capital market. The index is market capitalization weighted and, at its inception, included 531 companies. A quarterly revision process is used to remove companies that comprise less than 0.05% of the weight of the index, and add companies whose weight, when included, will be greater than 0.05% of the index.
The S&P 500 Energy Index is a capitalization-weighted index that tracks the companies in the energy sector as a subset of the S&P 500. The S&P 500 Materials Index is a capitalization-weighted index that tracks the companies in the material sector as a subset of the S&P 500. The S&P 500 Financials Index is a capitalization-weighted index. The index was developed with a base level of 10 for the 1941-43 base period. The S&P 500 Industrials Index is a Materials Index is a capitalization-weighted index that tracks the companies in the industrial sector as a subset of the S&P 500. The S&P 500 Consumer Discretionary Index is a capitalization-weighted index that tracks the companies in the consumer discretionary sector as a subset of the S&P 500. The S&P 500 Information Technology Index is a capitalization-weighted index that tracks the companies in the information technology sector as a subset of the S&P 500. The S&P 500 Consumer Staples Index is a Materials Index is a capitalization-weighted index that tracks the companies in the consumer staples sector as a subset of the S&P 500. The S&P 500 Utilities Index is a capitalization-weighted index that tracks the companies in the utilities sector as a subset of the S&P 500. The S&P 500 Healthcare Index is a capitalization-weighted index that tracks the companies in the healthcare sector as a subset of the S&P 500. The S&P 500 Telecom Index is a Materials Index is a capitalization-weighted index that tracks the companies in the telecom sector as a subset of the S&P 500.
The Consumer Price Index (CPI) is one of the most widely recognized price measures for tracking the price of a market basket of goods and services purchased by individuals. The weights of components are based on consumer spending patterns. The Purchasing Manager’s Index is an indicator of the economic health of the manufacturing sector. The PMI index is based on five major indicators: new orders, inventory levels, production, supplier deliveries and the employment environment. Gross domestic product (GDP) is the monetary value of all the finished goods and services produced within a country’s borders in a specific time period, though GDP is usually calculated on an annual basis. It includes all private and public consumption, government outlays, investments and exports less imports that occur within a defined territory.
The S&P Global Luxury Index is comprised of 80 of the largest publicly traded companies engaged in the production or distribution of luxury goods or the provision of luxury services that meet specific investibility requirements.
A message from Advisor Perspectives and VettaFi: Discover something new! Click here to register for our upcoming webcasts.
