Last week brought dramatic developments across the markets. The plunge in technology stocks, particularly those tied to artificial intelligence, did not surprise us. Recognizing a bubble in search of a pin, we had been expecting it to burst for some time. When it finally began to do so last week, it dragged the broader market down with it.
The catalyst was the Democratic Party’s substantial election gains and the resulting fears that the party would put the brakes on the data center buildup.
What was surprising, however, was the resilience of the precious metals sector. It not only held its ground but actually rose, suggesting that some of the money fleeing technology stocks is rotating into the downtrodden precious metals sector as a safe haven.
The significance becomes even clearer when we compare the sector’s performance with that of the broader market, particularly technology stocks. Before examining that relative performance, we will briefly review the chart for the VanEck Gold Miners ETF (GDX).
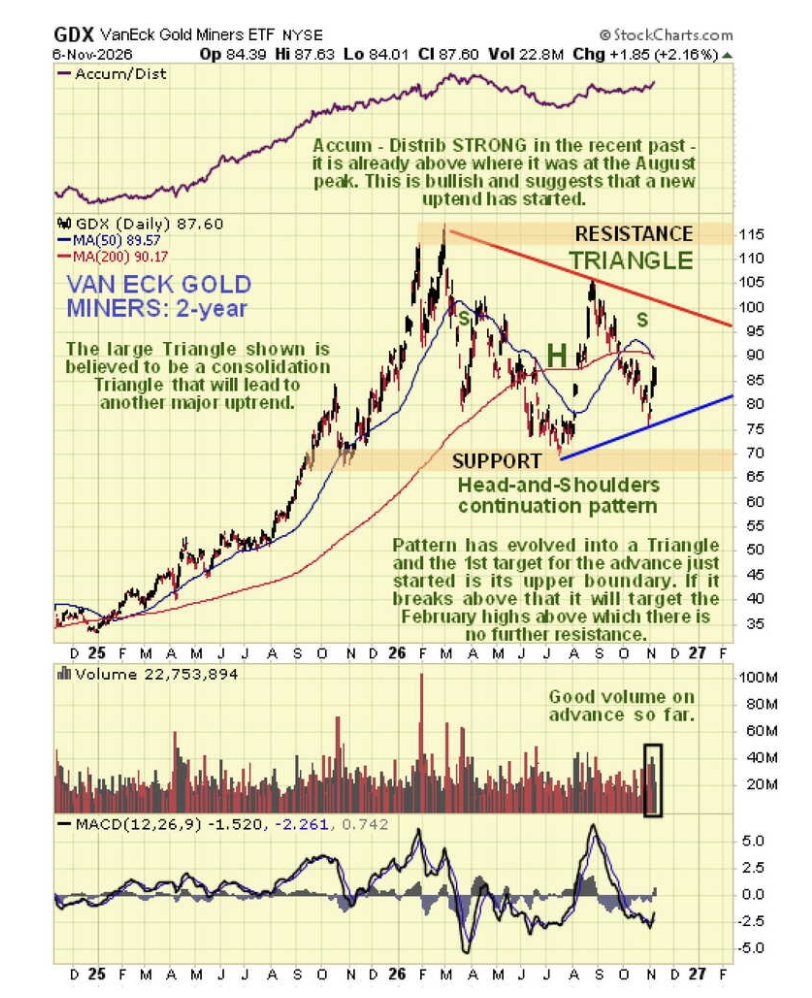
On GDX’s two-year chart, we can see that the head-and-shoulders continuation pattern we identified earlier lies within a large symmetrical triangle. Both patterns are now approaching completion.
Last week, GDX began rallying from the triangle’s lower boundary on good volume.
An especially important point is that, during the substantial correction from the late-August peak, the accumulation line did not decline. Instead, it actually advanced.
This is a very bullish divergence. On that basis alone, it is reasonable to expect a sizable uptrend to develop from here. In addition, we have just entered the most bullish time of year for the sector.
Last week’s gains in precious metals stocks were somewhat muted and overshadowed by the heavy declines in technology stocks and the broader market.
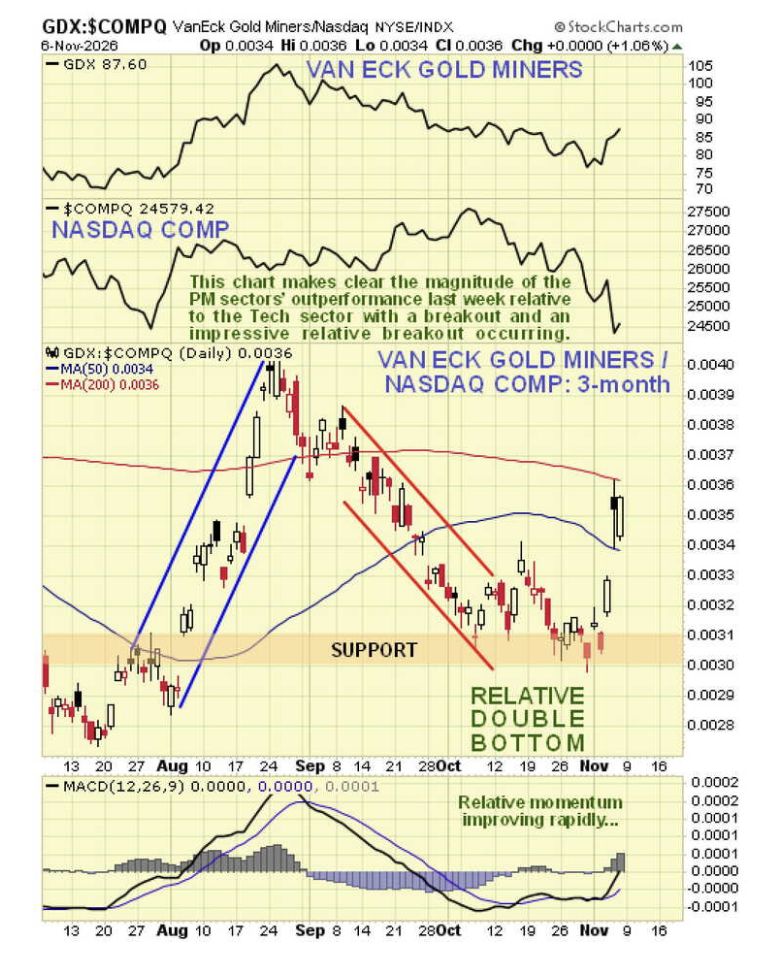
We can highlight the extent and significance of the sector’s outperformance by plotting GDX against the Nasdaq Composite Index. A three-month chart allows us to focus on recent developments.
See more: Seek Shelter From Tech Volatility With Real Asset ETFs
The chart shows a dramatic breakout last week from a relative double bottom that formed during October.
Given that GDX rose while technology stocks and the broader market plunged, it appears that some of the money fleeing the technology sector flowed into precious metals stocks as a safe haven.
This raises an important question: Would that outperformance continue during an all-out market crash?
We may now be in an environment where such a crash does not happen at all. Here is why…
The stock market is now largely owned by big institutional investors, with BlackRock, State Street, and Vanguard alone owning 70% of it. If these institutions can get society at large to foot the bill for keeping the market propped up, they will.
The Federal Reserve does not answer to the American people; it serves the interests of big money. Furthermore, it can create trillions of dollars out of thin air, with no accountability or oversight.
That gives it the ability to inject enormous quantities of money into the market to keep it elevated or arrest a decline. It can also buy Treasuries to hold down interest rates.
The general population ultimately pays the bill through inflation and a weakening currency.
The dollar remains strong relative to other currencies because similar policies are being pursued around the world. Even if the dollar looks like “the cleanest shirt in the laundry basket,” it continues to lose purchasing power at a rapid rate.
Rather than a massive market crash, we may therefore see occasional “crashlets,” such as the one we witnessed last week. Abrupt changes in sentiment can create buying opportunities for traders.
Meanwhile, persistently high inflation—even with deflationary forces also at work—should favor investments with intrinsic value, such as gold and silver.
Another positive factor for markets is the decisive breakdown in oil prices, which look set to fall further.
The Republicans’ electoral drubbing last week has curbed their enthusiasm for another assault on Iran. The election result in Israel is thought likely to have a similar effect.
If oil prices continue to ease, they could help stabilize markets already supported by ongoing central bank money creation. Together, these conditions could create a favorable environment for the precious metals sector to advance.
This article was originally published on November 8, 2026.
Clive P. Maund is a longtime trader who has provided professional chart analysis for over a decade, covering a wide range of markets with a special focus on the resource sector. In addition to his decades of trading experience and financial research, Clive obtained a UK Society of Technical Analysts diploma. You can visit his website or follow him on X (formerly Twitter) @CliveMaund.
Our Service, Use, and Transaction Terms (“Terms”) and Privacy Policy govern your access to and use of this Website and our products and services. By using the Website, establishing or creating a website account login, or engaging in online or offline transactions with Money Metals, you acknowledge that you have received and had the opportunity to review the Terms and Privacy Policy, and you agree to be bound by the Terms. The Terms are incorporated herein by reference. By using the Website or engaging in transactions with Money Metals, you acknowledge that you have read and agree to be bound by the Policies, which are incorporated herein by reference. NOTICE REGARDING MARKET RISKS, ORDER ACCEPTANCE, AND CANCELATIONS: By placing an order online or over the phone with Money Metals, you agree to be bound by our Terms and liable for any and all losses in value of the items you ordered. You may not cancel any order after you place it with Money Metals. If you fail to follow through with timely payment on an order, you are responsible to Money Metals for any monetary damages (including, but not limited to, market losses, collection fees, setoffs, etc).
A message from Advisor Perspectives and VettaFi: Discover something new! Click here to register for our upcoming webcasts.
More Commodities Topics >