Piggybacking off our piece in May on 49 Years of Income and Home Values, we now dig into home values in metropolitan areas. According to the Census Bureau, 84% of the U.S. population lives in metropolitan areas. They define a Metropolitan Statistical Area (MSA) as a region with at least one urbanized area of population 50,000 or more. In contrast, a Micropolitan Statistical Area comprises only 10% of the population and is defined as an area containing at least one urban cluster with a minimum population of 10,000, but less than 50,000. The remaining U.S. population is outside of the CB’s Core Based Statistical Areas.
With 84% of the population living in MSAs, it seems important to focus on home sale prices and changes in home prices in metropolitan areas. Our data source is Zillow Group (of Zillow.com), which has a wide range of useful real estate data. In addition to sale prices, Zillow Group has created the Zillow Home Value Index (ZHVI), which uses Zillow’s “Zestimate” to create home values in metropolitan areas. The “Zestimate” is a proprietary valuation calculated from estimated sale prices. The ZHVI uses a methodology that takes into account the changing composition of properties sold in different time periods.
We examined the ZHVI in the 5 most populous MSAs in the United States. The ZHVI data spans 20 years, is seasonally adjusted, and uses single family home, condo, and co-op data. To adjust for inflation, we’ve used the Bureau of Labor Statistics’ CPI Owner’s Equivalent Rent, which measures the average change over time in the implicit rent that owner occupants would have to pay if they rented their homes.
In the first chart below, you’ll notice some interesting patterns. Since 1996, the national median price looks to have appreciated slightly, while those in Los Angeles and New York City are significantly higher today. Surprisingly, Chicago prices are lower today than they were 20 years ago.

Our next chart shows the percent changes since 1996. You will notice that values in Los Angeles have nearly doubled and in New York they have increased by almost 40%. Here you can see the Chicago decline more clearly. Values there have dropped by over 12% in 20 years.

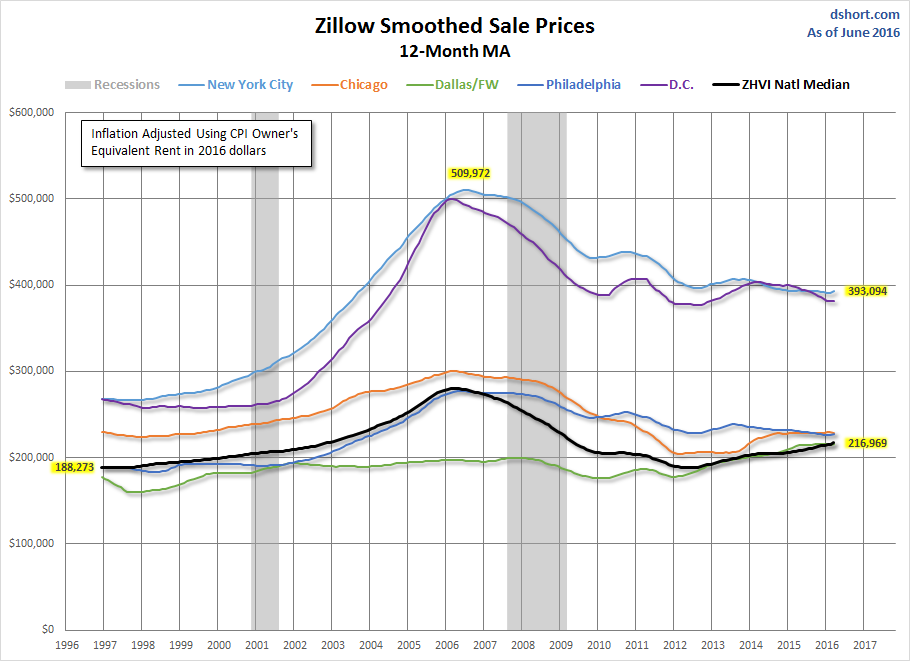
For comparison, we’ve also looked at Zillow sale prices over the same time period. Here, we replace Los Angeles with Washington, D.C. as the data is not complete for LA. We use a 12-month moving average to eliminate some of the seasonal and monthly volatility. The smoothed national median sale price for June 2016 is $216,969, higher than the ZHVI national median value, $188,238, for the same month. Interestingly, the median sale price for D.C. was higher than that of New York during parts of 2014 and 2015.
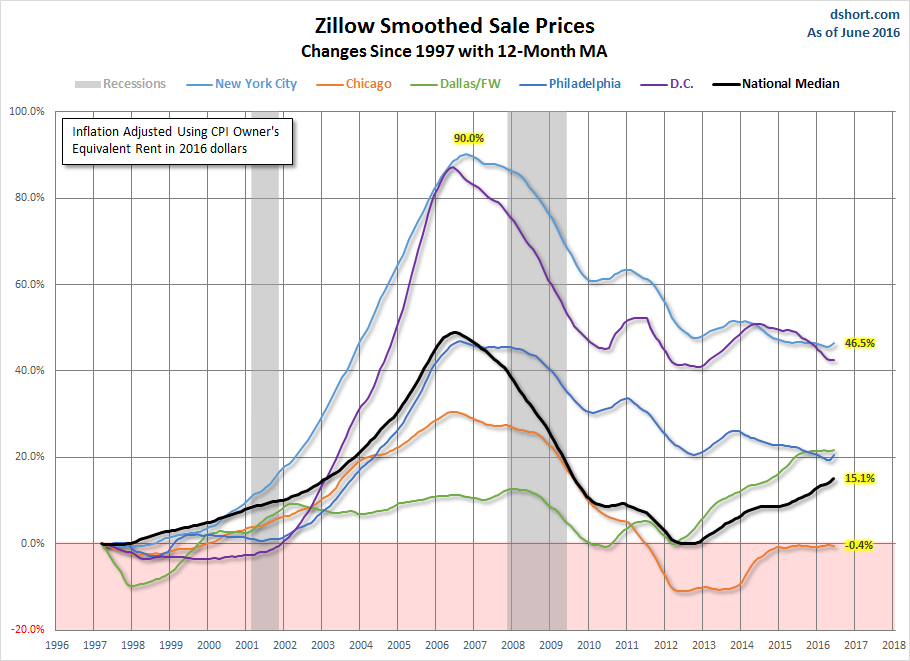
Here is the same sale price chart that looks at the changes since 1997. New York City sale prices have skyrocketed. Prices today are almost 1.5 times what they were in 1997. Chicago is slightly more affordable today: 0.4% cheaper than 20 years ago.
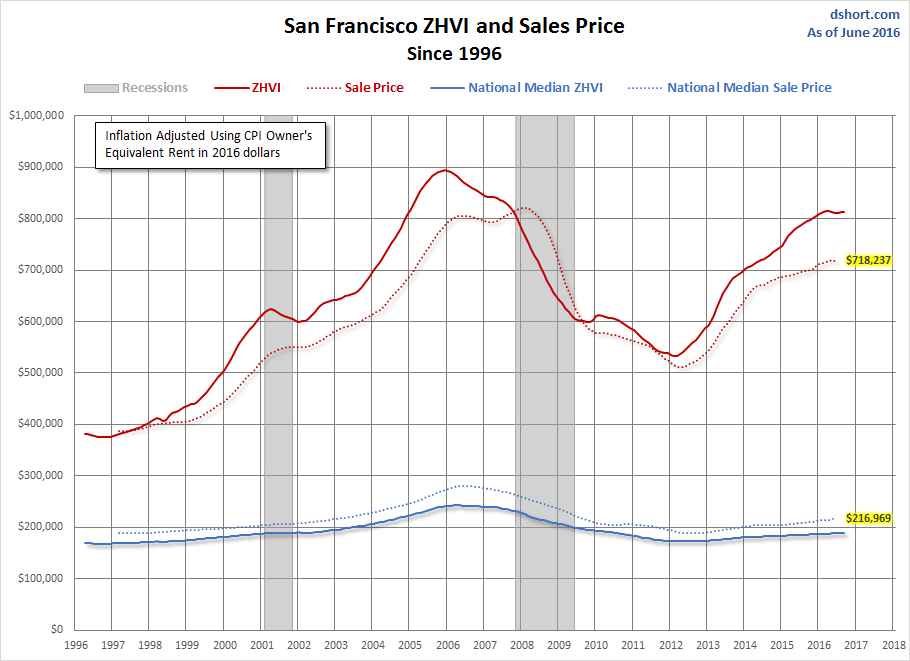
The San Francisco area housing market often makes national news over its highest-in-the-country prices. Here is one last chart comparing this metro area to the national median using the ZHVI and sale price changes.
Overall, home values and prices in metropolitan areas have risen more than the national median. With so many Americans living in these areas, it's certainly seems more difficult to afford a home now than it was even 20 years ago.
Stay tuned for more interesting real estate articles.


