The Not-So-Hidden Risks in REITs
Membership required
Membership is now required to use this feature. To learn more:
View Membership BenefitsWith most investors confident that equity REITs are a sure bet to continue their upward momentum, now is an excellent time to carefully examine whether this ebullience is justified. Let’s see what the conditions in the real-estate market mean for valuations in several of the largest REITs, as well as two of the ETFs that hold them – IYR and VNQ.
As 2015 opened, bullish euphoria about commercial real estate reached historic dimensions. In March of this year, Marcus & Millichap published the results of its latest Investor Sentiment Survey.
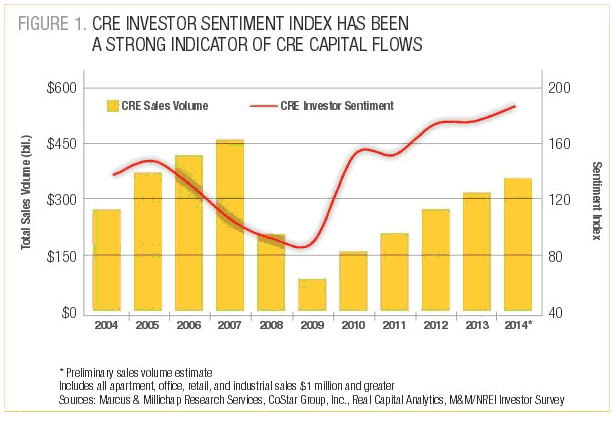
The Investor Sentiment Index evidenced record levels of optimism, well above the level reached during the pre-crisis bubble years. The survey participants included both private and public investors with an average commercial real estate portfolio of more than $35 million. Nearly 70% of those surveyed planned to add commercial real estate to their portfolios while a mere 6% intended to cut back.
There is plenty of other evidence showing that very wealthy investors have been sucked into this real estate euphoria. TIGER 21 is a membership organization for ultra-high net worth investors. It publishes a quarterly report showing the average asset allocation for all members. The latest report covering the period through the end of 2014 illustrates how this asset allocation has changed since 2007.

Source: Tiger 21
You can see that the portion of assets allocated to real estate – 27% — exceeds the 25% of the bubble peak year of 2007.
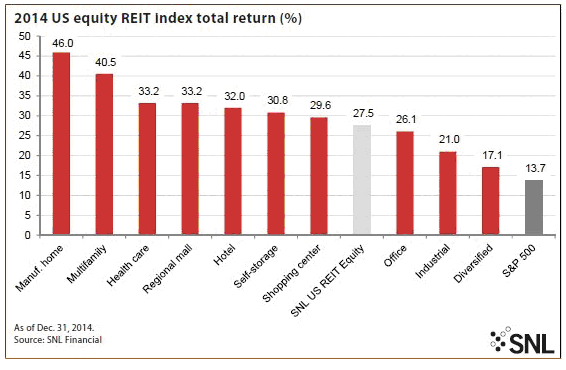
Investors are now especially enthusiastic about REITs. Who can blame them? Take a look at the amazing performance of equity REIT stocks by sector last year.
Let’s look at the equity REIT bubble and collapse of 2007-2010, and then turn to the valuations of some of the largest REITs and the ETFs that own them.
Dangerous exuberance of investors during the great bubble
By early 2007, investor optimism about equity REITs was at a record high. As that year unfolded, the move into REITs became a stampede. Unfortunately, 2007 was the top of the commercial real estate bubble. In February 2007, the MSCI US REIT index hit a high of 1,329. As the credit crisis unfolded in 2008, the index plunged steadily and hit a low of 345 in March 2009. REIT investors saw the value of their holdings crushed.
The crash occurred across the board. The FTSE NAREIT All-Equity REITs Index put out by the National Association of Real Estate Investment Trusts (NAREIT) included 128 equity REITs covering 14 major sub-sectors. It hit a high of 632 in February 2007 and then plunged to 191 in March 2009.
Holders of REIT Index ETFs fared just as badly. Vanguard’s REIT Index ETF (VNQ) peaked at around 87 in February 2007 before plummeting to roughly 20 in March 2009.
The REIT collapse was comprehensive and hit investors very hard. Many swore they would never touch real estate again.
Bank regulators resuscitated real estate investing in 2009
The bailout of the banks and the entire financial system by banking regulators and the U.S. Treasury Department in 2009 also saved many real investors and revived commercial real estate investing from its comatose state.
As I explained in my recent article on the commercial office market, the regulators made it clear that they preferred “prudent commercial loan workouts” to massive foreclosures. The Federal Accounting Standards Board (FASB) gave commercial banks the tools needed to do this by completely undermining the standards that forced impaired loans to be written down.
The following graph published by Real Capital Analytics (RCA) shows the impact of this new policy – derisively known as “extend and pretend” – on bank commercial real estate loan portfolios.
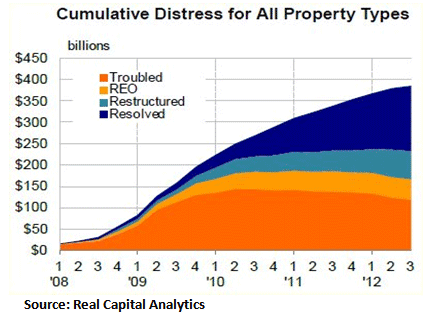
By the end of 2009, what RCA had labeled “troubled” loans had already peaked. These were seriously delinquent or otherwise distressed loans that the servicers refused to foreclose. A growing number of these troubled loans were simply “resolved” through modifications, extensions and other creative restructurings. You can also see how the total dollar amount of foreclosed loans never amounted to much.
Because most REITs had plunged by two-thirds or more from their bubble peaks, savvy investors with cash or access to capital piled into REITs in the second half of 2009. By the end of that year, the MSCI US REIT Index had nearly doubled.
In early 2010, highly regarded real estate analyst Dan Amoss warned REIT investors that the “extend and pretend” policy of the banks was a trap because commercial real estate would fall back toward their real values. He failed to realize how the lack of foreclosure liquidations being placed on the market would help to support commercial real estate prices. Investors ignored his warnings and REIT prices continued to soar through 2010 and 2011.
The short memories of REIT investors
Today’s wildly bullish investors in equity REITs have exceptionally short memories. This may be the result of Wall Street no longer mentioning what happened in 2008-2009. It could also be due to the recurring ability of investors to forget what occurred in the past and get caught up in a new bubble. [See my recent article on the dangers of euphoria].
According to data provider SNL Financial (SNL), the average dividend yield for equity REITs raged from 3% to 5% in 2014. Investors concerned with yield and little else found that to be extremely appealing.
The puny returns available to fixed income investors in bonds have enabled equity REITs to raise lots of money. According to SNL, REITs raised more than $74 billion in capital in 2013 and another $62 billion last year. In January of this year, they were able to raise nearly $9 billion.
With dozens of REITs showing total returns of 30% or more last year, it is hardly surprising that so many investors were tempted to follow the trend. There is something compelling about the momentum of rising share prices. Investors wondered why they should think about risk when stock prices head relentlessly higher.
Are equity REIT fundamentals that compelling?
Over the long term, fundamentals have always won. That was especially the case with REITs during the bubble blow off. The best way to see if the fundamentals of equity REITs are strong now is to take a close look at a few of them
General Growth Properties
One of the largest REITs is General Growth Properties (GGP). It owns more than 125 domestic regional malls as well as some in Brazil. It is important for REIT investors and their advisors to know GGP’s share price history during the bubble and its aftermath.
This REIT was very hot as 2006 turned into 2007. Its shares hit an all-time high of 50 in March of 2007. The plunge from this peak over the next two years was truly breathtaking. By early November 2008, the shares had totally collapsed to 18 cents. Not 18 dollars, 18 cents -- a dime, a nickel and three pennies. Volume in that week when the share price actually bottomed was enormous. Of course, all investors were completely wiped out. Bargain hunters scooped up the remains of the carcass with glee.
I am fairly sure that you have never heard a word about this collapse of GGP shares. It is not surprising that Wall Street would want to keep it quiet. For those of you who doubt these numbers, go to scottrade.com and check for yourself. Find GGP and then Link to “Charts” and then to “Long Term Investor.”
Since the shares bottomed out, they have slowly clawed their way back. In the last year, the price climbed from $21.30 all the way to $31.70. That gives it a P/E ratio of 78.
Revenue for the fourth quarter of 2014 was up less than 1% from the previous year. Outstanding debt was $16 billion with an average interest rate of 4.14%. It finished the year with cash and equivalents that were down 36% from the end of 2013. That would make it almost impossible for GGP to pay off its debt coming due this year and pay its dividends without additional borrowing.
Given these financials, it is difficult to justify such a high P/E.
Vornado
Vornado Realty Trust (VNO) is an owner of office and retail properties that are located mainly in New York City and Washington, D.C. After a huge run-up in 2005-2006, Vornado peaked at 130 in February 2007. Like the other REITs, its shares plunged during the credit crisis to a low of 26 in March 2009. For several months before the bottom, the trading volume was enormous. Investors who purchased in 2007 and 2008 saw their holdings smashed.
After hitting bottom, Vornado’s share price took off and then hovered around 80 until late 2013. The price soared last year as interest rates declined and closed at 115.7 on Jan. 16, 2015.
In its 2014 Annual Report (10-K), Vornado reported that operating income was down from 2013. Its income from continuing operations was also substantially lower than 2010, 2011 and 2012. They were able to pay the $547 million in common share dividends and the $81 million in preferred dividends only by borrowing more than $1.1 billion.
Over the last couple of years, the D.C. office market has weakened considerably. The average occupancy rate for its D.C. office portfolio had fallen to a very low 83% by the end of 2014.
How is it possible to justify the current P/E ratio of 80? With great difficulty. The fundamentals have been deteriorating. Total debt at the end of 2014 was $10.9 billion with an average interest rate of 4%.
Simon Property Group
Perhaps no other equity REIT shows the extent of bullish euphoria better than Simon Property Group (SPG). They are the largest REIT component in both the Vanguard REIT ETF (VNQ) and the iShares US Real Estate Index (IYR).
During the bubble years, SPG’s share price soared to 111 in early 2007 before plunging to 22 in March 2009. Volume was enormous as shares toppled toward the bottom and nearly all investors were wiped out.
By the end of 2012, SPG shares had climbed all the way back to more than 150 even though the company was heavily leveraged and was paying 5.3% on its fixed rate debt of $20.8 billion. Investors did not care because its dividend yield far exceeded that of U.S. Treasury securities.
In the first quarter of 2013, SPG reported a drop of more than 50% in earnings per share from the previous year. Apparently, this did not faze investors, as the shares climbed to 182.
On March 9, 2015, SPG announced an offer to purchase a major rival – Macerich (MAC). After Macerich rejected the initial offer, Simon responded on March 20 with what it called a final offer of $95.50. This was a 37% premium to Macerich’s closing price last November when SPG first announced it had taken an ownership position in Macerich.
Why would Simon be willing to pay a 37% premium over the value that the market placed on Macerich? Were the fundamentals so outstanding? Let’s see.
Macerich owns mainly high-end shopping centers. Its share price soared during 2006 and early 2007. The stock hit an all-time high of 96 in February 2007. Then it collapsed along with all the other REITs as the credit crisis unfolded. For several months in late 2008 and early 2009 the shares plunged with enormous volume. All share-holders saw their holdings crushed. In late March 2009, the price finally hit bottom at $5.2. That was a drop of 95%.
For several years after the collapse, Macerich’s share price slowly rose and reached a price of $60 by early 2013. The stock price stayed there for another year and finally hit $70 in October of last year. Then it took off and made a high of $90.6 in late January 2015. This may have been due to swirling rumors of Macerich’s possible purchase by SPG.
This takeover news has distracted investors from the fundamentals of Macerich’s business. What can we learn about MAC’s fundamentals by examining its latest 10-Q report for last year’s third quarter?
Income from continuing operations as well as net income per common share were both $0.25. That was down slightly from the end of 2013. For the first nine months of 2014, dividend payouts totaled $229 million. Like other REITs, it was able to afford these dividends only by borrowing – to the tune of $581 million. Total debt outstanding was $4.9 billion. Notwithstanding this borrowing, it ended the third quarter with cash and equivalent holdings of a mere $58.4 million.
Now let’s examine MAC’s 2014 Annual Report (10-K). For the year, income from continuing operations was $183 million, up slightly from $159 million in 2013 but down substantially from $303 million in 2012.
Wait a minute. There is something called “gain on remeasurement of assets,” which totals $1.42 billion. Macerich added this amount to income from continuing operations to get a total of $1.6 billion. In a footnote, the company explains that this gain is due almost entirely to the acquisition of the PPRLP Queens Portfolio in Queens, NY.
These fundamentals are hardly impressive. Did David Simon – founder of the firm — know something that market participants did not? Given all the attention Wall Street has paid to equity REITs, that seems very unlikely. It is possible that SPG was about to overpay for MAC just as so many REIT investors had done in 2007.
iShares US Real Estate ETF (IYR)
The oldest of the REIT ETFs is Blackrock’s iShares US Real Estate ETF (IYR). Its daily trading volume far exceeds the next largest – the Vanguard REIT ETF (VNQ). With shares that turn over roughly every seven days, IYR has become the plaything of traders and speculators.
Like other REIT investments, the IYR share price peaked in early 2007 at $95. As the collapse advanced, trading volume soared and averaged an incredible 200 million shares a week between February and April 2009. The price bottomed at $21 in March 2009.
Conclusion
Why do I emphasize the collapse in REIT prices and their ETFs after the bubble peak? Think back to early 2007. If I had predicted that this would occur, I would have been laughed at and ridiculed. Investors thought the party would continue for a long time. Today’s euphoria is just as widespread and just as dangerous for your clients.
It is easy to get caught up in the complacency and excessive optimism that exists today. Separating yourself and your clients from groupthink and from peer pressure is difficult.
We witnessed such herd mentality in the 2005-2007 real estate madness and we know what happened to investors. Many saw their investments pummeled, and almost none escaped without serious damage to their portfolio.
My articles are trying to prevent a repeat of that calamity. As in 2007, REIT prices have departed from the fundamentals. That should be a warning to all prudent advisors.
Equity REITs have been pushed up to unsustainable heights by herd thinking and by hordes of cash from yield-seeking investors. Shares are headed for a major fall.
Counsel your clients who are long to take their profits and get out while they can. For clients who are considering getting in now, counsel them to resist the temptation and avoid buying.
Let others play with the risks of falling off a cliff.
Keith Jurow is a real estate analyst and former author of Minyanville’s Housing Market Report. His new report – Capital Preservation Real Estate Report – launched a little more than a year ago.
Membership required
Membership is now required to use this feature. To learn more:
View Membership BenefitsSponsored Content
Upcoming Virtual Events View All


