Questioning the Accuracy of Capital Market Assumptions
Membership required
Membership is now required to use this feature. To learn more:
View Membership Benefits Advisor Perspectives welcomes guest contributions. The views presented here do not necessarily represent those of Advisor Perspectives.
In a previous article, Wade Pfau and I showed that small errors in capital market assumptions (CMAs) can have large implications for safe withdrawal rates and probability-of-success metrics in retirement.
In response, some readers suggested that advisors simply need to pick the “right” long-term CMAs. That sounds easy enough, but it turns out that it’s hard to tell whether CMAs are right or wrong, at least in any statistical sense.
As this article will show, if a retirement income plan is entirely reliant on the accuracy of its CMAs, then success is more a matter of faith than any statistically verifiable fact.
Advisors can mitigate this issue by incorporating strategies that are less reliant on CMAs, like fixed annuities, bonds held to maturity, and other contractual risk-management techniques. These strategies do not depend as much on forecasting future returns. Instead, they only require predicting whether contractual promises will be honored. That requires far fewer assumptions, and therefore provides greater certainty.
This is an especially important point for advisors to consider when the costs of being wrong are high, as in the case of retirement income.
Case study: Is every corporate bond CMA wrong?
It would be unfair to dismiss CMAs just because a single year of returns was disappointing, in the same way you can’t tell if a coin flip offers genuine 50:50 odds from just one toss. Most asset classes have high forecasted volatility, which means you should expect large deviations from the average return in any single year.
But sometimes one year, like 2022, can be so “off” that it is hard not to question the assumptions themselves.
In 2021, a group of 24 top investment firms provided 20-year CMAs to the Horizon Survey of Capital Market Assumptions. The average forecast for U.S. corporate bonds was a 3.4% arithmetic return with a standard deviation of 5.5%. But by the end 2022, the Bloomberg U.S. Corporate Total Return index was down nearly 16%. According to the CMAs, this should hardly ever happen (figure 1).
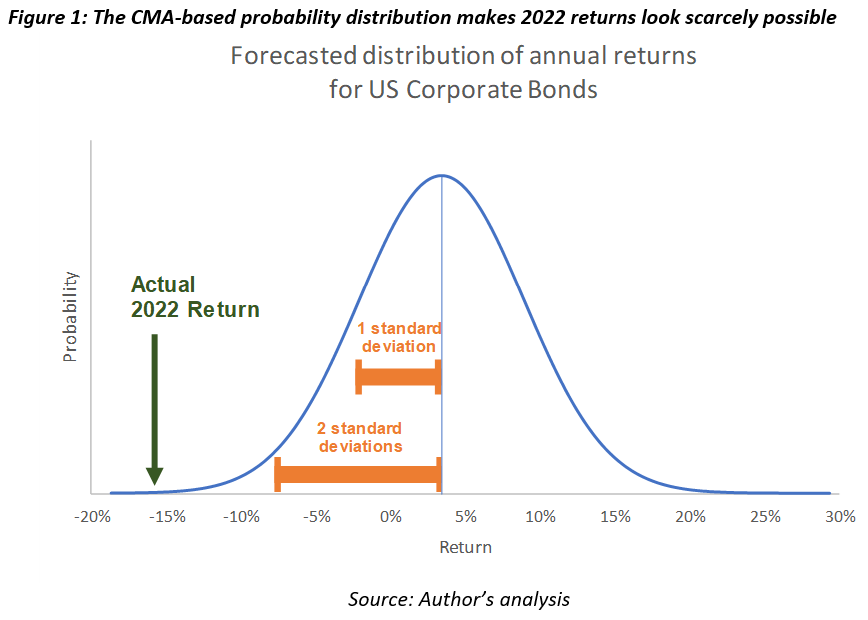
According to these CMAs, the probability of -16% or worse return is just 0.026% (assuming a normal distribution of returns; for a lognormal distribution the number would be even lower).1
To be clear, that’s not 2.6%, or even 0.26%, but 0.026%, or about one in 3,810. So, while it’s technically possible that what bonds experienced in 2022 was just a freak “3+ sigma,” or 1-in-3,810 event, it seems even more likely that the CMA itself is wrong.
Even thinking long-term may not help validate CMAs
Maybe evaluating 20-year CMAs over one year is not fair. It could be that over the next 20 years, corporate bond returns may level out, proving the initial CMA correct over a longer time horizon.
But it turns out 20 years generally isn’t enough either.
Evaluating the accuracy of 20-year CMAs, even over 20-year periods, is a bit like flipping a coin just once or twice and then deciding whether it’s fair.
Coin tosses as an analogy for testing CMAs
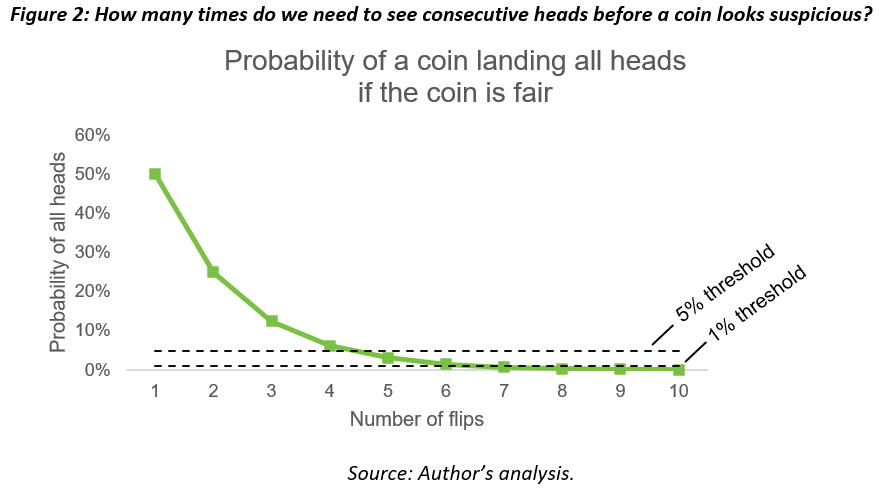
If you flip a coin once and it lands heads, you can’t say yet whether it’s fair. If you flip it again and get heads again, it’s still too early. There’s a 25% chance of getting heads twice in a row even if the coin is perfectly fair.
But if you flip it 100 times and it lands heads 65 times, you’d have good reason to think it’s not fair. The probability of that happening with a fair coin is 0.09%.
In scientific fields like biology, a “significance” threshold of 10%, 5% or 1% is often used to determine a “statistically significant” result – i.e., one unlikely to be explained by random chance. Since 0.09% is a fraction of 1%, it passes any reasonable significance test. The coin is unlikely to be fair.
Interestingly, we can calculate exactly how many coin flips we need to detect an unfair coin at a 10%, 5% or 1% significance threshold (figure 2) and we can apply the same logic to evaluating CMAs.
20 years is not enough to test 20-year CMAs
For CMAs, the number of years of data we need to assess the accuracy of CMAs (for a given significance threshold) depends on two things:
- The assumed volatility of the returns – the higher the volatility, the more years we need.
- The difference we’re looking to detect – the smaller the error that matters, the more years we need.
The margin of error that matters for retirement income is small, as Wade Pfau and I argued in a previous article. Just 1 or 2 percentage points of error makes a meaningful difference.
Below are the results, using the average 20-year U.S. large-cap CMAs from the 2022 Horizon survey (7.8% return and 16.3% standard deviation):
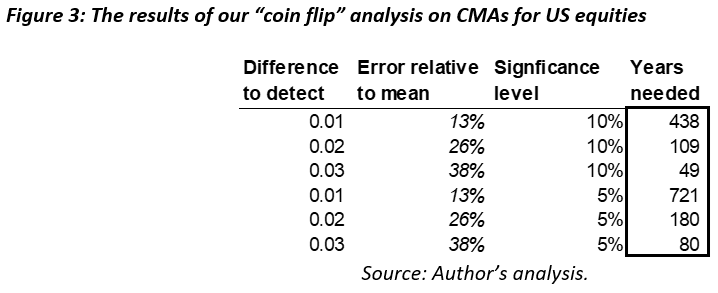
In all cases, we would need a lot more than 20 years to detect meaningful errors in 20-year CMAs, i.e., 1, 2, or even 3 percentage point differences between the forecast and the actual result. A three percentage point error means being off by nearly 40% (3 percentage points divided by 7.82%).
Another way to look at this: if we could fast-forward 20 years and evaluate the accuracy of 2022 CMAs, we’d only be able to spot a statistically meaningful inaccuracy if the actual returns were off by a huge amount. For stocks, average returns would need to be off by 4.7 percentage points or more (at a significance level of 10%). In other words, we’ll only know if the 2022 stock forecasts are wrong if they end up being massively wrong. Any difference smaller than that, and we won’t be able to tell if the forecast is wrong or if those 20 years were just particularly lucky or unlucky.
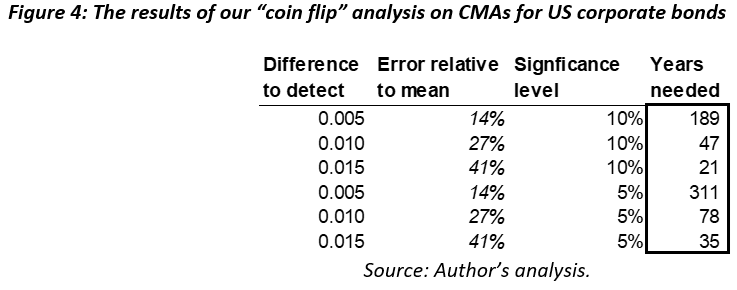
Bonds look a bit better than stocks because the assumed volatility is lower. Using the 20-year CMAs for U.S. corporate bonds, which forecast a 3.7% return and 5.4% standard deviation, we would need 21 years of data to detect a 1.5 percentage point error, i.e., an ~40% difference from the forecasted average (using the generous 10% significance level). Only for larger differences would we be able to statistically measure accuracy with 20 years or less.
Example: How did 2012 10-year CMAs do?
Another way to test CMAs is to look at historical CMAs and see how things turned out. Unfortunately, historical CMAs across multiple firms don’t go back too far. But we can test 10-year CMAs from 10 years ago using The Horizon CMA Survey, which goes back to 2012.
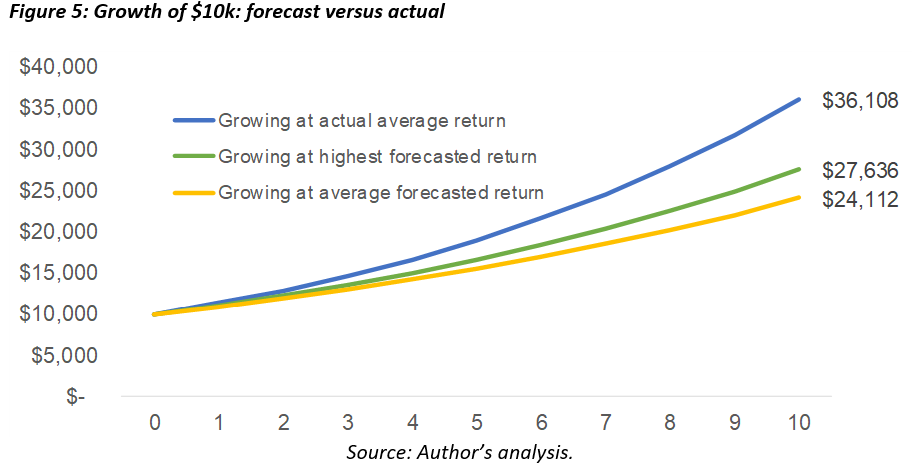
In 2012, the average forecast for U.S. large caps was a return of 9.2% with a standard deviation of 17.9%. Doing the same math as before, to detect a “statistically significant” difference from the forecast, the actual returns over the next 10 years would need to have been off by at least 7.25 percentage points (i.e., average US equity returns of less than 2.2% per year or greater than 16.5%). The actual S&P 500 total return from 2013-2022 was 13.7% per year, a difference of “only” 4.5 percentage points from the forecast. If the forecast was correct, the probability of this outcome is about 21%, using a normal distribution.
Does that mean the forecast was right? No. From a financial point of view, rather than a statistical one, the difference between 9.2% and 13.7% is definitely “significant.” And not a single forecaster projected an average 10-year return greater than 10.7%.
But it also doesn’t mean the forecast is wrong. A 21% probability is not exactly low. The problem is that the forecasted variance is so high that it makes the question of “accuracy” hard to answer. This is why evaluating CMAs is like trying to decide whether a coin is fair based on just 1 or 2 flips.
What should advisors do?
CMAs may not be statistically verifiable, but that does not mean they are useless.
Monte Carlo analysis and return assumptions make sense in cases where accuracy is not so important. For example, allocating assets during the accumulation phase does not usually require much precision – being only “vaguely right” is okay. Thoughtfully constructed CMAs provide a rough sense of how different asset class returns tend to behave, based on historical data, the current interest rate environment, and economic reasoning. And running Monte Carlo simulations gives us a better sense of volatility than assuming every year will be average.
The chart below shows what it means to be “vaguely right.” The horizontal lines represent 1- and 2- standard deviations from the forecasted average. Clearly, CMAs are far from totally random guesses. They appear to reflect some knowledge about how markets tend to work.
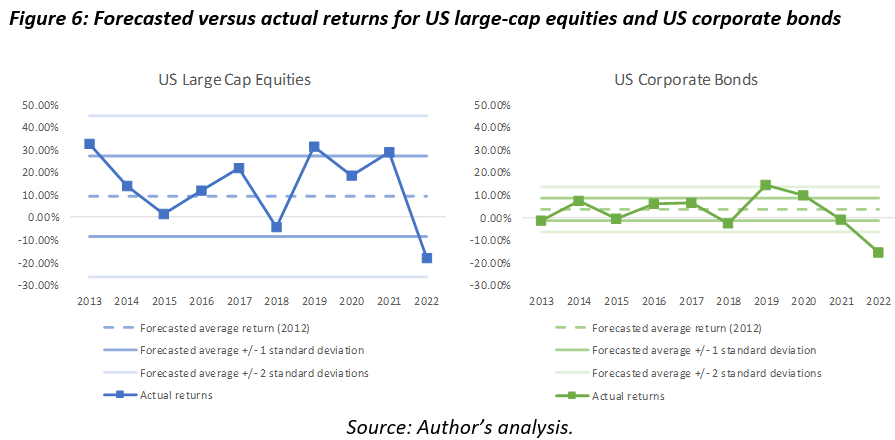
But the charts look good to the naked eye in large part because the forecasts have such a wide range of potential returns each year. For example, in the equity chart, the 2-standard deviation lines are roughly between -25% and +35% per year; that means if the actual returns are generally between -25% and +35%, the chart will look pretty good to the naked eye. For bonds it’s between -6 and +13% (and you can see again how “off” 2022 looks).
A statistical analysis tells a different story. Statistically, 10 years isn’t enough to determine the accuracy of CMA forecasts with the precision that matters for retirement income. Nor is 20. So, picking the “right” CMAs is not so easy.
Here’s why this matters: Being even somewhat wrong can make a big difference to a retiree’s life – unless, of course, you’re happy to instruct your clients to make potentially big changes to their spending in response to markets throughout their retirement. But if you think most retirees want stable and predictable cash flows, it may be unwise to rely solely on the accuracy of CMAs for retirement income planning.
What can advisors solving for retirement income do about this? Here are three potential implications:
- Know what CMAs you are using!
If your strategies are heavily dependent on CMAs, then you or your firm’s professional judgment about which CMAs to use will matter a lot to the outcome retirees will experience. So, as a minimum, you should know what CMAs you are using. You might also want to know where your CMAs stand relative to other CMAs – are they more conservative or aggressive than others? The Horizon CMA survey is a great resource for this.
- Stress-test your CMAs
Understand the impact of different CMAs on the results of probability-based retirement income strategies. Try using lower return numbers and/or higher volatilities and see what happens. Better yet, come up with a simple “worst case” scenario and make sure your client can live with the result.
- Incorporate contractual assets
Consider retirement income strategies that are less dependent on picking the right return forecast, especially for “essential” retirement income and constrained retirees. As Wade and others have shown, retirees can benefit from plans that incorporate fixed annuities (SPIAs or DIAs), cash flow-generating bonds held to maturity, protective hedging using derivatives, and other contractual risk management techniques.
These “contractual” strategies provide more certainty because less knowledge is required to forecast their outcomes. Contractual strategies require you to forecast that specific contracts (bonds, annuities, derivatives) will be honored. Total-return strategies require that too, but they also depend on your ability to forecast returns via CMAs.
Massimo Young, CFA is head of investment solutions and technology for the individual retirement solutions group at Insight Investment.
1 Technical side note: There are other methods of modelling fixed income returns, like Hull White models, which explicitly model interest rate volatility and might have better captured the effects of the interest rate hike of 2022. That said, those models still require forecasting what interest rate volatility will be, and it seems many did not expect that interest rates would rise quite as much or quite as quickly as they did. In any case, many financial planning tools do not use models like this, and instead rely on a simpler mean-variance framework with a normal or lognormal distribution of returns like the one described above.
A message from Advisor Perspectives and VettaFi: To learn more about this and other topics, check out our most recent white papers.
Membership required
Membership is now required to use this feature. To learn more:
View Membership Benefits