Investor appetite for income has pushed yields and spreads on high-yield bonds to very low levels, while corporate borrowers have fed that demand with record issuance of new debt. On top of low yields and heavy issuance, bond dealers have retreated from corporate bonds in response to new financial regulations. As a result of these factors, we believe now is a particularly risky time to invest in high-yield bonds. Here we offer some of our suggestions for seeking income and yield with less risk.
If you have invested in high-yield bonds over the last five years since the global financial crisis, you have likely enjoyed an excellent run. The annualized return on the Bank of America Merrill Lynch (BAML) High Yield Index, a commonly used benchmark of high-yield bonds, was 18.18% over the five years through March 31, 2014, a period that began just as markets bottomed in the first quarter of 2009. By comparison, the average annual return on the BAML 5-7 Year US Treasury Index was just 3.26% over the same period.
The gradual economic recovery over the last five years, combined with unprecedented monetary accommodation, have kept real and nominal interest rates very low and fueled investor appetite for higher yield. Yield spreads are now so tight that high-yield investors can only cross their fingers and hope this trend continues. If it does, so will the incentives for borrowers to tempt the market with lower quality offerings. If the economy weakens, high-yield defaults would likely rise, as would spreads with growing risk aversion.
The high risk of low spreads
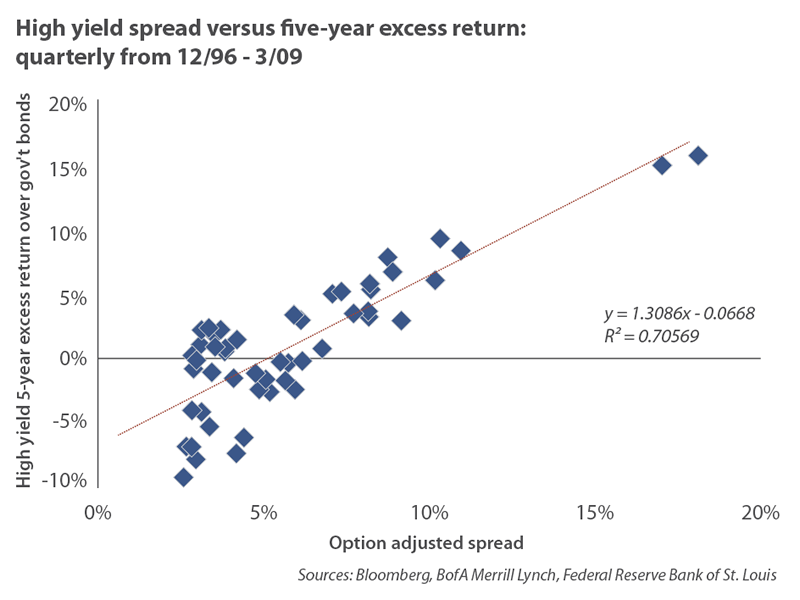
The spread available from high-yield bonds has historically been a decent predictor of future returns: when the spread was low, so was the compensation for bearing credit risk relative to "safe" government bonds. The yield spread¹ of the BAML High Yield Index over government bonds was 3.71% at the end of April, the lowest level since July 2007.
To model the relationship between spread and return premium, we analyzed the relationship between the high-yield spread and the five-year annualized excess return of the BAML High Yield Index over the BAML Treasury Index for each quarter end from 12/31/1996 to 3/31/2009. We chose a five-year return horizon because it approximately matches the typical duration of the high-yield and 5-7 year Treasury indices. The relationship is nicely linear, with an R-squared of 71%, which means 71% of the variation in five-year excess returns for the High Yield Index could be explained by the spread at the beginning of the five-year period.
The bad news is that this model predicts excess return for the BAML High Yield Index of minus 1.83% based on the current spread of 3.71%. The model suggests that for the 13 years from December 1996 to March 2009 — a period that contained two major default cycles — a beginning spread of 5.10% was necessary to compensate investors for future credit losses and other risks just to break even with the return of government bonds of similar maturity.Index to see whether the host country outperformed.
The good news is that longer-term data suggest the 5.10% estimate could be cut roughly in half. Data from S&P on five-year cumulative default rates in the US from 1981 to 2011, weighted to match the current credit rating profile of the BAML High Yield Index, indicate an annual default rate of 4.11%. Meanwhile, S&P's corporate default recovery data from 1987 to 2013, again weighted to match the current rating profile, suggest a loss of 66¢ on each dollar of debt in default. Combining these historical default and recovery estimates leads to an annual default-loss estimate of 2.67%. If the BAML High Yield Index experienced an equivalent level of default losses for the next five years, it would provide a return of approximately 1.04% in excess of government bonds, all else equal. Note that this estimate excludes other risks such as a rise in spreads or decline in liquidity.
Finally, there is no guarantee that future excess returns or default rates will resemble the past; to that end we might look at Moody's forecast for 2014 US defaults, which is 2.4%. Such a historically low default rate, were it to continue, translates to about 1.5% of credit losses after factoring in recovery value of defaulted bonds. Caveat: In 2007, Moody's was buried under a pile of AAA ratings it assigned to subprime mortgage debt; we would hope they have learned something about extrapolating recent trends into the future, but this forecast makes us gulp.
Thus we have a range of annual high-yield loss estimates, from 1.6% to 5.1%:
- 1.6% based on Moody's 2014 forecast
- 2.4% based on more than three decades of default and recovery estimates
- 5.1% based on 13 years of spread and excess return over the last two credit cycles
A liquidity crisis brewing?
Credit risk is not the only type of risk posed by speculative bonds; liquidity risk is another worth special mention. Default-loss estimates calculated above do not include losses (both realized and in the form of opportunity costs) that might be incurred as a result of the inability to sell a bond at a "fair" price. Incidentally, this is a risk not faced by an index, although index values can be influenced by liquidity-stressed prices.
In the evolution of the corporate debt market in recent years, we see three conditions that are increasingly ominous:
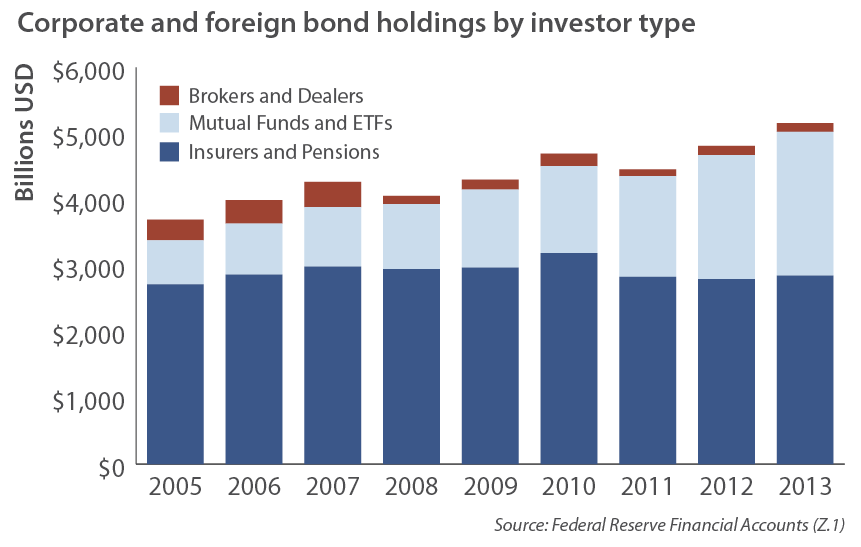
1. Mutual funds and ETFs have substantially expanded their footprint in corporate debt.
The percentage of corporate and foreign bonds held by mutual funds and exchange-traded funds (ETFs) has more than doubled in the last decade, rising from 7.4% in 2003 to 16.2% at the end of 2013.² Holdings by insurance companies and pensions — traditionally among the biggest holders of corporate bonds — have dropped from 32.8% to 21.2% over the same period. Insurers and pensions typically hold their bonds to maturity, with payments of principal and interest structured to offset their anticipated liabilities. Mutual funds, on the other hand, offer daily liquidity, which means they must be able to quickly liquidate a portion of their portfolios to meet demand for redemptions. Mutual funds are forced sellers in such conditions, and it is worrisome that the ratio of strong hands (insurers and pensions) to weak hands (mutual funds and ETFs) has decreased so dramatically in the past decade from 4.4 to 1.3.
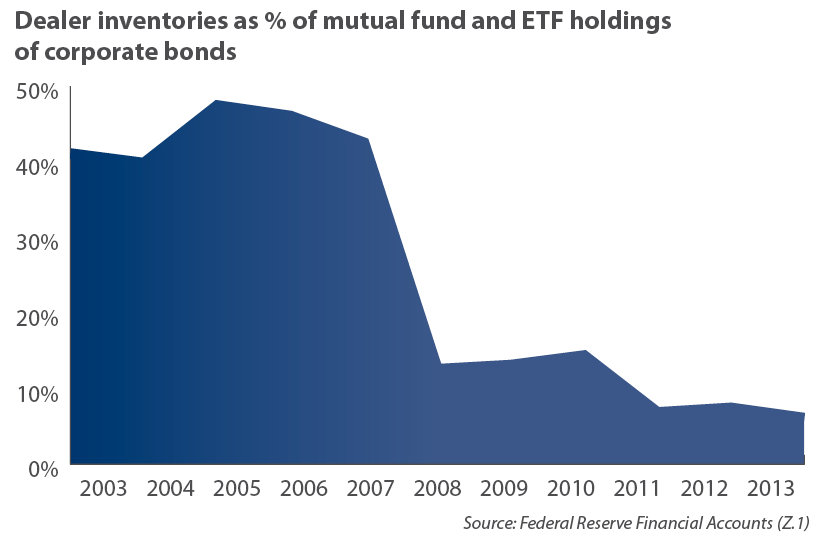
2. Dealers have retreated from making markets in corporate debt.
Also worrisome is that corporate bond dealers have reduced their inventories dramatically in relation to the size of the corporate bond market, particularly since 2007. Regulations enacted after the financial crisis cut into the profitability of the market-making role. At the end of 2013, dealer inventories represented just 6.1% of corporate and foreign bonds held by mutual funds and ETFs, down from 42.5% at the end of 2007, and less than half the 12.6% at the end of 2008 in what was then a full-scale liquidity panic.
Retiring baby boomers' need for income has recently pushed up demand for high-yield mutual funds and ETFs, a trend expected to continue for the next 15 years or so. But this source of demand is prone to waves of fear and greed. According to Morningstar, investor returns from taxable bond funds in the 10 years through December 31, 2013, trailed the performance of the funds themselves by 2.24% annually as a result of those investors' poor timing decisions.³ The combination of poor timing and very thin underlying liquidity could be the recipe for major bond market turmoil.
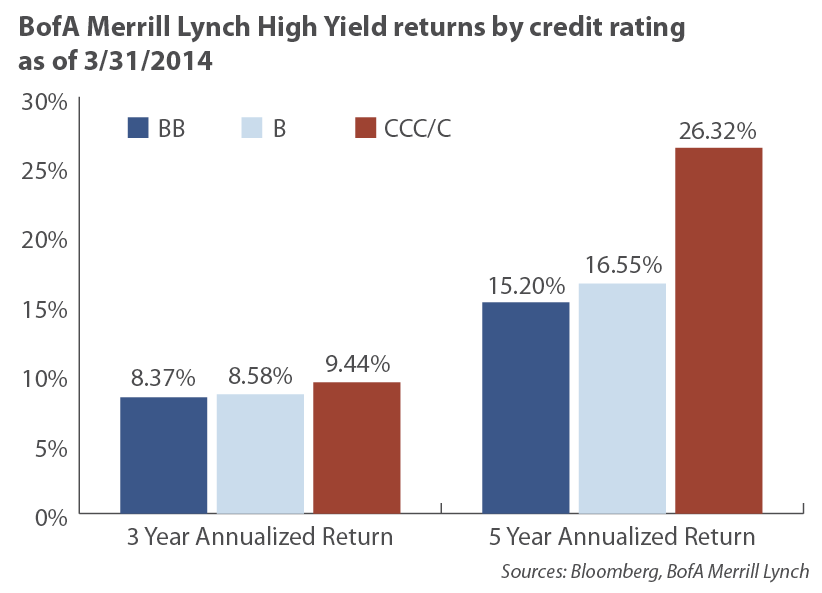
3. Large, return-chasing inflows have encouraged investment managers to load their funds with credit and liquidity risk.
Bonds rated CCC or below as having the highest chance of defaults have been the best performers in high yield over the past three and five years. The pattern continues with B outperforming BB (the high-yield universe is generally agreed to include bonds rated BB+ and lower).
The better returns for fund managers who have taken the most credit risk have attracted more inflows, but those managers have to find something to do with the new money investors send them. Most likely this means buying more of the riskiest bonds. The Wall Street Journal reports that "among the 10 largest US bond funds at the end of 2013, the four with the fastest growth in assets since 2008 held an average 20% of their investments in bonds rated below investment grade…At the remaining six funds, low-rated debt accounted for 1.4% of the portfolio."4
"If you can't join 'em, lick 'em" — Warren Buffet
As managers of the Sextant Global High Income Fund, our investment objectives and constraints more or less require us to hold some high-yield debt.5 So what opportunities are we finding to avoid the excesses we see in the high-yield market? Here are some ideas:
- Tread carefully in the lower credit tiers. Our analysis shows spreads over potential default losses decreasing with a decrease in credit quality.
- Look for collateral. A liquidity panic can morph into a solvency crisis if borrowers cannot rollover their maturing debts with new bonds, as we saw in 2008. We seek bonds of companies that control readily-marketable assets, such as pipelines or quality brands.
- Consider stocks. We find a decent selection high-quality companies with dividend yields currently above 4%, not far off from the yield available from a portfolio of high-yield bonds. While stocks are generally more volatile than high-yield bonds, they offer better liquidity. They also offer some inflation protection, as companies may be able to raise prices to drive higher revenues, profits, and ultimately higher dividends if inflation picks up. And, if a panic does erupt in high-yield bonds — particularly if the panic is contained there — quality dividend stocks should offer some welcome diversification.
- Be wary of large bond mutual funds and high-yield ETFs. Large bond funds with exposure to high yield may have a harder time moving their big blocks of bonds in the event of a redemption-fueled liquidity crisis. These funds are also less choosy during periods of inflows, as they may need to take pieces from many new issues in order to stay fully invested. High-yield ETFs offer institutional clients "in-kind" purchases and redemptions (swapping securities for securities) to help keep traded prices close to the NAV, but ultimately real-money buyers are necessary to exit trades. If liquidity is tight, distressed prices could be the tail that wags the NAV.
- Look to the periphery. With increasingly speculative issuers coming out of the woodwork to issue debt at historically low yields, we look for bonds that lack natural buyers. For example, municipal bond funds — previously the natural buyers of Puerto Rican government bonds — fled that market last year in anticipation of a downgrade to junk, sending yields from around 5% to 9%. And these are tax-free yields. Although the risks in Puerto Rico are very real, we do not view those risks as strongly correlated with risks in high-yield corporate debt, so there is diversification potential.
The search for yield is characteristic of the low-interest-rate environment of the last decade. Prior to 2008, that search fed demand for novel and complex forms of structured credit, the most infamous among them being opaque packages of subprime mortgage debt. In the five years between 2003 and 2007, net issuance of structured credit amounted to $2.94 trillion before the market imploded on itself. Do we dare mention that in the five years from 2009 to 2013, net issuance of nonfinancial corporate debt totaled $2.84 trillion, an eerily similar amount?6 In the 2000s, investment banks loaded credulous investors with highly-rated but ultimately toxic concoctions of low-quality debt sliced into non-transparent structures. Having been burned so badly, investors still hungry for yield have chosen to take credit risk in the clear packaging of vanilla corporate bonds. While we see that as an improvement, today's low spreads, declining quality, and dubious liquidity could still leave investors short of a happy ending this time.
Footnotes
¹1 Technically, this is the "option adjusted spread" which is a weighted average spread of each bond in the index over a duration- and convexity-matched government bond.
² Source: Federal Reserve Financial Accounts (Z.1)
³ Kinnel, Russel. "Mind the Gap 2014." Morningstar. February 27, 2014. http://www.morningstar.com/advisor/t/88015528/mind-the-gap-2014.htm
4 Wirz, Matt. "New Fund Stars Ride Junk Bonds to the Top." Wall Street Journal. May 27, 2014. http://online.wsj.com/news/articles/SB20001424052702304811904579588481237539544
5 High-yield bonds comprised 29% of the Fund as of March 31, 2014.
6 Source: Federal Reserve Financial Accounts (Z.1)
Copyright 2014 Saturna Capital Corporation and/or its affiliates. All rights reserved. Vol. 8 · No. 6
Saturna Capital publishes From The Yardarm Market Commentary & Analysis monthly. To subscribe, click here.
Saturna Capital does not share subscriber information with third parties.
Important Disclaimers and Disclosures
This report is intended only for the information of the reader and is not to be used for or considered as an offer or the solicitation of an offer to sell or buy any securities or other financial instruments of any kind, including without limitation, any mutual fund or other product offered, sponsored, created, or managed by Saturna Capital Corporation or its subsidiaries or affiliates ("Saturna"). This report is not intended for distribution to, or use by, any person or entity who is a citizen or resident of, or located in, any locality, state, country, or other jurisdiction in which such distribution, publication, availability, or use would be contrary to law or regulation or which would subject Saturna to any registration or licensing requirement within such jurisdiction.
This document should not be considered as providing investment advice or services, or any other service offered by Saturna. Saturna may not have taken any steps to ensure that the securities referred to in this report are suitable for any particular investor. Saturna will not treat recipients as its customers by virtue of their reading or receiving the report.
Nothing in this report constitutes investment, legal, accounting, or tax advice or a representation that any investment or strategy is suitable or appropriate to a particular investor's circumstances or otherwise constitutes a personal recommendation to any investor. Saturna does not offer advice on the tax consequences of any investment.
All material presented in this report, unless specifically indicated otherwise, is under copyright to Saturna. None of the material, nor its content, nor any copy of it, may be altered in any way, transmitted to, copied, or distributed to any other party without the prior express written permission of Saturna. Unless otherwise indicated, all trademarks, service marks, and logos used in this report are trademarks or service marks of Saturna.
The information in this report was obtained from sources Saturna believes to be reliable, and Saturna believes the information and opinions in the material are accurate and complete as of the date of this material. However, information and opinions contained herein will change over time and without notice. Saturna has no obligation to update or amend any information or opinions at any time. Saturna makes no representations as to the accuracy or completeness of this material, nor does it have any responsibility to ensure that any other materials, including any containing materially different information, are brought to the attention of any recipient of this report.
Under no circumstances shall Saturna, its employees, or any affiliate be responsible for any investment decision by any recipient. This material is distributed on condition that it will not form the sole basis or a sufficient basis for any investment decision by any recipient. Any recipient who is not a market professional or institutional investor should seek the advice of an independent financial adviser prior to making any investment based on this report or for any necessary explanation of its contents.
Saturna does not provide tax, legal, or accounting advice. Investors should consult their own tax, legal, and accounting advisers before engaging in any transaction. In compliance with IRS requirements, recipients are notified that any discussion of US federal tax issues contained or referred to herein is not intended or written to be used for the purpose of (A) avoiding penalties that may be imposed under the Internal Revenue Code; nor (B) promoting, marketing, or recommending to another party any transaction or matter discussed herein.
The Dow Jones Industrial Average is a price-weighted index of 30 of the largest, most widely held US stocks. The S&P 500 is an index comprised of 500 widely held common stocks considered to be representative of the US stock market in general. The Russell 1000 Growth index is a widely recognized index of large-cap growth stocks. The Russell 2000 Index is comprised of US small cap stocks and measures the performance of the 2,000 smallest US companies in the Russell 3000 Index. The NASDAQ Composite index measures the performance of more than 5,000 US and non-US companies traded "over the counter" through the National Association of Securities Dealers Automated Quotation system. The MSCI EAFE Index, produced by Morgan Stanley Capital International, measures the equity market performance of developed markets in Europe, Australasia, and the Far East. The MSCI Emerging Markets Index, produced by Morgan Stanley Capital International, measures equity market performance in over 20 emerging market countries. Barclay's Capital US Aggregate Bond Index measures the performance of the US bond market. The BofA Merrill Lynch (BAML) US High Yield Index tracks the performance of US-dollar-denominated below-investment-grade corporate debt publicly issued in the US domestic market. The BAML 5-7 Year US Treasury Index is a subset of the BAML US Treasury Index including all securities with a remaining term to final maturity greater than or equal to 5 years and less tan 7 years. The BAML US Treasury Index tracks the performance of US dollar denominated sovereign debt publicly issued by the US government in its domestic market.
Past performance does not imply or guarantee future performance, and no representation or warranty, express or implied, is made regarding future performance. The price for, value of, and income from any of the securities or financial instruments mentioned in this report can fall as well as rise. The value of foreign securities and financial instruments is subject to exchange rate fluctuations that may have a positive or negative effect on the price or income of such securities or financial instruments. Investors in securities such as American Depositary Receipts — the values of which are influenced by currency volatility — effectively assume this risk.
Please consider an investment's objectives, risks, charges, and expenses carefully before investing. To obtain this and other important information about the Amana, Sextant and Idaho funds in a current prospectus or summary prospectus, please visit www.saturna.com or call toll free 1-800/SATURNA. Please read the prospectus or summary prospectus carefully before investing.
The Amana, Sextant and Idaho Tax-Exempt Funds are distributed by Saturna Brokerage Services, member FINRA /SIPC. Saturna Brokerage Services is a wholly-owned subsidiary of Saturna Capital Corporation, adviser to the Amana, Sextant and Idaho Tax-Exempt Funds.