Corporate Bonds Offer Opportunities in the Slowing Economy
The past six months have seen tremendous change in the macro landscape, with precipitous falls in oil and commodities prices. This has resulted in large declines in headline inflation, enabling a fresh wave of global central bank easing. After nearly one- and-a-half years of a stable and historically low cash rate, the Reserve Bank of Australia (RBA) joined the party and cut interest rates in February ‘to support aggregate demand’. Corporate investment (ex-mining), a key to the economy rebalancing away from the resources sector, has remained benign, and the latest reporting season suggests that it is not likely to increase significantly for some time and, in fact, that cost-cutting remains the focus for many companies.
While the lack of corporate leveraging and investment may provide a macro headwind to economic growth and, hence, future prospects for equity investors, from a creditor’s perspective, this can be a positive because it should keep credit metrics relatively healthy. In fact, PIMCO’s bottom-up analysis has helped identify several opportunities, even within the resources sector, where strong balance sheets, competitive industry positions and sound management build a compelling case for credit investors despite the challenging period ahead.
What is driving the ‘lack of animal spirits’?
After a lengthy neutral policy stance and a historically low cash rate of 2.50%, the RBA seems to have taken a rather drastic turn relative to its own communications in December and surprised the market with a 25 basis points (bps) cut in February. Furthermore, while it kept the rate unchanged at 2.25% in March, it clearly signaled an ongoing easing bias.
Having again downgraded its growth and inflation forecasts in the latest Statement of Monetary Policy (SoMP), the RBA is clearly losing confidence in both the level and durability of the non-mining recovery and its ability to offset the drop in mining investment that is expected this year and next. Because they are a result of a positive supply shock, lower commodity and energy prices are likely to be relatively long-term, increasing the likelihood of a persistent decline in mining investment, particularly for more marginal projects, which are no longer economically viable.
One of the RBA’s goals is to set accommodative monetary policy sufficient to support aggregate demand so that corporates in the non-mining sector will invest; this would help support the economy via multiplier effects ‒ for example, additional employment ‒ and help the economy transition away from dependence on mining investment. However, despite the rate cut to a historically low level of 2.5% in mid-2013, the response from the consumer and businesses has been disappointing.
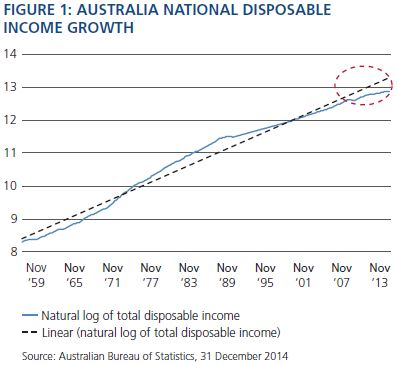
While the RBA has attributed this to a ‘lack of animal spirits’, a closer look at the macro data provides some clues as to why this response has been lacking. First, the fall in key commodity exports has weighed on disposable income growth, which has slowed from its long-term upward trend (see Figure 1).
This means that despite moderate headline GDP growth of 2%‒2.5%, in per capita terms Australia is actually experiencing a more sobering period (see Figure 2).
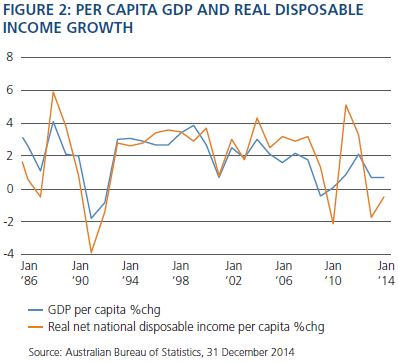
In fact, the change in per capita GDP (blue line) is running at 0.7% relative to its long-term trend of 1.9%, and per capita real net national disposable income is actually contracting (red line). That is to say, Australia is getting less income for the things it produces, so 2.5% GDP growth isn’t what it used to be!
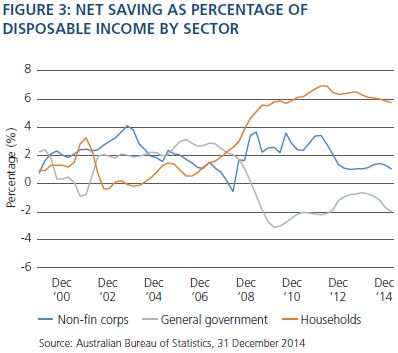
As a result, households have taken a more cautious approach to spending, and the lack of strong demand has restrained corporate leveraging. This is evident in the sector balances for the economy (see Figure 3): Consumers have clearly changed their savings habits since the financial crisis. Two other things are evident from Figure 3. First, despite the RBA’s easing in mid-2013, the consumer has only very marginally drawn down savings. Second, in response to the persistently conservative consumer, corporates (blue line) have also kept their savings relatively stable for the past two years rather than invest and leverage up as they did in the more bullish period of 2003 to late 2007. In addition, both state and federal governments have been committed to improving their balance sheet positions and reducing their deficits. In short, an economy in which every sector tries to save means spending – and, hence, demand – will remain below trend.
Historically, corporate leveraging and investment lag growth. Corporates need to see not only positive growth but also an overall high level of demand before they have the certainty to commit capital to long-term investment. Therefore, the risk of tolerating positive but sub-trend growth is that aggregate demand is insufficient to engage ‘animal spirits’. Ironically, as long as the RBA ensures that a more severe slowdown is avoided, the lack of capital expenditure (capex) intentions should keep corporate credit metrics more subdued and provide opportunities for investors in Australian credit.
The bottom-up perspective: recent corporate results
The reporting season for the period ended 31 December 2014 reflected the ongoing theme of weak-to-benign aggregate demand, with corporate Australia again focusing on cost efficiencies by reducing spending at both the operational and investment levels, which inevitably has spillover effects into the broader macro outlook for Australia.
Company operating profits were down 0.2% quarter-on-quarter; this was significantly weaker than the market expectation of a 0.5% rise. Inventories were down 0.8% for the same period, much weaker than the market expectation of a 0.1% decline, and are estimated to detract around 0.7 percentage points from quarterly GDP growth.
The drop-off in private capital expenditure will likely start to accelerate in 2015–2016. This is in line with what PIMCO is seeing at the company level, with capital expenditure intentions holding up somewhat through fiscal year 2014–2015 but drastically slashed in fiscal year 2015–2016. Of note, we see this dynamic across all sectors, not just the energy and resources sectors, which have been the high-profile affected sectors given the downward spiral of commodity prices and the drop in demand. Focus at the company level, across the board, remains on cost control. (For an analysis of individual company results, see our ‘Case Studies’.)
Looking ahead to capex and investment intentions
The December quarterly data recently released by the Australian Bureau of Statistics continue to highlight the risks in the economy and the corporate sector. Private new capital expenditure (actual expenditure) in the December quarter was down 2.2% quarter-on-quarter, and has now declined 3.6% from a year ago; this is worse than the market expectation of a 1.6% quarter-on-quarter decline.
The components of the quarterly result demonstrate that rebalancing of investment has been occurring. However, the more forward-looking investment intentions data for 2015–2016 suggest that this rebalancing may begin to stall in the second half of 2015.
For 2015–2016, investment intentions (first estimate) were more concerned with weakness across the board when compared with the first estimates in 2014–2015. Compared with this time last year, ‘Other Selected Industries’ investment is expected to be 1.8% lower. Manufacturing investment levels are forecast to be 11.9% lower – this suggests these sectors are less optimistic about 2015–2016 than they were about 2014–2015. Mining investment intentions are down radically, but this is to be expected as projects are completed. Obviously, with commodity prices falling, very few additional projects will be coming online.
First estimates of investment intentions are always the least reliable, but as a starting point, there is no evidence of any sustained bounce back in non-mining investment. Combine that with the data on ASX-listed companies and their capital investment intentions and the data point to weakness in both mining and non-mining investment in 2016. Additionally, we have not seen a pickup in small business lending.
Also depressing capital expenditure and investment is that public infrastructure projects are not scheduled to take off until 2016, and are now mostly concentrated in the state of New South Wales given the political swings in Victoria and Queensland.
Case Studies: Focus On Cost Control Across Corporate Sectors
We expect earnings from bulk commodities and liquid natural gas (LNG) producers will be lower in the months ahead. Write-downs will likely become an obviously recurring feature.
In its latest results, Santos, for example, reported significant oil-and-gas write-downs of A$1.16 billion, which led to a reported statutory full-year after-tax loss of A$935 million. Write-downs may not have macro consequences directly, but they reinforce the view that capex will be sharply curtailed and cost-control the focus – which ultimately translates to further labor shedding. Santos has cut headcount by 520 as part of its goal to achieve a targeted 10% reduction in unit cash costs, taking that from 2014’s A$16.0 barrel-of-oil equivalent (boe) down to A$14.20–$14.60 boe. On the capital expenditure side, Santos had announced late last year a A$0.7 billion cut to its 2015 capital expenditure budget, taking it down to A$2.0 billion and well below 2014’s A$3.6 billion. Other key strategies to achieve this target include reduced supplier costs (5%–30% reductions negotiated) and decreased drilling activity.
Woodside Petroleum intends to cut spending by 20% and operating costs by 15% as the company acknowledged ‘challenging’ market conditions, which it warned may last for some time. The announcement in February of the revised business plan came as Woodside reported a 38% jump in full-year net profit on the back of record revenues and output, with the full impact of the slump in crude oil prices yet to feed through fully to its LNG sales. Full-year profit rose to US$2.41 billion, from US$1.74 billion in 2013, on revenues that rose 25% to $US 7.44 billion. Write-downs totaled US$434 million before tax, but were limited to impairments of near-term oil production assets rather than to longer-dated LNG ventures. Woodside management has been focusing on lowering cost structures in unit production costs ‒ with production costs dropping 24% per unit of oil and by 11% per unit of gas. Obviously, going forward into FY2015, the continuous improvement in business efficiencies will remain a priority in current market conditions. Woodside said it delivered US$560 million in productivity improvements in 2014, and there was “more to come” in 2015. The cuts in 2014 included 320 jobs.
As we have observed, the slash and burn is not contained to commodity-based sectors, however.
Asciano delivered a flat first-half net profit after tax of $189.7 million. But earnings fell 55.3% in the group’s bulk and automotive port services division to A$29.1 million, due to weaker haulage volumes of agricultural products and machinery used in the resources industry, including equipment moved to Western Australia’s Gorgon project. Asciano said it would further restructure the bulk division, incurring redundancy costs of A$2.5 million in the first half, and that it would take further redundancy costs in the second half of fiscal 2015. Job cuts reduced Asciano’s costs by A$32 million in the first half, with the number of full-time employees down 5% on six months earlier. The company has slashed some A$57 million total costs over the past six months as it proceeds with a long-term cost-cutting plan.
Harvey Norman, the large and iconic Australian-based retailer of electrical, computer, furniture, entertainment and bedding goods, also reported HY2015 results that exemplified cost control as the driving factor. There are more than 230 Harvey Norman stores across the globe, but Australia remains the primary market. The retailer reported overall 4% sales growth, but within the Australian franchising segment, it had only 2% sales growth and 40% EBIT growth – the driver of the bottom line was a heavy reliance on reducing operating costs. Australia is the key, as the Australian franchise EBIT represents 56% of group earnings. But the Australian operations are losing market share due to stores being shut during the period.
|
|
All investments contain risk and may lose value. References to specific securities and their issuers are for illustrative purposes only and not intended and should not be interpreted as recommendations to purchase, sell or hold such securities. PIMCO products and strategies may or may not include the securities referenced and, if such securities are included, no representation is being made that such securities will continue to be included. Investors should consult their investment professional prior to making an investment decision.
This material contains the opinions of the author but not necessarily those of PIMCO and such opinions are subject to change without notice. This material has been distributed for informational purposes only and should not be considered as investment advice or a recommendation of any particular security, strategy or investment product. Information contained herein has been obtained from sources believed to be reliable, but not guaranteed. No part of this material may be reproduced in any form, or referred to in any other publication, without express written permission. PIMCO and YOUR GLOBAL INVESTMENT AUTHORITY are trademarks or registered trademarks of Allianz Asset Management of America L.P. and Pacific Investment Management Company LLC, respectively, in the United States and throughout the world. ©2015, PIMCO.
© PIMCO