As the Federal Reserve prepares to embark on a path of interest rate policy normalization, fixed income investors are finally facing the beginning of a cycle they have feared for the better part of a decade. Yet with answers come more questions, and while investors can reasonably expect a series of Federal Funds rate increases (hereafter, “Fed Funds”), the pace, magnitude, and ripple effects on various segments of the broader fixed income market are open to interpretation. Periods of increasing interest rates, long anathema to fixed income investors, seem to be frequently misunderstood and can lead to binary and often counterproductive decision-making behavior. Here we examine the impact of rising rate environments on various fixed income investment strategies as measured by periods in which both of the following occurred: the Fed was in a tightening cycle, i.e., hiking Fed Funds, and the bond market reacted strongly, which we define as an increase in 10-Yr U.S. Treasury yields of greater than 100 bps (1%) over the course of 12 months.
Fundamentally, predicting the forward path of the Fed Funds rate is a difficult exercise driven by an unwieldy combination of dependent and independent variables. After each meeting, the Federal Open Market Committee’s Board of Governors (hereafter, “the Fed”) publish their so called “Dot Plot,” a forward-looking projection of policy rates assuming normal economic conditions. Time and history allow us the luxury of tracking the accuracy of the Fed’s interest rate predictions versus the future that actually unfolded; an unfair measuring stick, perhaps, but such is the life they’ve chosen. In Chart 1 we can see a series of end-of-year Fed Funds projections as predicted by the individual Governors during their first annual meeting of each calendar year. The titles on top indicate the meeting year, while the labels on bottom show the specific end-of-year (EOY) interest-rate predictions for the current or subsequent years (so, it is the case that end-of-year 2013 predictions were made at both the 2012 and 2013 meetings, and so forth and so on).
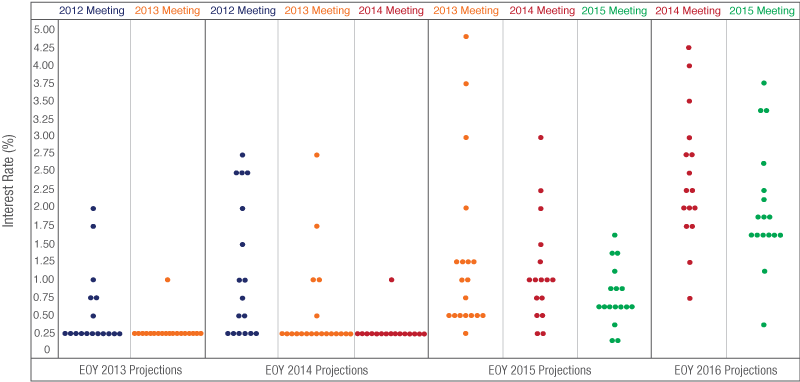
Source: Federal Reserve.
Each colored circle indicates the value (rounded to the nearest 1/8 percentage point for the 2015 meeting and to the nearest 1/4 for prior years) of an individual FOMC participant’s judgment of the appropriate level of the federal funds rate at the end of the specified calendar year.
As the data shows, even the Fed, arguably in possession of the best real-time macroeconomic data available, is frequently incorrect with its estimation of the future. Keep in mind that these are the very people who set the Fed Funds rate!
Well, if not the Fed, perhaps “the market” usually gets it right? One could likely find value in this logic, given the intense investor scrutiny and sheer amount of global capital riding on the back of policy rates. In Chart 2 the market’s historical expectations for interest rate increases are visible via snapshots of the Fed Funds futures market. Much like the “Dot Plot,” Fed Funds futures also missed the mark as shown by historical expectations for more rapid rate hikes than those that actually occurred. It seems that to trust in specific interest rate timing predictions could be folly—at least according to the recent data. More often than not, the market has likely been on the wrong side of the rates trade post–financial crisis. Needless to say, over the past several years investors positioned to avoid interest-rate risk due to a prediction of a specific Fed Funds lift-off date could have suffered significant opportunity costs if Charts 1 and 2 are to be believed.
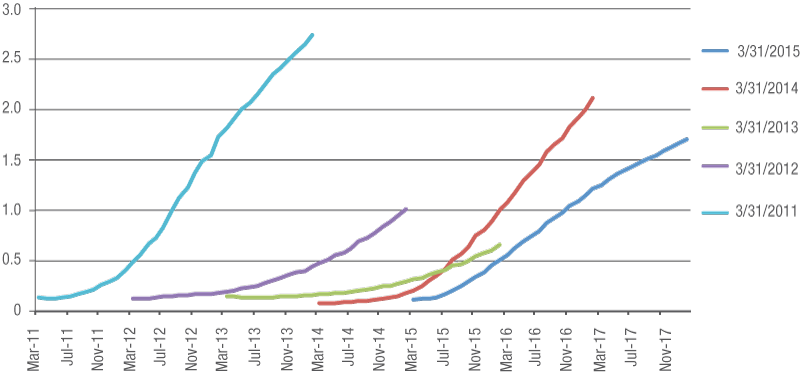
Source: Bloomberg as of 3/31/15.
If a quick look back at the Fed and the market shows us anything, it is hopefully a restatement of the obvious: attempting to predict the future is challenging. With that as a backdrop, investors must choose whether they trust in manager skill to overcome the problem of increasing interest rates by outsmarting the complicated puzzle laid out above. Some managers, mind you, have been quite successful at navigating this labyrinth in periods past. But, perhaps an alternative solution to the problem of rising rates could come from a directional investment view rather than period-specific view, and one that balances the synchronized and ever-present risks of duration, reinvestment, and liquidity.
Benefits of Laddering
Though laddered bond portfolios can be beneficial in many interest rate environments, we will specifically focus on rising rate scenarios. Generally speaking, over long time periods laddered strategies tend to perform well against barbell or bullet bond strategies. This is principally due to the following concepts; one, laddered portfolios capture price appreciation as bonds roll down the curve and their remaining life shortens; two, in a normal (upward sloping) yield curve environment laddered portfolios benefit from constantly reinvesting principal from maturing bonds into new higher-yielding bonds.
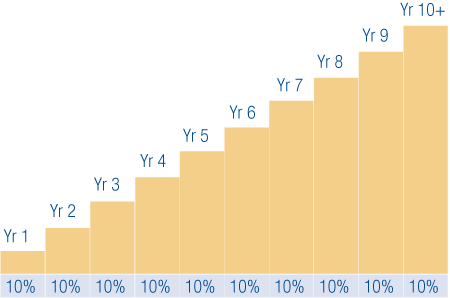
For illustration purposes only. Not representative of an actual investment.
Conceptually, in a rising rate environment a laddered bond portfolio balances the specter of price volatility vis-à-vis duration with the benefit of increasing income. While one side of the see-saw is initially weighed down by price declines, the income side eventually gains enough mass through reinvestment into higher-yielding bonds to reverse the imbalance. Furthermore, as bonds near maturity their prices accrete towards par and initial price declines dissolve.
A key element, of course, is a reasonable investment period. After all, an itchy trigger finger on the “sell” button could realize losses if liquidity is demanded at a time when bonds are trading at a loss due to increasing interest rates. It is necessary to allow enough time for bonds to do what they do—that is, pay a reliable income stream from which a predictable total return can be captured. For this reason, we examined three-year annualized returns during past periods of increasing Fed Funds target rates in Chart 4.
Since 1990, there have been four discrete periods during which the Fed raised the federal funds rate and the bond market reacted strongly, again which we define as a back-up in 10-Yr U.S. Treasury yields of greater than 100 bps over the course of 12 months. The combination of these events occurred during the following time periods:
Feb 1994–Jan 1995
Feb 1999–Jan 2000
Jun 2003–May 2004
Jul 2005–Jun 2006
We measured returns for three hypothetical bond strategies—ladder, barbell, and bullet—across these time periods using a three-year holding period. As discussed earlier, a reasonable time horizon is essential for judging the performance of a bond strategy given the offsetting effects of income and duration. The start/end points for the three-year return streams begin one year prior to the start of the 10-Yr U.S. Treasury yield increase, and end one year after the conclusion of the 12-month U.S. Treasury measurement period.
For both taxable and municipal comparisons, the barbells were weighted to exactly match the duration of the ladders in every time period. The bullet segments of the indices were selected to most closely approximate the duration of the ladders. Given the construction and segmentation of the indices, it was not possible to pick a bullet that precisely matched the duration of the ladder in every period. However, to be conservative in the analysis of performance in a rising rate environment, every comparison of a bullet to a ladder used a bullet with slightly less duration than the relevant ladder.
In Chart 4 we can see three-year annualized returns for both taxable and municipal indices, segmented by hypothetical ladder, barbell, and bullet portfolio styles. It happens that the Intermediate portion of the Barclays U.S. Aggregate Index functions as a hypothetical laddered portfolio (note: not the general Barclays U.S. Aggregate Index, but specifically the Barclays Intermediate U.S. Aggregate). Weights across 1–10 year maturities average approximately equal weights, give or take some fluctuations at the margin. To compare laddered strategies with barbell and bullet strategies, we selected the 1–3 year portion of the U.S. Aggregate combined with the 7–10 year portion for the barbell, and the 3–5 year standalone portion for the bullet. These elements of the U.S. Aggregate were chosen for the barbell and bullet strategies because they most closely matched the duration of the laddered strategy.
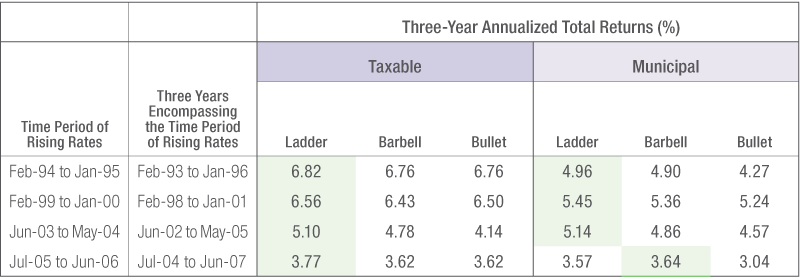
Source: FactSet and Thornburg Investment Management, 2015.
Periods of rising rates were defined as times when the Fed raised the Federal Funds rate and the 10-Year U.S. Treasury yield increased over 100 bps during the course of 12 months. To capture an appropriate time horizon, we examined returns over the three years encompassing the rising rates period. Annualized total returns assume all dividends were reinvested. The top performing strategy is highlighted.
On the municipal side, a similar methodology was used. The Bank of America Merrill Lynch 1–12 Year Municipal Index functions as a hypothetical ladder given the reasonable dispersion of bond maturities across the respective years of the index. To most closely match the duration of the ladder, the 1–3 year and 7–12 year portions of the same index were combined to create the barbell, and the 3–7 year standalone portion was used to simulate a bullet strategy.
Results
Taxable laddered portfolios, as portrayed by the Barclays Intermediate U.S. Aggregate Index, outperformed the barbell and bullet versions described above across all time periods. Municipal laddered portfolios outperformed the bullet version of the Bank of America Merrill Lynch 1–12 Year Municipal Index in all time periods, and outperformed the barbell strategy in all but one time period, with July 2004–June 2007 being the lone exception.
Conclusions
It appears that across almost all time periods examined the laddered portfolios’ ability to benefit from reinvestment opportunities in an increasing interest rate environment, while mitigating interest rate risk, led to outperformance. Additionally, a seemingly simple yet important data point shows that at a basic level, the strategy was able to generate robust annualized positive returns during each historical time period. Thus, in spite of concern to the contrary, it does appear that bonds can produce absolute positive returns even during relatively volatile market environments driven by increasing interest rates. Perhaps there is some comfort in the evidence that investors can hold bonds for their typical role in an asset allocation, that being one of ballast for the overall portfolio and a counter-balance to risk assets, and yet not suffer the feared drawdown in a typical rising rate scenario.
In this case, we see that income can drive absolute positive total return in the face of duration-related headwinds. One could argue that income, itself being the most predictable component of total return given that every bond has a stated coupon but not a stated capital appreciation component, should be desired by investors whether they intend to spend it or not. After all, income earned but not spent simply compounds in future periods, contributing to additional total return. Furthermore, a bond strategy that can seize upon ever-improving income investment opportunities can lead to benefits in a rising rate environment as shown by the relative outperformance of the laddered strategies. n
IMPORTANT INFORMATION
The views expressed by Mr. Yafa reflect his professional opinions and are subject to change. Under no circumstances does the information contained within represent a recommendation to buy or sell any security.
The Barclays Intermediate U.S. Aggregate Bond Index measures the investment grade, U.S. dollar-denominated, fixed-rate taxable bond market with maturities between one and ten years. The index includes Treasuries, government-related and corporate securities, MBS (agency fixed-rate and hybrid ARM pass-throughs), ABS and CMBS (agency and non-agency).
The Barclays U.S. Aggregate Bond Indices measure the investment grade, U.S. dollar-denominated, fixed-rate taxable bond market with maturities between the specified periods. The indices include Treasuries, government-related and corporate securities, MBS (agency fixed-rate and hybrid ARM pass-throughs), ABS and CMBS (agency and non-agency).
The BofA Merrill Lynch Municipal Securities Indices used in this study are subsets of the BofA Merrill Lynch U.S. Municipal Securities Index including all securities with a remaining term to final maturity as specified (1-12 years, 1-3 years, 7-12 years, or 3-7 years).
The BofA Merrill Lynch U.S. Municipal Securities Index, or Municipal Master Index, tracks the performance of U.S. dollar denominated investment grade tax-exempt debt publicly issued by U.S. states and territories, and their political subdivisions, in the U.S. domestic market. Qualifying securities must have at least one year remaining term to final maturity, at least 18 months to final maturity at the time of issuance, a fixed coupon schedule, and an investment grade rating (based on an average of Moody’s, S&P and Fitch). The performance of any index is not indicative of the performance of any particular investment. Unless otherwise noted, index returns reflect the reinvestment of income dividends and capital gains, if any, but do not reflect fees, brokerage commissions or other expenses of investing. Investors may not make direct investments into any index.
Barbell Structure – A bond investment strategy that concentrates holdings in shorter-term and longer-term maturities, forming a structure that resembles a barbell.
Basis Point (bp) – A unit equal to 1/100th of 1%. 1% = 100 basis points (bps).
Bullet Structure – A bond investment strategy that concentrates holdings in intermediate-term maturities and avoids shorter-term or longer-term maturities.
Duration – A bond’s sensitivity to interest rates. Bonds with longer durations experience greater price volatility than bonds with shorter durations.
Fed Funds Rate – The interest rate at which a depository institution lends immediately available funds (balances at the Federal Reserve) to another depository institution overnight.
Ladder Structure - A bond investment strategy that involves building a portfolio of bonds with staggered maturities so that a portion matures each year. Money that comes in from maturing bonds is typically invested in bonds with longer maturities at the far end of the portfolio.
Yield Curve – A line that plots the interest rates, at a set point in time, of bonds having equal credit quality, but differing maturity dates.
The laddering strategy does not assure or guarantee better performance than a non-laddered portfolio and cannot eliminate the risk of investment losses.
Thornburg Funds are distributed by Thornburg Securities Corporation.
Investments in the Funds carry risks, including possible loss of principal. Funds investing in bonds have the same interest rate, inflation, and credit risks that are associated with the underlying bonds. The principal value of bonds will fluctuate relative to changes in interest rates, decreasing when interest rates rise. Unlike bonds, bond funds have ongoing fees and expenses. Investments in the Funds are not FDIC insured, nor are they deposits of or guaranteed by a bank or any other entity.
Before investing, carefully consider the Fund’s investment goals, risks, charges, and expenses. For a prospectus or summary prospectus containing this and other information, contact your financial advisor or visit thornburg.com. Read them carefully before investing.
© 2015 Thornburg Investment Management, Inc. | 2300 North Ridgetop Road | Santa Fe, New Mexico 87506 | 877.215.1330