Time for our annual August report called “Charts for the beach”. After applying SPF 30, take a look at five of our favorite charts that highlight what we think consensus is currently missing. Don’t forget suntan lotion on the ears!
Credit-related asset classes
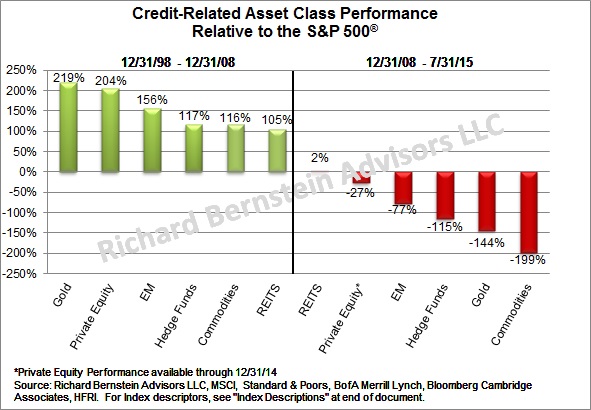
Our first chart shows the relative performance of credit-related asset classes during the gradual inflation of the global credit bubble (1998-2008) versus the relative performance since the credit bubble started to deflate (2008- today). It makes sense that the asset classes most sensitive to credit creation would outperform as the credit bubble inflated, but we continue to believe that these asset classes should generally be avoided as the bubble deflates.
Chart 1:
MLP bear market
Energy and commodities are credit-related asset classes (see Chart 1) and have significantly underperformed as the credit bubble deflated. It is curious though that investors have thought that MLPs would be immune. MLPs are now in a bear market with some of the highest quality MLPs leading the decline (weren’t they supposed to be the ones least effected by the fall in the commodity price?). The MLP industry has been free cash flow negative for some time, which questions the companies’ abilities to continue growing, maintain distributions, or both. The recent volatility has wiped out about four years of dividend payments, yet investors generally seem complacent (see Chart 2).
Chart 2:
MLPs are in a Bear Market
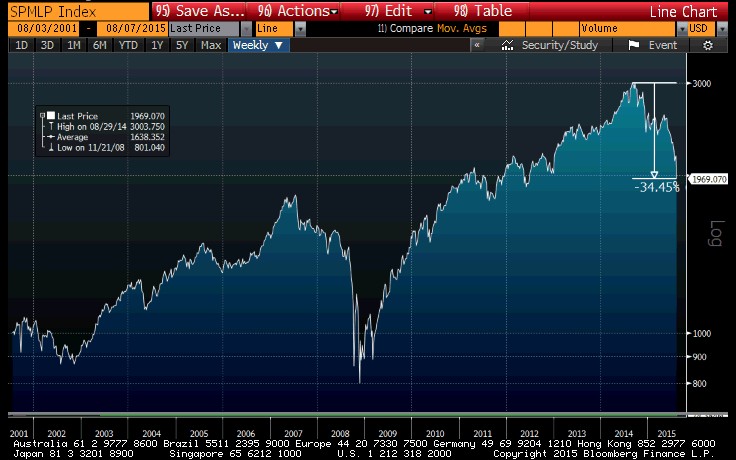
Source: Bloomberg, LP
China reserves
We have long thought that China’s demographics would ruin their long-term growth story, but investors have chosen to ignore that secular issue. Investors in China may be ignoring another important long-term problem. Our theme of a “Wal-Mart World” is based on global overcapacity, the lowering of prices, and the resulting fight for market share. Our overweight of Japan in our portfolios reflects that Japan seemed to be the first country to recognize the Wal-Mart World and significantly depreciated the Yen. Since we took our initial positions, the Yen has depreciated about 65% versus the US dollar.
Despite recent events, China can’t drastically depreciate their currency and compete in a Wal-Mart World for two reasons: 1) The world would raise trade barriers and add tariffs to Chinese goods if China depreciated the Yuan to any significant extent. Japan can easily depreciate the Yen because, unlike twenty years ago, no one considers Japan a threat anymore. China is now considered the threat, and any depreciation could have significant political ramifications. 2) Chinese companies have issued dollar-denominated debt. Depreciating the Yuan implies a larger proportion of corporate cash flows would necessarily go to debt payments. Chinese companies’ profitability isn’t strong, and increasing debt service payments would exacerbate the corporate sectors’ problem.
The result is that China is attempting to keep the Yuan reasonably stable, but not be uncompetitive in the Wal-Mart World. They’re trying to have the best of both worlds, and they are doing this by selling their reserves for the first time (see Chart 3). China has large reserves and this can go on for quite some time. However, the selling of their reserves is likely to grow exponentially as the domestic economy’s woes compound.
Chart 3:
China’s Reserves are beginning to decline
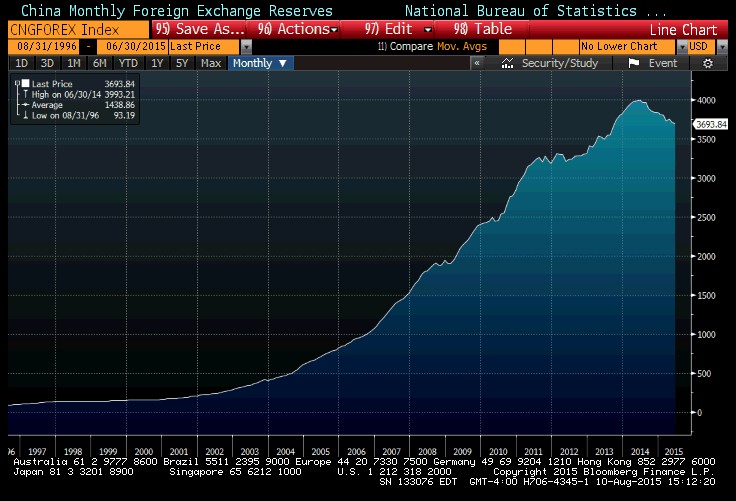
Source: Bloomberg LP
Equities anyone?
The US bull market is more than six years old, but investors haven’t yet embraced it. Recent mutual fund flow data continue to show that investors are habitually selling US equity funds, but buying non-US equity funds. Anyone with the smallest contrarian streak must be fascinated by these trends. (See chart 4)
Chart 4:
Domestic Equity Rolling 12-Month Net Flows vs. World ex-US Equity Rolling 12-Month Net Flows
(March 2009 - July 2015)
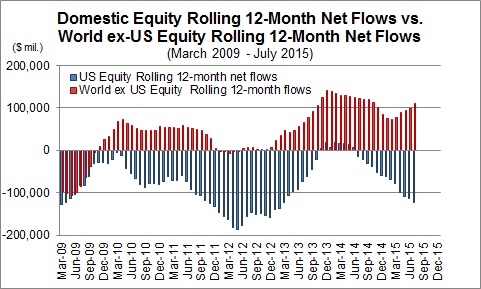
Source: Richard Bernstein Advisors LLC, Investment Company Institute (ICI)
Wal-Mart World implies lower not higher prices
It’s hard to get inflation when countries are depreciating their currencies in hopes of gaining market share. Basic business school courses point out that fights for market share are typically deflationary, and not inflationary. Rarely does a company gain market share by raising prices. Admittedly, there are some exceptions when companies successfully gain market share when raising prices by attempting to denote a higher quality or unique product. However, this rarely happens with mass market items.
The result has been disinflation despite the significant monetary stimulus that so many investors are worried about. Chart 5 shows that this is happening in many countries. The chart compares monetary growth to inflation. Some EM countries have inflation problems, but the majority of countries are experiencing very mild inflation.
We’ve said for years the correct question wasn’t whether the US would turn out like Japan (i.e., mired in slow growth and possible deflation). The correct question is whether the entire world turns out to be like Japan.
Chart 5:
Global Growth in Money Supply* vs. Inflation Rate
( latest available as of 7/31/2015 )
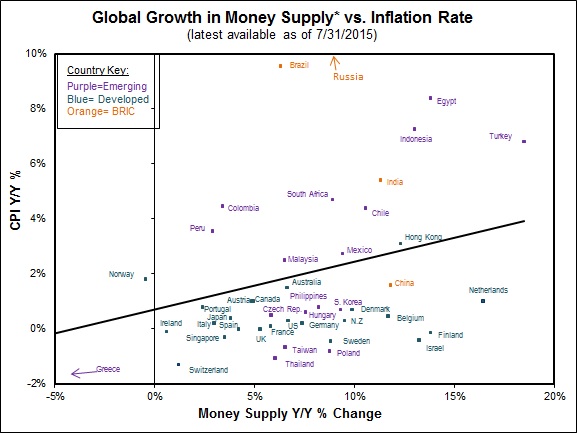
Source: Richard Bernstein Advisors LLC, Bloomberg *Money Supply defined as M2 (or M3, if M2 not available, or IMF Currency Issued by Monetary Authority in National Currency, for EMU countries).
INDEX DESCRIPTIONS:
The following descriptions, while believed to be accurate, are in some cases abbreviated versions of more detailed or comprehensive definitions available from the sponsors or originators of the respective indices. Anyone interested in such further details is free to consult each such sponsor’s or originator’s website.
The past performance of an index is not a guarantee of future results.
Each index reflects an unmanaged universe of securities without any deduction for advisory fees or other expenses that would reduce actual returns, as well as the reinvestment of all income and dividends. An actual investment in the securities included in the index would require an investor to incur transaction costs, which would lower the performance results. Indices are not actively managed and investors cannot invest directly in the indices.
US Dollar: InterContinentalExchange (ICE) US Dollar Index (DXY). The ICE US Dollar Index, indicating the general international value of the USD, averages the exchange rates between the USD and six major world currencies, using rates supplied by some 500 banks.
Gold: Gold Spot USD/oz Bloomberg GOLDS Commodity.
The Gold Spot price is quoted as US Dollars per Troy Ounce.
Commodities: S&P GSCI® Index. The S&P GSCI® seeks to provide investors with a reliable and publicly available benchmark for investment performance in the commodity markets, and is designed to be a “tradable” index. The index is calculated primarily on a world production-weighted basis and is comprised of the principal physical commodities that are the subject of active, liquid futures markets.
REITS: THE FTSE NAREIT Composite Index. The FTSE NAREIT Composite Index is a free-float-adjusted, market- capitalization-weighted index that includes all tax qualified REITs listed in the NYSE, AMEX, and NASDAQ National Market.
Hedge Fund Index: HFRI Fund Weighted Composite Index. The HFRI Fund Weighted Composite Index is a global, equal-weighted index of over 2,000 single-manager funds that report to the HFR (Hedge Fund Research) database. Constituent funds report monthly net-of-all-fees performance in USD and have a minimum of $50 million under management or a twelve (12)-month track record of active performance. The Index includes both domestic (US) and offshore funds, and does not include any funds of funds.
Private Equity: The Cambridge Associates LLC U.S. Private Equity Index®. The Cambridge Associates LLC U.S. Private Equity Index® is an end-to-end calculation based on data compiled from 986 U.S. private equity funds (buyout, growth equity, private equity energy and mezzanine funds), including fully liquidated partnerships, formed between 1986 and 2012. Pooled end-to-end return, net of fees, expenses, and carried interest.Historic quarterly returns are updated in each year- end report to adjust for changes in the index sample.
S&P 500®: Standard & Poor’s (S&P) 500® Index. The S&P 500® Index is an unmanaged, capitalization-weighted index designed to measure the performance of the broad US economy through changes in the aggregate market value of 500 stocks representing all major industries.
MLPs: The S&P MLP Index : The S&P MLP Index provides investors with exposure to the leading partnerships that trade on the NYSE and NASDAQ and includes both Master Limited Partnerships (MLPs) and publicly traded LLC’s, which have similar legal structure to MLPs and share the same tax benefits.
China Foreign Exchange Reserves: China Monthly Foreign Exchange Reserves, National Bureau of Statistics of China. International reserves are liquid assets held by a country’s central bank or other monetary authority in order to implement monetary policies effecting the country’s currency exchange rate and ensuring the payment of its imports. The assets include foreign currency and foreign denominated bonds, gold reserves, SDRs (special drawing rights) and the IMF reserve position.
© Copyright 2015 Richard Bernstein Advisors LLC. All rights reserved. PAST PERFORMANCE IS NO GUARANTEE OF FUTURE RESULTS
Nothing contained herein constitutes tax, legal, insurance or investment advice, or the recommendation of or an offer to sell, or the solicitation of an offer to buy or invest in any investment product, vehicle, service or instrument. Such an offer or solicitation may only be made by delivery to a prospective investor of formal offering materials, including subscription or account documents or forms, which include detailed discussions of the terms of the respective product, vehicle, service or instrument, including the principal risk factors that might impact such a purchase or investment, and which should be reviewed carefully by any such investor before making the decision to invest. Links to appearances and articles by Richard Bernstein, whether in the press, on television or otherwise, are provided for informational purposes only and in no way should be considered a recommendation of any particular investment product, vehicle, service or instrument or the rendering of investment advice, which must always be evaluated by a prospective investor in consultation with his or her own financial adviser and in light of his or her own circumstances, including the investor's investment horizon, appetite for risk, and ability to withstand a potential loss of some or all of an investment's value. Investing is subject to market risks. Investors acknowledge and accept the potential loss of some or all of an investment's value. Past performance is, of course, no guarantee of future results. Views represented are subject to change at the sole discretion of Richard Bernstein Advisors LLC. Richard Bernstein Advisors LLC does not undertake to advise you of any changes in the views expressed herein.


