Volatility is back. August was one of the worst months for the global financial markets in a long time. The key investment question, however, is whether the fundamentals justify the level of volatility. The hackneyed answers regarding valuation and speculation are very unsatisfying to us largely because such claims have been made for seven years. Outside of social media, US energy, high-end real estate, and some EM countries’ debt and equity, the objective data don’t support contentions regarding wild speculation.
Our corporate motto is Uncertainty = Opportunity®. With that motto in mind, we offer several considerations when reviewing asset allocations.
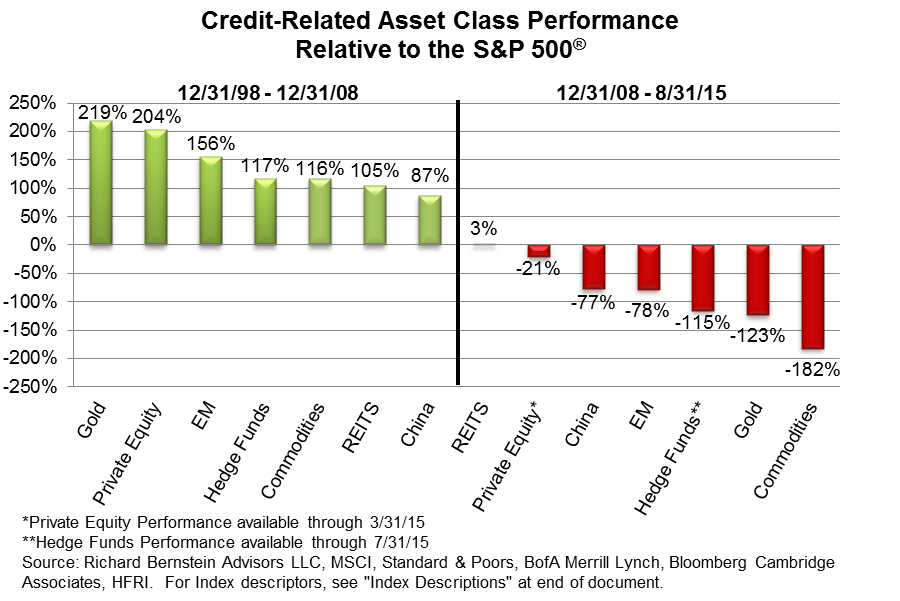
The RBA broken record: avoid credit-related asset classes
Investors seem to be confusing symptoms with problems. One takes an aspirin for a headache, and the headache goes away, but one has only alleviated the symptom (the headache) and has done nothing to treat the underlying problem that caused the headache. Did the headache occur because one was sleep deprived, overly tense, or perhaps because of a more serious issue? The headache was the symptom of some other problem.
Discussions today regarding the causes of market volatility seem to be similarly confusing symptoms with problems. The recent underperformance of China, energy, commodities, emerging market debt and equity, MLPs, and other assets are often attributed to issues within those specific markets. However, we would argue that these are symptoms being confused for the problem. The more important underlying problem is the on-going deflation of the global credit bubble.
Asset classes that secularly outperformed plain old-fashioned stocks as the global credit bubble inflated from 1998-2008 have been underperforming since the credit bubble started to deflate (see Chart 1). The recent volatility seems to be the first realization of this secular change in the global economy. Despite that it began seven years ago, investors seem to be just starting to understand that a sea change is underway within the global economy.
A bad mix: Fed tightening and weak earnings
There have been many studies that demonstrate bull markets tend to continue during the early phases of a Fed tightening cycle. Although that historical relationship is encouraging for the current bull market, few studies have investigated why that historical relationship exists.
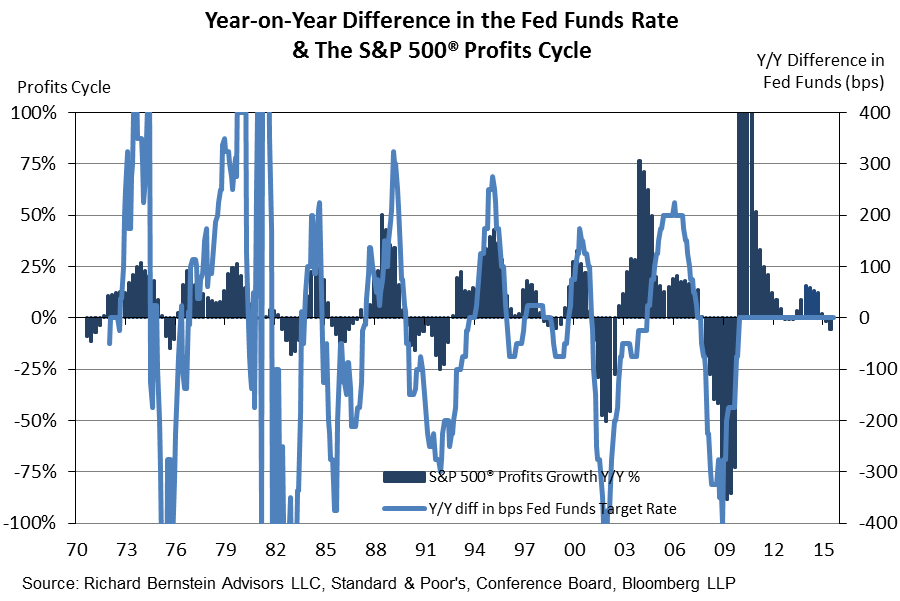
The correlation between changes in the Fed Funds rate and the profits cycle has historically been quite high (See Chart 2). In other words, profits were normally revving up when the Fed began to raise interest rates. Higher rates are always an incremental negative for the stock market. However, the correlation between rate cycles and profits cycles suggests that the equity market has initially shrugged off the incremental negative of rising rates because the incremental positive of improving earnings is more powerful. The probability of a bear market increases when the Fed increases rates faster than the improvement in earnings growth.
This chart shows how unusual the past several years have been because the Fed did not raise rates as the profits cycle accelerated. The Fed now risks being wrong footed, and the problem for the stock market today is the Fed is “threatening” to raise interest rates at a time when S&P 500® earnings growth is actually negative. We’ve been concerned for many months that the recipe for the much-anticipated correction could be the Fed hiking rates when earnings growth was negative. If the Fed pushed off raising rates until December or early next year and the profits cycle reaccelerated by that time, then the tightening cycle would seem more normal. For now though, the correction can be easily explained by the unusual combination of tightening monetary policy and negative earnings growth.
Secular bull market so far seems intact
Despite the risk of an on-going correction in stocks, we believe that the secular US bull market remains intact. Here are several factors behind our reasoning:
- 1) Investors have never fully embraced US stocks throughout the bull market. The data clearly show that individual investors, institutional investors, hedge funds, and Wall Street strategists have never favored US stocks throughout the entire bull market. We find it hard to believe, as some have claimed, that US stocks are extremely overvalued because sentiment has been and remains very conservative. Who exactly is boosting valuations to extremes if no group of investors is over-enthusiastic about stocks?
- 2) Private equity (PE) funds have been sizeable investors in public stocks, and the recent valuation contraction might spur further investment. We have highlighted that PE firms are flush with capital and have been taking the public market private. Preqin, the PE research firm, has pointed out that there are now more than twice as many US companies in PE portfolios than are listed on US exchanges. (It seems very ironic that investors have shunned public equities as being too risky only to invest in PE funds which have bought the same public equities and then charged investors higher fees and offered them limited liquidity.)
- 3) The problems in emerging economies may actually stimulate the US economy. We continue to believe that the US economy will “feast” on the problems in the emerging economies. Lower energy prices, lower commodity prices, pressure on nominal wage rates (although real wages are likely to increase) might all stimulate the US economy.
- 4) The world is awash in productive capacity, and that overcapacity is the cause of, what we have called, the Wal-Mart World. Countries are devaluing their currencies and fighting for market share. Market share battles typically involve cutting prices, and undercutting the competition. We still think portfolios should be positioned for disinflation rather than inflation.
Uncertainty = Opportunity®
“If it bleeds, it leads” is a saying in journalism. Because headlines need to attract attention, melodramatic stories tend to get more front page space or more air time. The goal, of course, is to sell more newspapers or more advertising time.
The current volatility in the global financial markets is great fodder for the media. However, investors must ignore the drama and be as objective as possible.
We look upon the recent turmoil as an opportunity. We will undoubtedly reject some investments because the deterioration in fundamentals justified those assets’ volatility. However, we think some assets are significantly mispriced relative to fundamentals, and will position our portfolios accordingly.
INDEX DESCRIPTIONS:
The following descriptions, while believed to be accurate, are in some cases abbreviated versions of more detailed or comprehensive definitions available from the sponsors or originators of the respective indices. Anyone interested in such further details is free to consult each such sponsor’s or originator’s website.
The past performance of an index is not a guarantee of future results.
Each index reflects an unmanaged universe of securities without any deduction for advisory fees or other expenses that would reduce actual returns, as well as the reinvestment of all income and dividends. An actual investment in the securities included in the index would require an investor to incur transaction costs, which would lower the performance results. Indices are not actively managed and investors cannot invest directly in the indices.
Gold: Gold Spot USD/oz Bloomberg GOLDS Commodity. The Gold Spot price is quoted as US Dollars per Troy Ounce.
Commodities: S&P GSCI® Index. The S&P GSCI® seeks to provide investors with a reliable and publicly available benchmark for investment performance in the commodity markets, and is designed to be a “tradable” index. The index is calculated primarily on a world production-weighted basis and is comprised of the principal physical commodities that are the subject of active, liquid futures markets.
REITS: THE FTSE NAREIT Composite Index. The FTSE NAREIT Composite Index is a free-float-adjusted, market-capitalization-weighted index that includes all tax qualified REITs listed in the NYSE, AMEX, and NASDAQ National Market.
Hedge Fund Index: HFRI Fund Weighted Composite Index. The HFRI Fund Weighted Composite Index is a global, equal-weighted index of over 2,000 single-manager funds that report to the HFR (Hedge Fund Research) database. Constituent funds report monthly net-of-all-fees performance in USD and have a minimum of $50 million under management or a twelve (12)-month track record of active performance. The Index includes both domestic (US) and offshore funds, and does not include any funds of funds.
Private Equity: The Cambridge Associates LLC U.S. Private Equity Index®. The Cambridge Associates LLC U.S. Private Equity Index® is an end-to-end calculation based on data compiled from 986 U.S. private equity funds (buyout, growth equity, private equity energy and mezzanine funds), including fully liquidated partnerships, formed between 1986 and 2012. Pooled end-to-end return, net of fees, expenses, and carried interest.Historic quarterly returns are updated in each year-end report to adjust for changes in the index sample.
S&P 500®: Standard & Poor’s (S&P) 500® Index. The S&P 500® Index is an unmanaged, capitalization-weighted index designed to measure the performance of the broad US economy through changes in the aggregate market value of 500 stocks representing all major industries.
China: MSCI China Index. The MSCI China Index is a free-float-adjusted, market-capitalization-weighted index designed to measure the equity-market performance of China.
© Copyright 2015 Richard Bernstein Advisors LLC. All rights reserved.
PAST PERFORMANCE IS NO GUARANTEE OF FUTURE RESULTS
Nothing contained herein constitutes tax, legal, insurance or investment advice, or the recommendation of or an offer to sell, or the solicitation of an offer to buy or invest in any investment product, vehicle, service or instrument. Such an offer or solicitation may only be made by delivery to a prospective investor of formal offering materials, including subscription or account documents or forms, which include detailed discussions of the terms of the respective product, vehicle, service or instrument, including the principal risk factors that might impact such a purchase or investment, and which should be reviewed carefully by any such investor before making the decision to invest. Links to appearances and articles by Richard Bernstein, whether in the press, on television or otherwise, are provided for informational purposes only and in no way should be considered a recommendation of any particular investment product, vehicle, service or instrument or the rendering of investment advice, which must always be evaluated by a prospective investor in consultation with his or her own financial adviser and in light of his or her own circumstances, including the investor's investment horizon, appetite for risk, and ability to withstand a potential loss of some or all of an investment's value. Investing is subject to market risks. Investors acknowledge and accept the potential loss of some or all of an investment's value. Past performance is, of course, no guarantee of future results. Views represented are subject to change at the sole discretion of Richard Bernstein Advisors LLC. Richard Bernstein Advisors LLC does not undertake to advise you of any changes in the views expressed herein.
About Richard Bernstein Advisors:
Richard Bernstein Advisors LLC is an independent investment adviser. RBA partners with several firms including Eaton Vance Corporation and First Trust Portfolios LP, and currently has $3.4 billion collectively under management and advisement as of July 31, 2015. RBA acts as sub‐advisor for the Eaton Vance Richard Bernstein Equity Strategy Fund, the Eaton Vance Richard Bernstein All‐Asset Strategy Fund and the Eaton Vance Richard Bernstein Market Opportunities Strategy Fund and also offers income and unique theme‐oriented unit trusts through First Trust. RBA is also the index provider for the First Trust RBA American Industrial Renaissance® ETF and the First Trust RBA Quality Income ETF. Additionally, RBA runs ETF asset allocation SMA portfolios at UBS, Merrill Lynch, Morgan Stanley Smith Barney and on select RIA platforms. RBA's investment insights as well as further information about the firm and products can be found at www.RBAdvisors.com.


