Key takeaways
- Barring an unanticipated and enduring surge in global final demand, measured inflation likely will remain low until well into 2016, at least.
- Expectations of persistent low inflation have become embedded in the level and structure of interest rates.
- Unequivocal evidence of a stable, anchored inflation rate critical to future central-bank actions cannot yet be discerned.
- Excess global supply of labor, goods and services, productive capacity and commodities relative to demand has stifled private-sector investment, wage growth and pricing power.
- With the U.S. Federal Reserve and the Bank of England anticipating higher inflation before long, some investors have begun to consider their vulnerability to a higher price level—and how to protect their portfolios.
- Because investors’ assets and liabilities, risk tolerance and portfolio objectives differ, a single inflation-protection strategy will not be appropriate for every individual investor and type of institutional investor.
- Many different assets could, potentially, provide some protection against inflation. However, their ability to do so varies, as do their reliability and their opportunity costs.
Inflation outlook remains a tough call
Both transitory and persistent deflationary forces globally continue to complicate the performance outlook for all asset classes over the remainder of 2015 and beyond.
Despite unprecedented monetary easing in many countries, rates of headline and core consumer inflation remain stubbornly entrenched below central-bank targets. Powerful interactions between domestic and global forces in most countries continue to put downward pressure on prices in both the output and the input markets. Barring an unanticipated and enduring surge in global final demand, measured inflation likely will remain low until well into 2016, at least, even in the face of eventual temporary supply shocks.
Still, the outlook for inflation remains a tough call, especially in a globalized economy. Some long-standing economic relationships, such as the linkage between labor-market slack and labor compensation, appear to have adjusted or broken down in recent years.
According to former US Federal Reserve (Fed) Governor Frederic Mishkin, the Phillips curve has flattened, so a 1% increase in the inflation rate, from current low levels, is associated with a much larger drop in unemployment now than just 20 years ago.1 Not surprisingly, then, the sizeable decline in the US unemployment rate since 2009 (from 9.8% to 5.3% currently) has not resulted, even with a lag, in commensurate increases in wages as was the case in prior economic expansions.
Nonetheless, a July 2015 study by the San Francisco Fed concludes that sustained undershooting of the Fed’s inflation target does not signal a statistically significant “miss” after accounting for the volatility of monthly inflation rates.2 The study projects that “continued improvements in production and employment relative to their long-term trends would be expected to put upward pressure on inflation.”3
According to the Allianz Global Investors base-case scenario, US consumer price inflation will average 0.4% in 2015 and 2.3% in 2016. According to this scenario, an expected partial rebound in input prices next year will reflect modest acceleration in real economic growth in most of the developed economies. In turn, stronger consumer demand, continued labor-market tightening and mild upward pressure on wage rates likely will underpin improving cyclical strength.
A separate estimation, based on so-called “base effects,” shows a similar pattern of persistent weakness into autumn and somewhat stronger US inflation next year.4 Our inflation forecasts suggest a comparable pattern in most other developed markets, as well. (See Exhibit 1.)

Meanwhile, expectations of persistent low inflation have become embedded in the level and structure of interest rates. Money-market interest rates continue to rest near 0% in the US and much of the developed world, and at, or below, 0% in eight European countries (as of August 10, 2015). Break-even inflation rates, derived from the Treasury inflation-protected securities (TIPS) and similar “linker” markets in Europe, similarly hover at depressed levels. Inflation risk premiums built into long-term interest rates also remain at, or near, record low levels.
Partially as a consequence of muted inflation expectations, the Treasury yield curve flattened this summer, an outcome not widely anticipated by analysts and market participants only a half year ago.
Establishing the inflation anchor
Understanding the forces influencing, or even biasing, inflation rates downward plays a major role in forging inflation expectations. Several former and current Fed governors believe that the stability of expectations depends on the central bank’s strong commitment to set and maintain an “inflation anchor.”5
In 2015, that means securing a core inflation rate at, or near, a 2% annual rate and embedding that rate in the inflation expectations of investors and the public. Thus, the Fed reiterates again and again its intention to foster conditions conducive to a 2% inflation rate and sustain indefinitely its commitment to keep it there. With expectations of inflation anchored, any given shock to inflation—whether from aggregate demand, energy prices or the foreign-exchange rate—will probably have a smaller effect on expected and trend inflation.
Anchored expectations, in turn, make the economy more stable and diminish the scale and scope of actions a central bank must take to achieve price stability and maximum real economic growth. In 2015 and 2016, an anchored inflation rate would permit the Fed and, perhaps, the Bank of England (BOE) to remove monetary accommodation slowly and deliberately in response to changes in the level and trend of macroeconomic data.
However, unequivocal evidence of such an anchor cannot yet be discerned. Inflation rates in developed economies show only tentative signs of firming, led by small, but notable, increases in wages. Consequently, future monetary policy actions will depend importantly on how each policymaker interprets the pattern of recent past price increases and settles on an inflation forecast. (See Exhibit 2.)

In making that determination, policymakers and their respective staffs must distinguish between transitory and more permanent influences on inflation. Monetary policymakers typically do not change interest rates in response to transitory factors, like changes in oil and food prices, geopolitical events or natural disasters.
Instead, they look for conditions that reflect the strength of underlying real economic activity. That’s why US central bankers typically prefer core inflation measures (inflation measures that exclude price changes for food and energy) to headline measures when analyzing economy-wide price movements.
Occasionally, though, shocks to non-core (food and energy) prices do not turn out to be transitory but, instead, become persistent influences on inflation. In economist’s lingo, non-core price changes move from “exogenous,” from outside the regular interactions of demand and supply in market places, to “endogenous,” an enduring presence in the workings of markets.
Shocks that affect supply and demand meaningfully and in an enduring way can become important determinants of core inflation. Currently, for example, policymakers must quantify the extent to which oil price declines not only will affect the energy component of headline inflation data, but also put downward pressure on the prices of products derived from crude oil processing, such as synthetic fibers and tires, and the cost of business operations among, say, electric utilities, manufacturers, freight haulers and airlines.
Similarly, policymakers in, say, the US, must determine whether and to what extent international economic conditions, exogenous at first blush to the US economy, can become endogenous influences on US inflation by reducing the cost of imports or by causing the US dollar to appreciate. With trade in commodities, inputs and finished goods and services an increasingly larger segment of the US economy, actions of non-US buyers and sellers can have meaningful impacts on US inflation.
For now, at least, international trade and the strength of the US dollar appear to bias US inflation rates downward. Most critically, policymakers at the Fed and, perhaps, throughout the world, continue to monitor closely the impact of China’s economic slowdown, actions to depreciate the value of the Chinese yuan, and responses by China’s economic competitors that could place additional downward pressure on the prices of commodities and traded outputs. Similarly, economic and financial instability in much of emerging-market Asia and Latin America threaten to keep downward pressure on traded goods indefinitely.
In that context, comparisons of inflation rates at similar stages of past economic expansions have less validity than in previous cyclical expansions.
Of course, weak inflation does not result only from domestic and global cyclical economic factors. Structural, or secular, conditions also have contributed meaningfully to persistently low global inflation rates. Here are some of those conditions:
- The aging of the “baby-boom” generation and their emergence into retirement reduces the average propensity to consume.
- A lower marginal propensity to consume among 18-34 year olds than in the past.
- Continued household deleveraging that restrains credit and money-supply expansion and growth in aggregate demand.
- Widening income disparity such that middle-income workers in the US have not experienced an increase in real, after-tax income in four decades.
- A great transfer of wealth from developed-market countries to emerging-market countries, many of which have much higher saving rates.
Monetary policy alone will not be able to offset, or even influence materially, the impact of each of these downward pressures on the rate of inflation.
Dislodging the inflation anchor
To maintain an inflation anchor, central banks need to convince investors and the public that they have credibility as price stability stalwarts with clout. However, in recent months, potent cyclical forces may have disrupted the inflation expectations on which that credibility rests. Among those forces are:
- a stream of tepid increases in the core US personal consumption expenditures deflator and somewhat better, but still uninspiring, increases in the US consumer price index (CPI);
- inflation figures from Canada, Europe and other key trading partners that continue to undershoot central-bank targets;
- China’s financial-market instability and economic slowdown, as well as those in Latin America and emerging markets Asia and Russia, that materially decreases global demand for goods and services;
- collapsing prices for critical industrial and agricultural commodities, oil and gold; and
- a series of mixed US economic data reports, some revealing solid economic growth, others that reveal lingering weaknesses.
Some market-based measures of inflation expectations now reveal modestly declining inflation expectations as these and other cyclical deflationary forces become increasingly recognized.
Breakeven inflation rates over the next two- and five-year periods, as derived from TIPS spreads, have fallen by more than 60 and 40 basis points, respectively, since March 2015.6 Similarly, the two-year zero-inflation swap rate has declined some 80 basis points over the past five months.7 Declining oil prices and, perhaps, economic stresses in China, appear to have influenced all of these market-based measures of inflation expectations. (See Exhibit 3.)

On average, as well, Federal Open Market Committee (FOMC) members within the Fed have lowered their projections for inflation in concert with their similarly lower growth projections—and the range projections are consistent with modest growth in both domestic and international demand for goods and services. In turn, they reinforce the case for lower-for-longer interest rates.8
On the other hand, survey-based measures of consumer inflation expectations have changed little. According to the University of Michigan, over the July 2014–July 2015 period, the median expected long-term inflation rate among consumers surveyed was 2.7% per year, compared with 2.8% for the June 2014–June 2015 period.9 Similarly, the median submission to the June primary dealer survey placed the most likely CPI inflation outcome for the next 5-10 years at 2.25%, only 3 basis points less than a year ago and on par with the June 2013 survey.10 (See Exhibit 4.)

Monetary stimulus doesn’t guarantee inflation
Ever since Milton Friedman famously said in 1962 that “inflation is always and everywhere a monetary phenomenon,” economists have searched for a stable and reliable short-run linkage between money-supply growth and inflation. However, econometrically stable short-run linkages between inflation and money-supply growth proved elusive for the better part of the next 15 years.
During the late 1970s, though, monetary economists found that a long and variable distributed-lag relationship does exist between growth in the M-211 measure of money supply and changes in the core personal consumption expenditures (PCE) deflator.12 Stated simply, these studies found that money-supply growth above a constantly changing rate (often taken to be the rate of growth of nominal gross domestic product [GDP]), over some uncertain future time period, will result eventually in some inflation, though how much is unknown. Imprecision abounds.
Not surprisingly, then, several Fed bank presidents warned repeatedly after the most recent recession that unconventional monetary policies would eventually and inevitably set off an inflationary spiral that would force the central bank to raise interest rates prematurely.13 If such a reversal of policy would take place, it would jeopardize the sustainability of the economic recovery.
Over the past few years, however, accelerating rates of inflation never materialized. Between June 2009 and June 2015, the US core PCE deflator increased at a 1.5% compound annual rate, while the M-2 money supply rose at a 6.0% rate, despite three rounds of quantitative easing (QE). In the June 2014–June 2015 period, the PCE deflator increased even less, only 1.3%, while the money supply went up 5.8%.
Why didn’t QE result in even larger increases in money-supply growth? The answer resides in the distinction between the monetary base and the money supply.14 Fed purchases of Treasury and mortgage-backed securities did increase the monetary base directly, but their impact on the money supply was less direct and less expansionary. (See Exhibit 5.)

The bulk of the increase in the monetary base—it quadrupled between 2008 and 2013—went into excess reserves that, in turn, were deposited by depository institutions in their reserve accounts at the Fed. Some of those reserves consisted of capital inflows from Asia and other troubled economies, high-power money rendered inert as it sat on the Fed’s books and outside the global economy.
For the money supply to increase more rapidly, depository institutions needed to step up their lending. But in a period of deleveraging and tighter regulatory standards, credit expansion languished and money-supply growth did not explode. And, in the end, it is faster growth in the money supply that drives up inflation. (See Exhibit 6.)

So while base money growth in excess of underlying real economic activity may lead to inflation, such an outcome is by no means assured. As the Fed embarks on a course of policy normalization over the months ahead, look for the monetary policymakers to monitor weekly changes in money supply more closely than at any time since 1993.15
Currently, though, central bankers will continue to set conditions they believe are conducive to full employment and price stability. Nowadays, most central banks engaging in unconventional policies do this by relying mainly on provision of ample reserves to the banking and financial systems to sustain extremely low interest rates and keep money and financing markets amply liquid.
Central bankers also use strong communication practices and adherence to stated goals to maintain the credibility needed to fix expectations among investors and the public at targeted levels.
Monetary policy implementation typically unfolds through the following six different channels that affect aggregate demand directly:
- Bank-lending channel that makes credit more available.
- Private non-financial balance-sheets channel that encourages debt reduction and refinancing.
- Wealth channel that bears directly upon asset values and elevates the propensity to consume.
- Interest-rate channel that encourages increased risk-taking and purchases of small businesses, houses, cars and other consumer durables.
- Exchange-rate channel that influences the availability and relative prices of imports and the level and composition of purchases.
- Portfolio-balance channel that alters aggregate demand by influencing the relative prices of assets in investors’ and savers’ portfolios and, indirectly, the strength of any wealth effects.
Ironically, though, policy implementation through the six channels has strengthened the supply side of markets as much as, or even more, than the demand side. Although capital spending in the US and other developed economies has not advanced as rapidly as in previous cyclical expansions (on average), global markets are awash in goods and business profits have soared to unprecedented heights. (See Exhibit 7.)

Unless growth in aggregate demand catches up with expanding aggregate supply, central banks will struggle to elevate inflation rates to targeted levels.
Accommodative fiscal policies can be a vital complement to monetary policy for governments focusing on the demand side of their economies. In the absence of more expansionary fiscal policy, needed growth in consumer demand for goods and services, business spending on plant and equipment, and government outlays for infrastructure and workers may prove to be insufficient. Yet in an era of fiscal austerity, however, such stimulus still may not be forthcoming.
Output gaps, inflation persistence and base effects
Monetary policymakers will not focus more intently on monetary aggregates alone over the months ahead to find clues to the inflation outlook. Instead, large-scale econometric models will provide policymakers with the most quantitatively reliable forecasts based on stable, causal relationships among macroeconomic variables.
Outside the context of forecasting models, though, heightened attention also will be directed toward a wide range of non-monetary relationships in the real economy that bear upon the inflation outlook. Among these are four key relationships:
-
Capacity utilization in manufacturing, mining and utilities facilities
Capacity utilization rates above roughly 85%–88% usually presage a period of increased inflation. Readings above that range commonly signal production bottlenecks that can result in delivery delays and higher prices. As of June 2015, capacity utilization stands at roughly 79%, well below the range customarily associated with accelerating inflation.
-
Output gaps
On June 5, 2015, William Dudley, president of the New York Fed stated that “as long as growth remains strong enough to lead to further improvements in labor market conditions—and this is an important caveat—I am becoming more confident that inflation will move up…” Based on this reasoning, economic analysts at the Fed banks pay attention to a sophisticated relationship dubbed the “output gap.” Although the output gap can be calculated in many ways, a method used widely at the Fed looks at the differential between actual unemployment and the non-accelerating inflation rate of unemployment (NAIRU) as estimated by the US Department of Labor. (See Exhibit 8.) Currently, US real GDP is growing at roughly a 2.2% annual rate as potential GDP, as measured by the US Department of Commerce, grows at roughly a 2.0% annual rate. In recent years, potential GDP growth estimates have declined by at least a half of a percentage point, reflecting a downshift in productivity gains. Real GDP growth at a rate just above “potential” tends to be consistent with some upward pressure on the overall price level. (See Exhibit 9.)
-
Unit labor costs
Increases in average hourly wages and the employment-cost index alone have not proven to be reliable predictors of future inflation. Instead, Fed economists look at unit labor costs, or the difference between changes in the employment-cost index and changes in labor productivity, to suggest the future direction of inflation. Historically, increases in unit labor costs tend to be associated with changes in the rate of inflation. (See Exhibit 10.) That’s because aggregate consumer demand emanates mainly from labor compensation and aggregate supply tends to be associated with increases in productivity (plus, of course, imports). When aggregate demand grows faster than aggregate supply, demand-pull inflation tends to increase.16
-
Inflation persistence
A so-called “naive” forecast suggests that best way to forecast inflation a year hence is to assume it will be just about the same as it is currently. Using a naive forecast, many businesses and consumers build the current inflation rate into their forecasts, making it a kind of self-fulfilling prophecy. That tendency builds a kind of “persistence” into inflation rates that, barring major fundamental changes in the economy or a dramatic shock, make the inflation rate relatively stable.


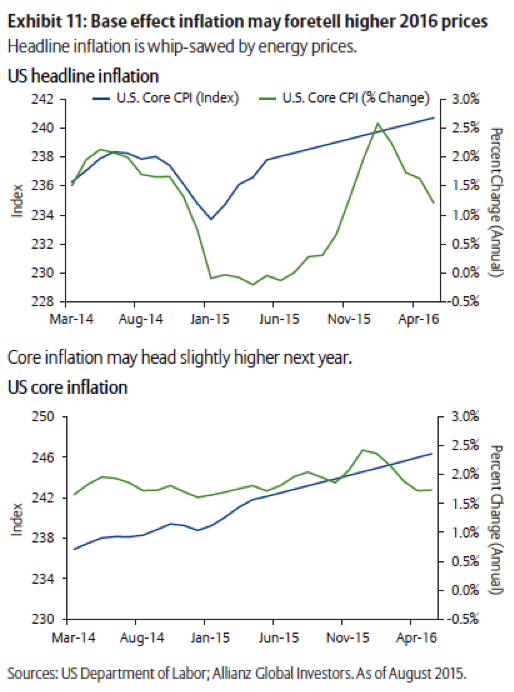
Given the persistence of low inflation rates in recent months—perhaps associated with the sharp drop in energy prices and strength in the foreign-exchange value of the US dollar—inflation forecasters have paid increasing attention to “base-effect inflation.”
Base effects have no influence over the amount of the annual inflation, but can be expected to suggest a modest acceleration in the inflation rate over the last few months of 2015 and, perhaps, in 2016. The reason is that general downtrend in oil prices and strengthening of the US dollar that contributed to extreme consumer price weakness late in 2014 will begin to “roll off” base-effect inflation calculations. As a result, year-over-year inflation calculations will begin to look a little bit bigger over the closing months of 2015. (See Exhibit 11.)
Inflation doesn’t happen in a world of oversupply
Eminently rational reactions by businesses to the most basic fundamentals of markets—supply, demand and resulting prices at different levels of production—continue to reinforce global deflationary forces.
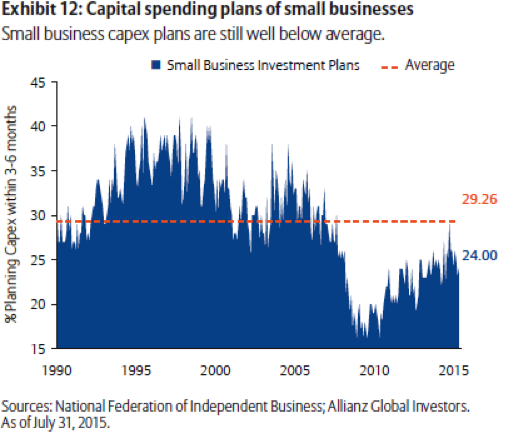
Excess global supply of labor, goods and services, productive capacity and commodities relative to demand became acute over the last few years. Business investment in capacity expansion and productivity enhancement blossomed in many emerging economies, to a record 25% of global GDP in 2015, an all-time high. Capital spending in emerging economies left little room for private-sector investment in developed-market economies. “Renting” capacity and long-lived equipment from the least expensive emerging economies did a better job of keeping down their costs. (See Exhibit 12.)
Where investment was brisk, as in the oil fields of North America, new supply coming onstream served only to exacerbate supply/demand imbalances and push prices down. Ironically, as prices fell, North American oil exploration and production companies reduced rig counts and still continued to increase production by tapping new, extremely rich fields.
Taking a long-term retrospective view, it becomes clear that emerging-market development changed everything. The end of the Cold War, in particular, “freed” roughly half of the global population to compete in international markets. Today, some three billion workers now compete directly for a wide range of jobs held by developed-market workers.17
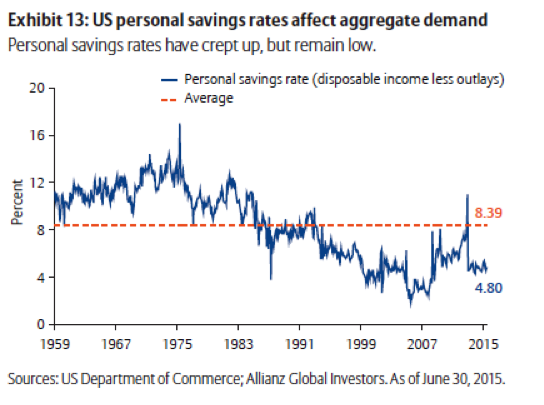
Newly freed workers not only contributed to the global oversupply of labor, but also to the oversupply of capital. For the first time, these workers could stash some of their earnings in savings accounts. By doing so, they did not generate nearly as much demand as developed-market businesses anticipated. So instead of a balanced rise of supply and demand, markets increasingly experienced ever-growing supply without a commensurate increase in demand. A glut of savings in both emerging and developed economies, unplanned inventories and productive capacity resulted. (See Exhibit 13.)
Never before had so much money piled up so fast. Then, China sterilized its currency from trade flows that normally cause a currency to appreciate and curtail competitiveness. This step effectively blocked free conversion of yuan into dollars. The Chinese government and central bank began to accumulate vast foreign-currency reserves. With those reserves, they bought developed-market securities, notably US Treasury securities, driving up their price, driving down their yield and preventing the US dollar from depreciating relative to the yuan.
With a torrent of global savings flowing back to developed-economy financial markets, governments did not need to borrow as much private domestic capital, putting still further downward pressure on interest rates. Financial repression intensified. The rising pool of capital far outstripped global demand for it, all without contributing very much to global real economic growth.
So why is there so little inflation? Inflation is unlikely to reignite sustainably in the US and, to a lesser extent, in the rest of the developed world, until global wage and capital imbalances moderate. Price inflation alone cannot persist without wage inflation; and wage inflation amid a global surplus of labor—relative to demand for it—is beyond the bounds of rational expectations in the near term.
Accordingly, so-called “cost-push” inflation emanating from changes in commodity and natural-resource prices, or based principally on expectations, is a specious notion. In the world of oversupply, sellers either tend to hold their prices steady or decrease them in an unsustainable attempt to increase revenue by putting more output on the market for sale. In an age of oversupply, in an age of restrained wage inflation, in an age of downward-shifting and even downward-sloping supply curves for many commodities, “if wages don’t track, prices pull back.”18
In the end, the gap between aggregate demand and aggregate supply can close only if demand eventually catches up with supply. That means that the growing wealth of the emerging markets must be absorbed fully into global markets in a balanced and sustainable way. Factors that can bring this about include the following:
- The good news here is that global population growth is slowing and the size of the world’s labor force is expected to level off within the next two decades.
- Moreover, the aging populations of Europe, China and Japan, especially, should help to reduce today’s huge piles of money as long-time savers start spending more of their incomes and accumulated wealth.
- As the growing emerging-market middle class demands more and better public infrastructure, those nations will begin to sop up more excess wealth.
In other words, demographics and politics suggest that the age of oversupply will not go on forever. At some point, all inflation will again be “demand-pull” inflation, but who knows when?
Late 19th century and early 20th century economic theorists Leon Walras and Vilfredo Pareto may have been absolutely accurate in assuming that markets in closed economies would gravitate instantaneously toward equilibrium. But markets are not closed, do not adjust instantaneously, and global competition intensifies daily.
In addition, most relatively free market economies have sticky wages, sticky prices, sticky asset values and sticky rents that do not adjust readily to clear markets of excess quantities supplied at different prices.
Walras and Pareto could never fathom the disparity between global supply and global demand across financial markets and at all levels of production, but that is what we have.
Asset diversification can provide inflation protection19
In response to the Fed’s stated intention to set conditions conducive to an anchored 2% inflation rate, some investors have begun to consider their vulnerability to a higher price level—and how to protect their portfolios. With deflationary pressures still strong, however, there is little consensus regarding how, if at all, to protect against eventual rising inflation, no matter how constrained that inflation may turn out to be.
Because investors’ assets and liabilities, risk tolerance and portfolio objectives differ, however, a single inflation-protection strategy will not be appropriate for every investor. Adding inflation protection to a traditional asset allocation is unlikely to improve expected returns so, not surprisingly, some investors choose not to purchase inflation protection at any price—until they can “see the whites of the eyes” of an accelerating inflation rate.
No individual asset class or strategy can provide the optimal inflation hedge. Many different assets could, potentially, provide some protection against inflation. However, their ability to do so varies, as do their reliability and their opportunity costs (the expected returns they provide compared with what gets replaced in investment portfolios). (See Exhibit 14.)
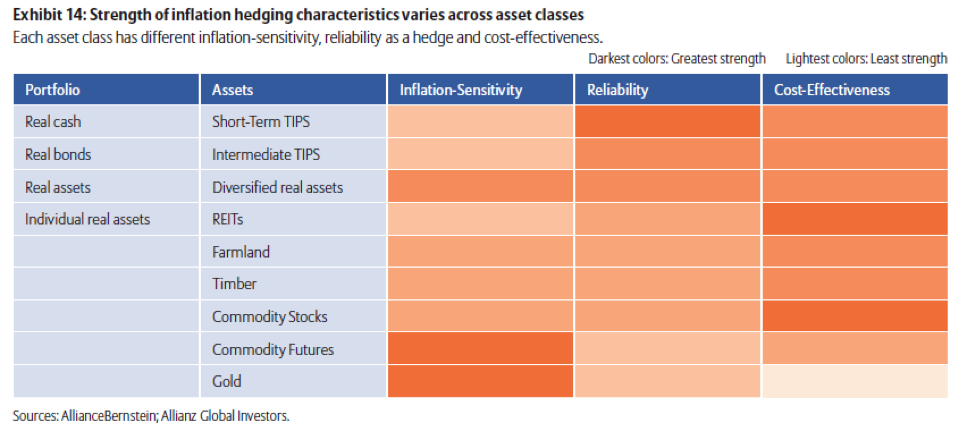
In addition, some assets, such as commodity futures and farmland, have strong positive sensitivity to changes in the price level (high inflation betas), while others, like 20-year US Treasuries and the S&P 500, do not. Two partially offsetting tendencies determine an asset’s sensitivity to inflation: (1) the tendency for rising prices to push up cash flows and foster increases in an asset’s value; and (2) the tendency for rising inflation expectations to drive up the discount rate used to measure the value of future cash flows.
Revenues of commodity-based companies, for example, generally rise faster than their costs during rising-inflation periods, so their cash flows tend to react positively to even very small increases in inflation.
Similarly, in extremely low or negative inflation environments, an increase in inflation expectations tends to coincide with an increase in equity prices, resulting in a generally positive response to inflation. That’s because cyclical uncertainty diminishes and risk premiums shrink as inflation rates revert toward more “normal” levels.
However, the equity hedge against rising inflation tends to last only until the inflation rate climbs to roughly 4%. Historically, at, or above, roughly a 4% rate, valuations tend to weaken as real consumer spending tapers off in response to the higher price level. In addition, higher inflation expectations elevate the discount rate applied to future earnings, overwhelming the impact on equity presses of rising dividends.
On the other hand, sensitivity to discount-rate changes increases the further into the future any fixed cash flows extend, like coupon payments on long-term bonds.20 So, in general, the higher the discount rate applied to future earnings (often, that means, the higher the interest rates), the lower the asset’s value.
In the end, the net effect of the inflation-driving versus the inflation-driven tendencies of different assets likely will remain small for many months to come. With interest rates still at or near record low levels in many parts of the world, neither tendency currently can be expected to have a strong impact on asset values, even if the Fed and the BOE begin to raise their respective policy rates in the near future.
Risk tolerance guides inflation-protection strategy
In determining the asset mix that provides the most ideal inflation protection, investors also must pay attention to how closely their assets match their liabilities. For most investors, assets and liabilities do not match up precisely.
Many liabilities are exposed explicitly to inflation risk, such as the inflation-indexed benefits associated with some pension funds. However, liabilities also can have implicit inflation sensitivity, such as future budget expenditures of a foundation or the lifestyle spending needs of an individual. In sum, the more an investor’s liabilities increase with inflation, the greater the exposure to inflation and the greater the protection that likely will be prudent.
On the other side of an investor’s balance sheet, a holistic view of assets typically includes both financial assets (such as stocks, bonds and cash in an investment portfolio) and income-related, or non-financial, assets (such as an individual’s future wages or an endowment’s fund-raising potential). Income-related assets benefit, ideally, from rising inflation, so they provide a natural inflation hedge. Investors with fewer such assets, then, generally need more inflation protection in their “financial asset” portfolio.
The extent of investors’ risk aversion plays a crucial role in determining the timing, scale and scope of appropriate inflation protection. As in any asset allocation, the lower the investor’s appetite for risk, the greater the return likely to be sacrificed to hedge against inflation-related vulnerability, and the greater the inflation protection likely to be incorporated into portfolios.
Relatively more risk-averse investors tend to hedge their liabilities with less regard to cost. These investors tend to favor a higher allocation to inflation protection from TIPS and other inflation-sensitive, income-protecting assets in order to match inflation-sensitive liabilities with equally inflation-sensitive assets.
Those who are more risk tolerant, on the other hand, tend to be less willing to give up return and favor relatively higher-returning assets in an attempt to match assets and liabilities. At higher levels of risk tolerance, real assets, like real estate, timber and commodities, provide enough diversification benefit and inflation-hedging bang for the buck to justify an allocation.
Inflation protection needs vary with age
Practically speaking, allocation to inflation protection is fairly small for most investors—even for those with a moderate aversion to risk. In the extreme, highly risk-tolerant investors with inflation-sensitive assets and largely nominal liabilities may even short inflation protection if they expect a drop in inflation to lower the value of their assets and raise the value of their liabilities. (See Exhibit 15.)
For individual investors, the appropriate average allocation to inflation protection rises with age, reflecting diminishing future income streams as they move through their life cycle. More risk-tolerant investors typically hedge relatively less, opting to accept the risks of a mismatch between their assets and liabilities rather than forgo the potential for higher returns.

Consider the case of an investor with moderate risk tolerance at different stages of the life cycle:
- Early in a working career, the investor has significant remaining lifetime earning potential and can expect earnings to keep pace with inflation over the long run. For this investor, the level of income-related assets as a share of total assets can be relatively large.
- Skipping ahead to late middle age, most of the investor’s working years have already passed and, with them, the “inflation hedge” provided by expected annual pay raises. Some of this loss is recouped by increases in the value of eventual social security income and, in the case of homeowners, the value of home equity—both of which are inflation-linked assets. On the whole, however, non-financial assets, such as returns to “human capital,” typically fall over time as a share of an individual’s total assets. Financial assets, especially fixed-income assets, comprise a larger share.
- During retirement, individuals draw from their investment portfolios at different rates, creating the potential for marked variation across retirees in the role played by outside, inflation-sensitive income sources. For example, if the investor draws down financial assets rapidly and relies increasingly on inflation-indexed social security income assets, inflation protection will be less appealing. However, if the investor does not have substantial inflation-sensitive assets, inflation protection will make more sense.21
A separate set of drivers likely determines the appetite for inflation protection for investors with and without capital in excess of what is needed to support their spending needs.
Investors with little excess capital tend to demand much more inflation protection, with an increasing portion coming from inflation-sensitive bonds. The relatively small return differential between their assets and liabilities commonly results in significant net-worth volatility if steps to hedge inflation risk are not taken.
By comparison, investors with excess capital spend far less than what their assets could reliably support. In other words, they do not rely on every investment dollar they have to support their core spending needs. Their excess capital provides a valuable cushion, a kind of self-insurance, against the adverse impact of rising inflation on net worth. For them inflation-hedging takes on less importance.
For all individual investors, the tax efficiency of inflation hedges varies and becomes an important consideration as regards the timing, composition and magnitude of portfolio adjustments. If inflation protection cannot be sourced without undue tax consequences, investors might consider curtailing, or even foregoing, portfolio adjustments to hedge inflation risk.
Inflation beguiles institutional investors, too
Like individual investors, institutional investors have different portfolio objectives and constraints, risk tolerance and exposure to inflation-linked assets and liabilities.
High spending needs (and, correspondingly, high return needs) lead both foundations and endowments to take on limited inflation protection, given the highly inflation-sensitive nature of their liabilities.
Foundations tend to have a relatively small allocation to income assets as a share of total assets, so they need more inflation protection than, say, endowments. Endowments tend to have inflation-linked contributions that provide a meaningful hedge.
Both endowments and foundations tend to have predominantly inflation-sensitive liabilities. Thus, they generally aspire to fund a stream of inflation-linked cash flows, whether mandatory or discretionary. For these institutional investors, fixed-income securities tend to comprise the bulk of financial assets, much like a post-retirement individual.
However, whereas individuals typically expect to draw down their investment portfolios to support spending throughout retirement, foundations and endowments generally aim to preserve the purchasing power of their portfolios over time, even after meeting their payout obligations.
Since endowments and foundations typically have spending rates of 4%-5% annually, maintaining the inflation-adjusted value of their portfolios requires relatively high portfolio returns. Thus, these investors typically cannot afford to match their liabilities at the expense of higher expected returns. Correspondingly, they tend to have a lower allocation to inflation protection than their liability exposure might suggest.
Endowments tend to differ from foundations when it comes to outside, income-related assets. Endowment balance sheets commonly include a relatively larger proportion of inflation-sensitive income assets—in the form of future gifts and contributions—whereas foundations often have limited assets beyond the investment portfolio. This distinction is consistent with foundations, as they generally require more inflation protection than endowments.
Pension plans, on the other hand, have a different set of inflation-protection issues. Plans with a modest risk profile generally tend to hold a portfolio with a risk profile akin to a 60% stock/40% bond portfolio and have meaningful sensitivity to asset-liability mismatches.
Pension plans also differ from one another in their funding ratios and exposure to inflation-sensitive liabilities. The amount of protection needed by pension plans depends mainly on the extent to which the majority of benefit obligations are indexed to inflation.
Plans with no benefits indexation require less exposure to inflation hedges, while plans with indexed benefits have significant inflation-related liabilities and, thus, need more protection.
In addition, inflation-indexed plans are differentiated by funding ratio, with overfunded plans requiring somewhat less protection and underfunded plans somewhat more, holding risk appetite the same.
Published research suggests that pension plans that do not face benefits indexation may require only modest inflation protection, regardless of their funding ratio. However, allocation to lower-returning inflation hedges increases as plans become more underfunded.
That’s because rising inflation that reduces the value of a plan’s liabilities also may have a disproportionate, adverse impact on the plan’s asset value, thus creating undesirable volatility in the funding ratio. Similarly, when net worth declines or turns negative, even small mismatches between a plan’s assets and liabilities can increase risk.
All in all, inflation hedges do help to provide a better asset-liability match. Still, many underfunded institutional investors opt instead to pursue higher-returning “nominal” investments unlinked directly to changes in the inflation rate. Such a decision is reasonable for plans with higher risk tolerance, a correspondingly lower appetite for inflation protection and greater willingness to accept elevated volatility.
About the author
Steven R. Malin, Ph.D., is an investment strategist and a director with Allianz Global Investors, which he joined in 2013. As a member of the US Capital Markets Research & Strategy team, he is responsible for making weekly US and global asset-allocation recommendations. Mr. Malin’s responsibilities also include analyzing global economic, financial, political and regulatory developments; and briefing institutional, retail and retirement clients. He has 25 years of financial-markets, central-bank and investment-industry experience. Before joining the firm, he was the director of research at Wealthstream Advisors, a private wealth management firm; and an advisor to Aronson Johnson & Ortiz, a quant-based institutional equity manager. Earlier, Mr. Malin was a senior portfolio manager at AllianceBernstein, serving institutional, sub-advisory, Taft-Hartley and private clients throughout North America. He also worked at the Federal Reserve Bank of New York for more than 16 years, and during this time he was an officer who held several senior positions, including senior economist, media relations officer, vice president in the communications group and corporate secretary. Before that, Mr. Malin was the senior economist, founder and director of the regional economics center at The Conference Board. He also taught graduate and undergraduate macroeconomics and risk-management courses at Barnard College-Columbia University and the City University of New York. Mr. Malin has a B.A. in economics from Queens College and a Ph.D. in economics from the Graduate Center of the City University of New York.
Endnotes
1 Frederic S. Mishkin, March 23, 2007.
2 The US Federal Reserve’s annualized inflation target as of August 2015 is a rate close to, or at, 2%, as measured by the core personal consumption expenditures deflator.
3 Kevin J. Lansing, July 20, 2015.
4 The base effect is the influence on consumer price changes of the corresponding month of the previous year on the changes in the annual inflation of this year’s respective month. Divergence base effect trend inflation may suggest either a strengthening or a weakening in endogenous inflation drivers
5 Former Fed Governors Bernanke and Mishkin spoke frequently about the importance of inflation anchors. For example, see Benjamin S. Bernanke, June 9, 2008 and October 15, 2010, and Frederic S. Mishkin, October 20, 2007 and February 25, 2008. Discussion of inflation anchors have appeared in numerous speeches and testimonies by Fed governors over the past year, especially. See, for example, Janet L. Yellen, May 22, 2015.
6 Data in this paragraph are as of July 31, 2015.
7 John Silvia, August 5, 2015.
8 Board of Governors of the Federal Reserve System, “Summary of Economic Projections, June 17, 2015.
9 University of Michigan, “Surveys of Consumers,” August 2008.
10 Federal Reserve Bank of New York, Markets Group, “Survey of Primary Dealers,” June 2015.
11 The M-2 money supply equals currency held by the public, plus transaction balances, savings account balances, small denomination time deposits, money market deposit account balances and retail money market mutual fund shares.
12 Michel E. Levy and Steven R. Malin, 1977.
13 Prominent among this group were Jeffrey Lacker, Richard Fisher and Charles Plosser of the Richmond, Dallas and Philadelphia Federal Reserve Banks, respectively.
14 The monetary base consists of currency in circulation outside Federal Reserve Banks and the US Treasury Department, plus deposits at Federal Reserve Banks.
15 Alan Greenspan stated in his August 1993 Humphrey-Hawkins testimony that the linkage between money-supply growth and real economic activity had broken and money supply no longer serves as a meaningful tools for forecasting economic growth.
16 This relationship has deteriorated in recent years as imports have augmented aggregate supplies in domestic markets, thereby partially offsetting weak productivity gains.
17 For an outstanding discussion of emerging-market competition versus developed economies, see Daniel Alpert, The Age of Oversupply, 2013.
18 Nobel Prize-winning economist George Akerlof drew a linkage between wage gains and inflation by postulating that a roughly 3% US inflation rate would “grease the wheels” of the labor market by increasing wage flexibility, thereby tending to reduce the equilibrium unemployment rate. Thus, instead of envisaging a lower unemployment rate stimulating inflation, Akerlof postulated that more inflation would reduce the unemployment rate. See George A. Akerlof, “Behavioral Macroeconomics and Macroeconomic Behavior,” 2001.
19 The following three sections borrow heavily from research studies on inflation hedging published by academicians, government and official international agencies, and financial institutions. For the most comprehensive discussion of inflation-hedging and its use by individual and institutional investors, see Jon Ruff, April 2010.
20 In an August 10, 2015 interview on Bloomberg television, Alan Greenspan noted that, “discount rates reflect human time preferences and a purely a behavioral finance phenomenon. They effectively ask, ‘How much are you willing to pay to get paid sooner.’”
21 Example derived from Jon Ruff, April 2010.
Bibliography
George A. Akerlof, “Behavioral Macroeconomics and Macroeconomic Behavior,” Prize Lecture, Department of Economics, University of California, Berkeley, CA, December 8, 2001.
Allianz Global Investors, “Valuing and Measuring the Sensitivity of Bonds as a Basis for Maturity Management,” 2015.
Daniel Alpert, The Age of Oversupply: Overcoming the Greatest Challenge to the Global Economy, Portfolio/Penguin Books, 2013.
Olivier Armentier and Giorgio Tapa, et.al., “Inflation Expectations and Behavior: Do Survey Respondents Act on Their Beliefs?” Federal Reserve Bank of New York, Liberty Street Economics, July 2011.
Jeremy I. Bulow, “The Effect of Inflation on the Private Pension System,” Chapter in Inflation: Causes and Effects, University of Chicago Press, 1982.
Ken Faulkenberry, “Inflation Guide: How Does the Inflation Trend Affect Your Asset Allocation?” Arbor Investment Planner, 2015.
Ben S. Bernanke, “Outstanding Issues in the Analysis of Inflation,” at the Federal Reserve Bank of Boston’s 53rd Annual Economic Conference, Chatham, MA, June 9, 2008.
Ben S. Bernanke, “Monetary Policy Objectives and Tools in a Low-Inflation Environment,” at the Revisiting Monetary Policy in a Low-Inflation Environment Conference, at the Federal Reserve Bank of Boston, Boston, MA, October 15, 2010.
Jamie Biddle, “Real Assets and Inflation Hedging Strategies,” Verdis Investment Management.
Wandi Bruine de Bruin and Simon Potter et.al., “Improving Survey Measures of Household Inflation Expectations,” Federal Reserve Bank of New York, Current Issues in Economics and Finance, Vol. 16, Number 7, August/September 2010.
William C. Dudley, “The U.S. Economic and Monetary Policy Outlook,” Remarks at the Economic Club of Minneapolis’s June Luncheon, Minneapolis, MN, June 5, 2015.
Federal Reserve Bank of New York, Markets Group, “Responses to Survey of Primary Dealers,” June 2015.
Federal Reserve System, Board of Governors, “Summary of Economic Projections, June 17, 2015.
Nicolas Fulli-Lemaire, “Alternative Inflation Hedging Portfolio Strategies: Going Forward Under Immoderate Macroeconomics,” Amundi Asset Management.
Gregory D. Hess and Charles S. Morris, “The Long-Run Costs of Moderate Inflation,” Federal Reserve Bank of Kansas City, Economic Review, Second Quarter 1996.
Kevin J. Lansing, “Assessing the Recent Behavior of Inflation,” Federal Reserve Bank of San Francisco, FRBSF Economic Letter, July 20, 2015.
Michael E. Levy and Steven R. Malin, International Influences on U.S. Inflation, The Conference Board, Inc., 1978.
David Lucca and Ernst Schaumberg, “What to Make of Market Measures of Inflation Expectations,” Federal Reserve Bank of New York, Liberty Street Economics, August 2011.
Frederic S. Mishkin, “Inflation Dynamics,” at the Annual Macro Conference, Federal Reserve Bank of San Francisco, San Francisco, CA, March 23, 2007.
Frederic S. Mishkin, “Headline versus Core Inflation in the Conduct of Monetary Policy,” at the Business Cycles, International Transmission and Macroeconomic Policies Conference, HEC Montreal, Montreal, Canada, October 20, 2007.
Frederic S. Mishkin, “Does Stabilizing Inflation Contribute to Stabilizing Economic Activity?” at East Carolina University’s Beta Gamma Sigma Distinguished Lecture Series, Greenville, NC, February 25, 2008.
Frederic S. Mishkin, “Exchange Rate Pass-Through and Monetary Policy,” at the Norges Bank Conference on Monetary Policy, Oslo, Norway, March 7, 2008.
Frederic S. Mishkin, “Comfort Zones, Shmumfort Zones,” at the Sandridge Lecture of the Virginia Association of Economists and the H. Parker Willis Lecture of Washington and Lee University, Lexington, VA, March 27, 2008.
Edward J. O’Donnell, “Real Assets and Inflation Hedge Investing,” NEPC, August 2009.
Rocaton Investment Advisors, “Building a Better Inflation Hedge: The Case for Real Assets,” Investment Insights, March 2014.
Eric S. Rosengren, “Revisiting Monetary Policy in a Low Inflation Environment,” Remarks at the Federal Reserve Bank of Boston’s 55th Economic Conference, Boston, MA, October 16, 2010.
Jon Ruff, Deflating Inflation: Redefining the Inflation-Resistant Portfolio, AllianceBernstein, April 2010.
David Russ and Yogi Thambiah et.al., “Managing Fixed Income Investments in a Rising Inflation and Interest-Rate Environment,” Credit Suisse Asset Management, March 2011.
John E. Silvia, “Lots of Money: Where Is the Inflation?” Wells Fargo Economics Group, July 22, 2015.
John E. Silvia, “TIP: Pay Little Heed to Current TIPS Breakeven Inflation,” Wells Fargo Economics Group, Interest Rate Weekly, August 5, 2015.
University of Michigan, “Surveys of Consumers,” June 2015.
Jose Vinals, “Monetary Policy Issues in a Low Inflation Environment,” Paper Prepared for the Central Banking Conference of the European Central Bank, Servicio de Estudios, Banco de Espana, Documento de Trabajo 0107, November 2, 2000.
Wealthfront, “Addressing Inflation in the Design of Defined Benefit Pension Plans,” July 1, 2015.
Janet L. Yellen, “The Outlook for the Economy,” at the Providence Chamber of Commerce, Providence, RI, May 22, 2015.
Janet L. Yellen, “Semiannual Monetary Policy Report to the Congress,” Before the Committee on Financial Services, US House of Representatives, Washington, D.C., July 15, 2015.
Important information
Investing involves risk. The value of an investment and the income from it will fluctuate and investors may not get back the principal invested. Past performance is not indicative of future performance. This is a marketing communication. It is for informational purposes only. This document does not constitute investment advice or a recommendation to buy, sell or hold any security and shall not be deemed an offer to sell or a solicitation of an offer to buy any security.
The views and opinions expressed herein, which are subject to change without notice, are those of the issuer or its affiliated companies at the time of publication. Certain data used are derived from various sources believed to be reliable, but the accuracy or completeness of the data is not guaranteed and no liability is assumed for any direct or consequential losses arising from their use. The duplication, publication, extraction or transmission of the contents, irrespective of the form, is not permitted.
©2015 Allianz Global Investors U.S. LLC, 1633 Broadway, New York, NY 10019-7585, us.allianzgi.com, 1-800-926-4456.
AGI-2015-09-11-13221


