There is an old saying that successful real estate investors follow three important considerations: location, location, location. When the real estate market is booming, one can make good returns in marginal properties, but those investments are unlikely to hold their value during a downturn in the market.
The same can be true of equity investing during the past several years. When the global economy was binging on credit, it was fine to invest in marginal locations’ equity markets. However, as the global economy slowed, those fringe markets have disappointed, and “location, location, location” has proved as important to equity performance as it is in real estate.
The equity world’s equivalent of A+ office space is the US consumer sector. It’s not an accident that Consumer Discretionary stocks were 2015’s best performing sector in the US (see Chart 1) because the US consumer has been the strongest and most stable part of the global economy. Our overweight of Consumer Discretionary stocks was a major fillip to our performance.
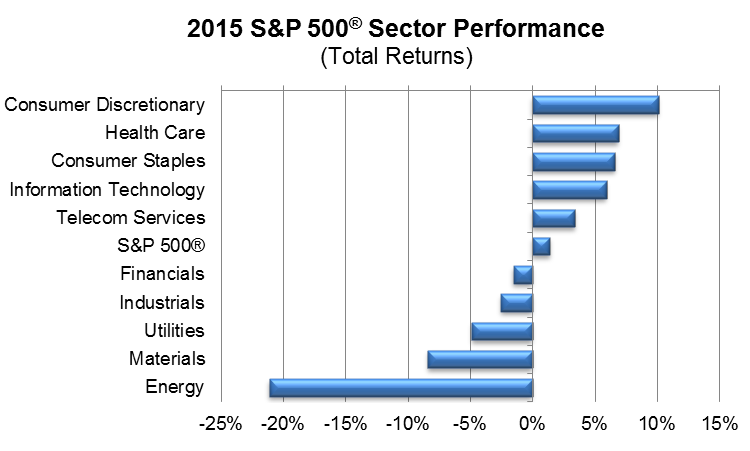
Source: Bloomberg Finance L.P. For Index descriptors, see "Index Descriptions" at end of document.
Mute the TV
Our Year Ahead report emphasized that 2016’s political rhetoric was likely to give very misleading signals about the health of the US’s household sector. Although politicians from both parties suggest the US household sector is in terrible shape, households themselves do not seem to agree at all with that assessment.
Chart 2 shows the Conference Board’s Consumer Confidence Index. The latest reading (98.1) is close to the cycle high and is well above the long-term average (92.6). A reading above the long-term average indicates that consumers are more confident than “normal”. One would never know that by listening to the political pundits. Rather, one might think that the US household sector was in terrible shape. The outperformance of consumer stocks demonstrates the stock market muted the TV and paid attention to actual data like consumer confidence.
Consumer Confidence Index
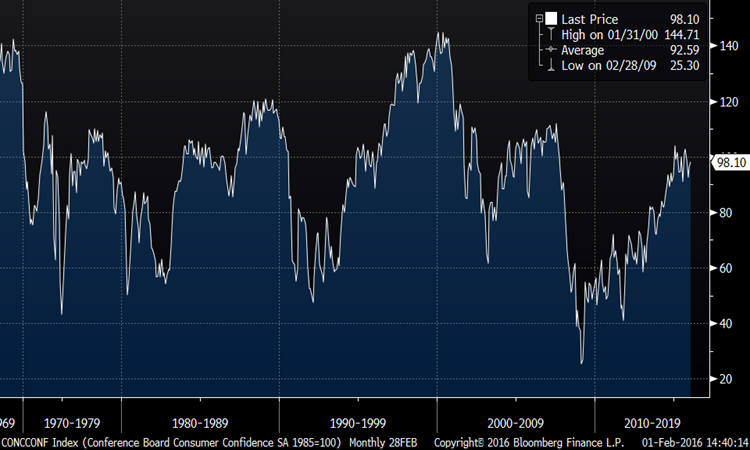
Source: Bloomberg Finance L.P.
The US consumer is benefitting from what we have called the “Wal-Mart World”. Excess global capacity is putting pressure on product prices as countries compete for market share within the stable and healthy US consumer market. Effectively, the entire world is acting like a giant Wal-Mart, and is offering consumers lower and lower prices.
The Wal-Mart world is starkly evident in a comparison of US nominal and real retail sales. For the first time in the history of monthly consumption data, real retail sales (units) are growing faster than are nominal retail sales (which include prices). So, consumers are buying, but price competition is constraining nominal retail sales.
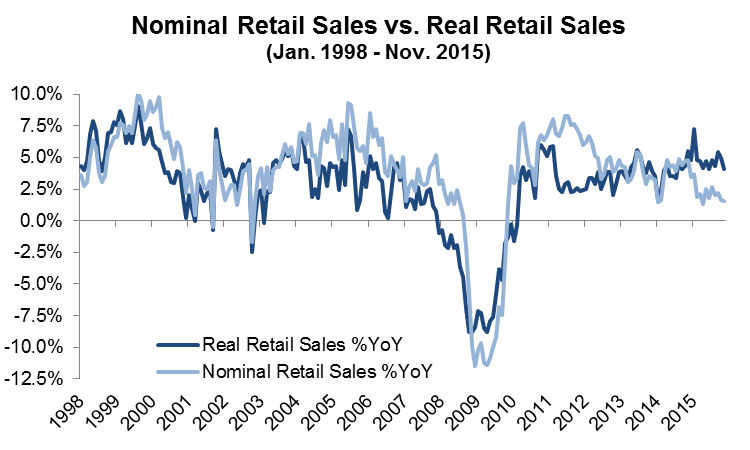
Source: Richard Bernstein Advisors LLC, Bloomberg Finance L.P.
Emerging consumer vs. US consumer
The emerging market consumer has been one of the most discussed growth stories of the past decade or more. Investors believe that US consumers are sated and over-leveraged, but emerging market consumers provide great growth opportunities because of their high savings rates and growing incomes. Unfortunately, sector performance has reflected the exact opposite, and US consumer stocks have outperformed emerging market consumer stocks by more than 1800 basis points per year over the last five years (see Chart 4).
This is understandable when one looks at the secular depreciation of emerging market currencies. Because currency strength or weakness measures purchasing power, a country’s standard of living improves as its currency appreciates and deteriorates as its currency depreciates. Accordingly, when the US dollar was depreciating, some observers pointed out that the US’s standard of living was weakening.
Chart 5 shows the JP Morgan Emerging Market Currency Index, and it has consistently fallen over the last five years. It is curious that investors were pessimistic regarding the outlook for US consumers when the US dollar was falling, but have remained bullish on the prospects for emerging market consumers despite the precipitous fall in EM currencies.
Sector Performance
US Consumer vs. Emerging Markets Consumer
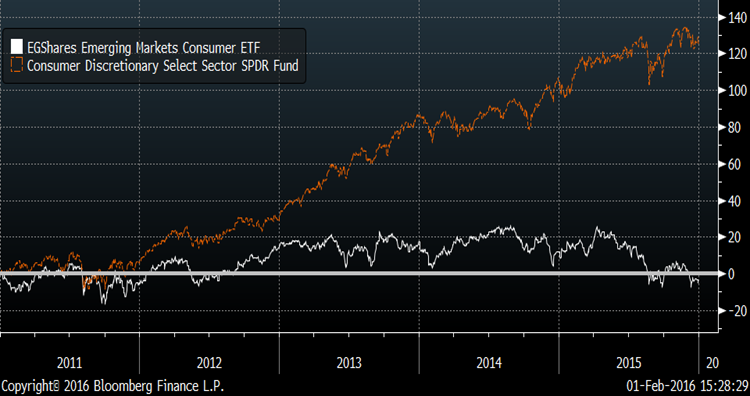
Source: Bloomberg Finance L.P. For Index descriptors, see "Index Descriptions" at end of document.
JP Morgan Emerging Market Currency Index
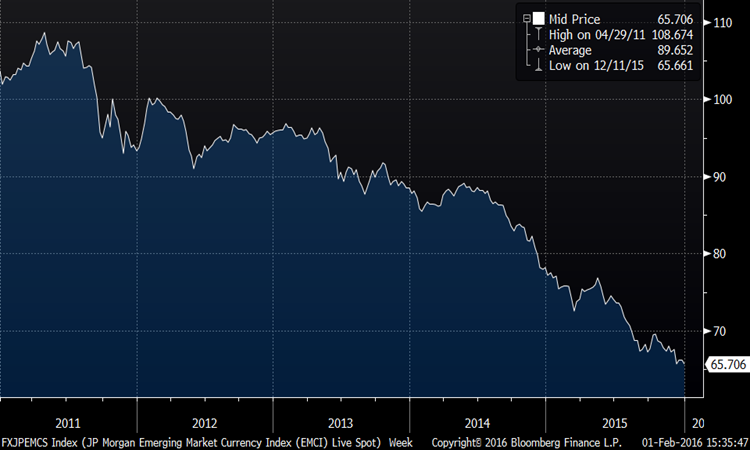
Source: Bloomberg Finance L.P. For Index descriptors, see "Index Descriptions" at end of document.
Location, Location, Location
The moral of the story is that it’s fine to invest in fringe markets when the world is binging on credit, but investors need to be more circumspect when the global economy slows. Economic cyclicals tend to outperform when the economic cycle revs up, but underperform when the economic cycle slows. Credit cyclicals outperform when the credit cycle revs up, but underperform when the credit cycle slows. Unfortunately, fringe markets are significantly exposed to both cycles.
INDEX DESCRIPTIONS:
The following descriptions, while believed to be accurate, are in some cases abbreviated versions of more detailed or comprehensive definitions available from the sponsors or originators of the respective indices. Anyone interested in such further details is free to consult each such sponsor’s or originator’s website.
The past performance of an index is not a guarantee of future results.
Each index reflects an unmanaged universe of securities without any deduction for advisory fees or other expenses that would reduce actual returns, as well as the reinvestment of all income and dividends. An actual investment in the securities included in the index would require an investor to incur transaction costs, which would lower the performance results. Indices are not actively managed and investors cannot invest directly in the indices.
S&P 500®: Standard & Poor’s (S&P) 500® Index. The S&P 500® Index is an unmanaged, capitalization-weighted index designed to measure the performance of the broad US economy through changes in the aggregate market value of 500 stocks representing all major industries.
S&P 500® Sector/Industries: Sector/industry references in this report are in accordance with the Global Industry Classification Standard (GICS®) developed by MSCI Barra and Standard & Poor’s. The GICS structure consists of 10 sectors, 24 industry groups, 68 industries and 154 sub-industries.
JP Morgan Emerging Market Currency Index: The J.P. Morgan EMCI index is a tradable benchmark for emerging markets currencies vs USD.
Emerging Markets Consumer: EGShares Emerging Markets Consumer ETF. The EGShares Emerging Markets Consumer ETF is an exchange-traded fund incorporated in the USA. The Fund seeks to track the performance of the Dow Jones Emerging Markets Consumer Titans Index which measures the performance of 30 leading consumer goods and consumer service companies in emerging markets.
US Consumer: Consumer Discretionary Select Sector SPDR Fund. The Consumer Discretionary Select Sector SPDR Fund is an exchange-traded fund incorporated in the USA. The ETF tracks the performance of the Consumer Discretionary Select Sector Index holding primarily large capitalization companies domiciled in the US. The ETF weights its holdings using a modified market cap approach, generally investing at least 95% of its assets in the index.
© Copyright 2016 Richard Bernstein Advisors LLC. All rights reserved.
PAST PERFORMANCE IS NO GUARANTEE OF FUTURE RESULTS
Nothing contained herein constitutes tax, legal, insurance or investment advice, or the recommendation of or an offer to sell, or the solicitation of an offer to buy or invest in any investment product, vehicle, service or instrument. Such an offer or solicitation may only be made by delivery to a prospective investor of formal offering materials, including subscription or account documents or forms, which include detailed discussions of the terms of the respective product, vehicle, service or instrument, including the principal risk factors that might impact such a purchase or investment, and which should be reviewed carefully by any such investor before making the decision to invest. Links to appearances and articles by Richard Bernstein, whether in the press, on television or otherwise, are provided for informational purposes only and in no way should be considered a recommendation of any particular investment product, vehicle, service or instrument or the rendering of investment advice, which must always be evaluated by a prospective investor in consultation with his or her own financial adviser and in light of his or her own circumstances, including the investor's investment horizon, appetite for risk, and ability to withstand a potential loss of some or all of an investment's value. Investing is subject to market risks. Investors acknowledge and accept the potential loss of some or all of an investment's value. Past performance is, of course, no guarantee of future results. Views represented are subject to change at the sole discretion of Richard Bernstein Advisors LLC. Richard Bernstein Advisors LLC does not undertake to advise you of any changes in the views expressed herein.
About Richard Bernstein Advisors:
Richard Bernstein Advisors LLC is an independent investment adviser. RBA partners with several firms including Eaton Vance Corporation and First Trust Portfolios LP, and currently has $3.1 billion collectively under management and advisement as of December 31, 2015. RBA acts as sub‐advisor for the Eaton Vance Richard Bernstein Equity Strategy Fund, the Eaton Vance Richard Bernstein All‐Asset Strategy Fund and the Eaton Vance Richard Bernstein Market Opportunities Strategy Fund and also offers income and unique theme‐oriented unit trusts through First Trust. RBA is also the index provider for the First Trust RBA American Industrial Renaissance® ETF and the First Trust RBA Quality Income ETF. Additionally, RBA runs ETF asset allocation SMA portfolios at UBS, Merrill Lynch, Morgan Stanley Smith Barney and on select RIA platforms. RBA's investment insights as well as further information about the firm and products can be found at www.RBAdvisors.com.


