On Thursday, April 28th, the current US bull market became the second longest in the post-war era. Amazingly, though, most investors are still wallflowers at the party. The ongoing fear of public equities among individuals, pensions, foundations, endowments, and hedge funds seems unprecedented. Certainly, there have been economic, financial, and political causes for concern, but when are there not such issues during bull markets? Whereas market tops are typically characterized by unbridled optimism, fear generally fuels bull markets. That characterization certainly describes the current bull market.
The bull market and the overall economy seem to be entering the “late-cycle” phase. Late cycle should not be confused with “late in the cycle”, which implies a bear market is nearing. Rather, a late-cycle phase can go on for quite some time. Characteristics of late-cycle environments include:
- Tightening labor markets
- Rising commodity prices
- Tightening monetary policy
- Rising inflation expectations
- Increasing long-term interest rates
- Increasing investor optimism.
RBA’s portfolios are positioned for a late-cycle environment. This report outlines some of the factors we have considered.
The late cycle
The economy seems to be at the beginning of the late-cycle phase. A late-cycle economy should not be confused with “late in the cycle”, which suggests a bear market is imminent. Late-cycle economies are characterized by increased demand, production bottlenecks, and stock market euphoria. Because there is so much excess capacity and extreme stock market pessimism (based on a broad range of sentiment data), we expect this cycle's late phase to last longer than most.
There is no klaxon that sounds to announce the beginning of each economic cycle's phases, so we think late cycles generally begin when the Fed begins to raise short-term interest rates. Of course, this is hardly precise because the Fed has sometimes reversed course and turned a cycle's clock backward. Table 1 shows the Fed tightening regimes from 1985 on.
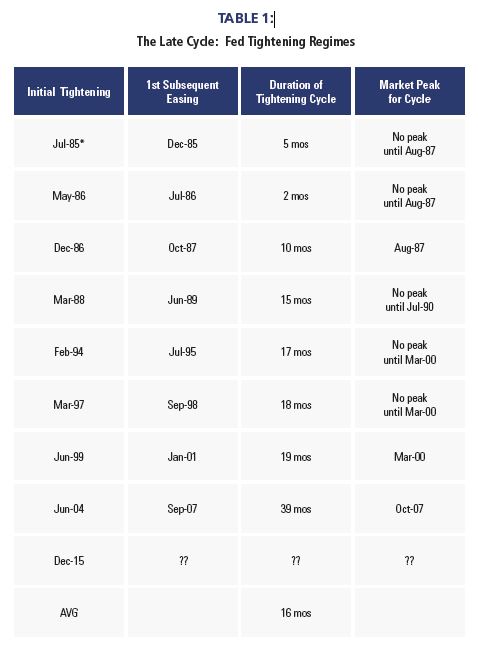
Source: Richard Bernstein Advisors LLC, Standard & Poor’s, FRB, Bloomberg Finance L.P.
*July-85 as per the Federal Reserve Bank of NY, “Historical Changes of the Target Federal Funds and Discount
Rates”, stated as “late Jul to late Aug gradual increase”. Some alternate sources list end of Aug-85.
Stocks outperform bonds in the late cycle
We remain fascinated by the continued huge inflows to bond funds and huge outflows from equity funds. Although many ascribe these flows to demographics and the aging baby boomers, we think it is largely caused by fear. Because bonds outperformed stocks during the 2008 bear market (which bonds typically do during most bear markets), investors believe investing for income is safe.
Investors' myopic search for income may be leading them to take considerably more investment risk then they believe (see investment insights No One Ever Grew Wealth Being Scared, March 2016 rbadvisors.com/images/pdfs/No one ever grew wealth being scared.pdf).
In addition to investors misunderstanding the pitfalls of pure income investing, mutual fund flows appear to show they don't have a historical sense of asset class performance during a late cycle.
Chart 1 shows the typical performance of stocks and bonds during the late cycle. The opportunity costs in the late cycle associated with a pure income strategy have historically been quite meaningful because stocks have on average outperformed bonds by 10% during late cycles.
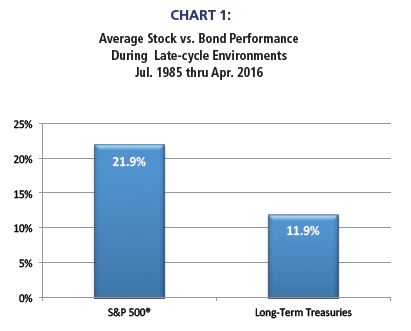
Source: Richard Bernstein Advisors LLC, Standard & Poor’s, BofA Merrill Lynch
Sectors, the late cycle and profits
Historically, the Fed tightening cycle has ushered in the late cycle during a profits cycle upturn. However, given the varying length of these later-cycle periods, this environment has encompassed both profit upturns and profit downturns, thus the specific sector outperformance has varied from cycle to cycle.
On average mid and late cycle sectors such as Information Technology and Energy have indeed led later cycle performance as shown in Chart 2. However, the strong relative performance of the Utilities, Telecom and HealthCare sectors versus the mid/late cycle Industrials & Materials sectors is counter-intuitive until one takes into account the changing dynamics of the profits cycle during these later-cycle periods.
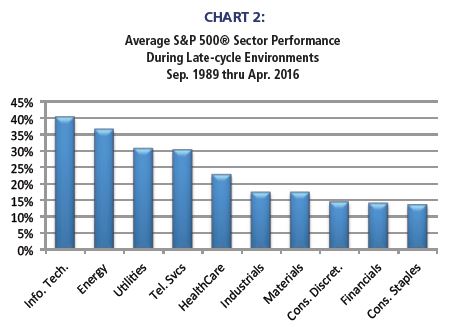
Source: Richard Bernstein Advisors LLC, Standard & Poor’s, FRB, Bloomberg Finance
L.P. For Index descriptors, see "Index Descriptions" at end of document.
Profits always matter
One of the core tenets of our work is that corporate profits are the main driver of relative style and sector performance and the late stages of the business cycle is no exception to this belief.
Two heads are better than one
Given our prior analyses on the significance of the profits cycles’ impact on sector performance, we incorporate our profits cycle work into our late-cycle viewpoint. Our work suggests that the profits cycle troughed in the 4th quarter thus we expect an acceleration in profits in 2016. Chart 3 shows the average sector performance during these conditions, historically.
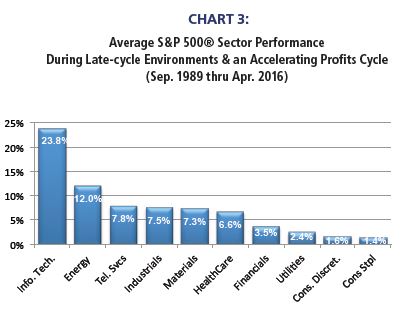
Source: Richard Bernstein Advisors LLC, Standard & Poor’s, Bloomberg Finance
L.P. For Index descriptors, see "Index Descriptions" at end of document.
RBA's portfolios
Our portfolios and SMAs seem well structured for a late-cycle environment in tandem with a profits acceleration. We are overweighted equities and most late-cycle equity sectors. Surprisingly, this positioning seems quite out of consensus. Recent surveys from Evercore ISI showed that portfolio managers were repositioning to become more defensive, and hedge funds were bearish on equities. If the economy is indeed in a late cycle, then the consensus could be wrong-footed.
The 2nd longest bull market in the post-war era has been largely missed by most investors. The fear of repeating 2008's bear market remains central to both individual and institutional portfolios. That on-going caution seems to us to present significant opportunity.
INDEX DESCRIPTIONS:
The following descriptions, while believed to be accurate, are in some cases abbreviated versions of more detailed or comprehensive definitions available from the sponsors or originators of the respective indices. Anyone interested in such further details is free to consult each such sponsor’s or originator’s website.
The past performance of an index is not a guarantee of future results.
Each index reflects an unmanaged universe of securities without any deduction for advisory fees or other expenses that would reduce actual returns, as well as the reinvestment of all income and dividends. An actual investment in the securities included in the index would require an investor to incur transaction costs, which would lower the performance results. Indices are not actively managed and investors cannot invest directly in the indices.
S&P 500®: Standard & Poor’s (S&P) 500® Index. The S&P 500® Index is an unmanaged, capitalization-weighted index designed to measure the performance of the broad US economy through changes in the aggregate market value of 500 stocks representing all major industries.
Sector/Industries: Sector/industry references in this report are in accordance with the Global Industry Classification Standard (GICSR) developed by MSCI Barra and Standard & Poor’s. The GICS structure consists of 10 sectors, 24 industry groups, 68 industries and 154 sub-industries.
Long-term Treasury Index: BofA Merrill Lynch 15+ Year US Treasury Index. The BofA Merrill Lynch 15+ Year US Treasury Index is an unmanaged index comprised of US Treasury securities, other than inflation-protected securities and STRIPS, with at least $1 billion in outstanding face value and a remaining term to final maturity of at least 15 years.
© Copyright 2016 Richard Bernstein Advisors LLC. All rights reserved.
PAST PERFORMANCE IS NO GUARANTEE OF FUTURE RESULTS
Nothing contained herein constitutes tax, legal, insurance or investment advice, or the recommendation of or an offer to sell, or the solicitation of an offer to buy or invest in any investment product, vehicle, service or instrument. Such an offer or solicitation may only be made by delivery to a prospective investor of formal offering materials, including subscription or account documents or forms, which include detailed discussions of the terms of the respective product, vehicle, service or instrument, including the principal risk factors that might impact such a purchase or investment, and which should be reviewed carefully by any such investor before making the decision to invest. Links to appearances and articles by Richard Bernstein, whether in the press, on television or otherwise, are provided for informational purposes only and in no way should be considered a recommendation of any particular investment product, vehicle, service or instrument or the rendering of investment advice, which must always be evaluated by a prospective investor in consultation with his or her own financial adviser and in light of his or her own circumstances, including the investor's investment horizon, appetite for risk, and ability to withstand a potential loss of some or all of an investment's value. Investing is subject to market risks. Investors acknowledge and accept the potential loss of some or all of an investment's value. Past performance is, of course, no guarantee of future results. Views represented are subject to change at the sole discretion of Richard Bernstein Advisors LLC. Richard Bernstein Advisors LLC does not undertake to advise you of any changes in the views expressed herein


