“New normal”: Not new. Just normal.
Membership required
Membership is now required to use this feature. To learn more:
View Membership BenefitsThere is a broad consensus that equities are in a “low return environment”. Although such fears might have been expected following 2008’s bear market, it is surprising that the low-return rhetoric continues despite that the bull market is now more than 7 years old.
Fears that returns would be lower than normal have fostered grave misperceptions that have hurt overall portfolios’ performance. Despite investors’ fears, this cycle’s returns have actually been quite normal over various time horizons.
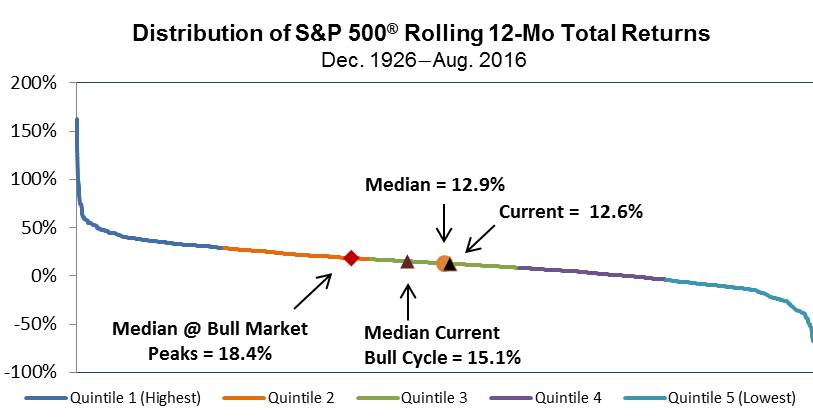
Chart 1 shows the distribution of all rolling 12-month total returns from December 1926 onward delineated by quintile. The most recent 12-month return of 12.6% looks normal, sitting just slightly below the median of 12.9%.
CHART 1
Source: Richard Bernstein Advisors LLC, Standard & Poor’s, Morningstar For Index descriptors, see "Index Descriptions" at end of document. Past performance is no guarantee of future results.
This cycle’s median 12-month return does not appear extreme or over-heating of the bull market. Although easily above the long-term median, the current bull market’s median 12-month return of 15.1% remains in the middle quintile historically, whereas the typical median total return at stock market peaks was 18.4%.
Longer-term performance appears quite normal – Neither too hot nor too cold
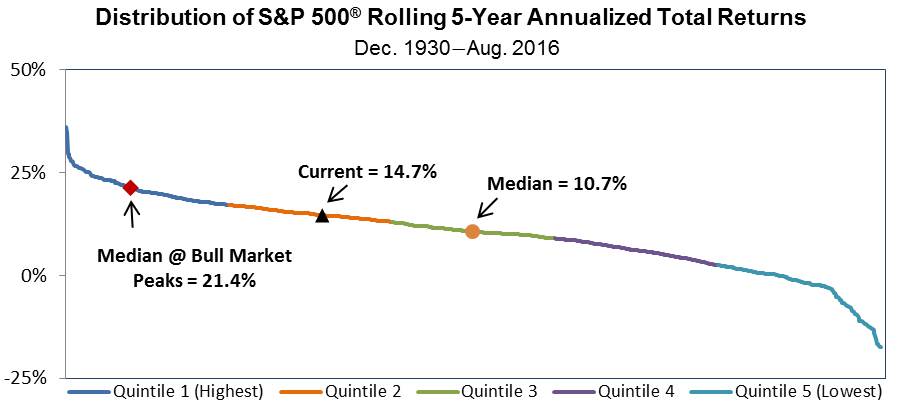
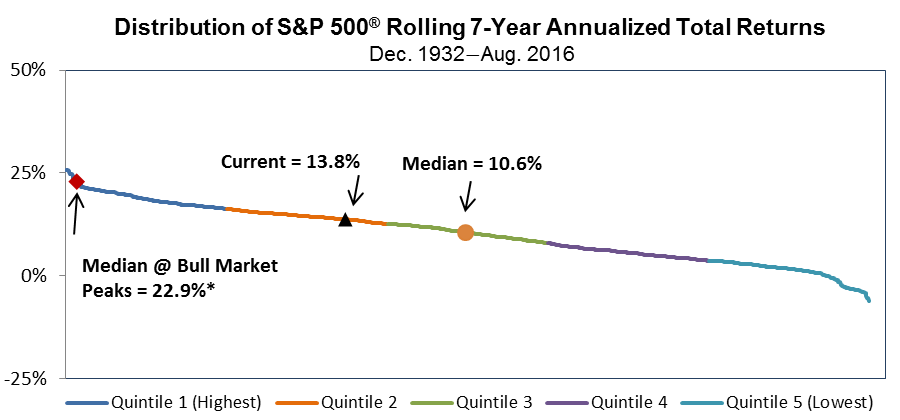
Over either a 3-year, a 5-year or a 7-year annualized horizon, the returns distribution charts below also highlight that current returns look normal. Each period’s returns are above their long-term median. However these returns certainly do not suggest the euphoric excess that has typically accompanied prior bull market peaks.
CHART 2
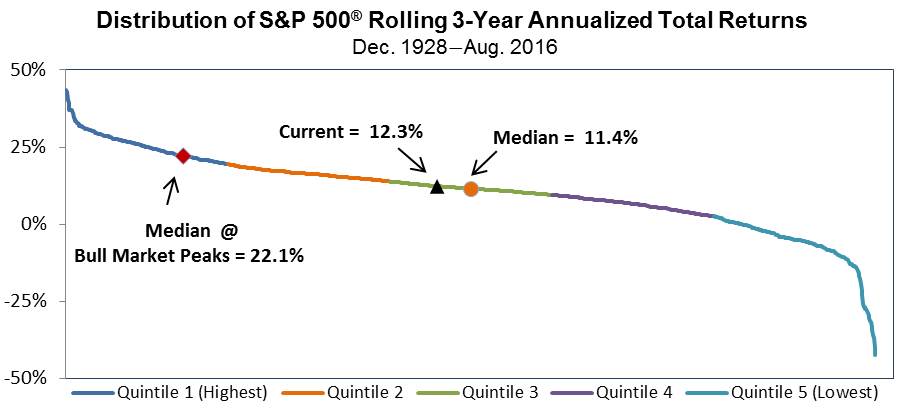
CHART 3
Source: Richard Bernstein Advisors LLC, Standard & Poors, Morningstar. * Includes prior bull markets with the full return period available. For Index descriptors, see "Index Descriptions" at end of document. Past performance is no guarantee of future results.
CHART 4
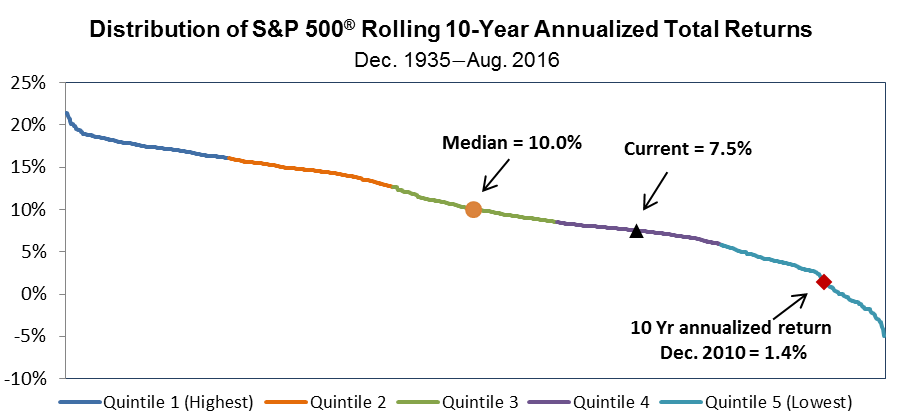
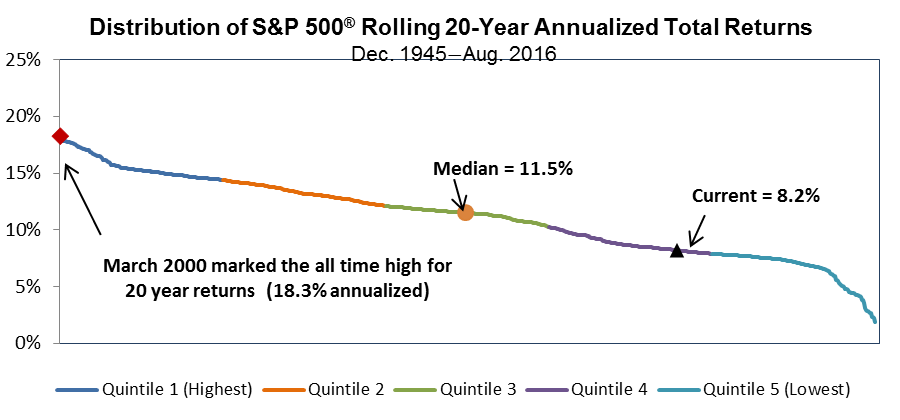
When examining a 10- or 20-year time horizon, one can see the impact of the “lost decade” (i.e . the low return environment of the 2000’s). Annualized returns drop well below the median for these time horizons.
CHART 5
Source: Richard Bernstein Advisors LLC, Standard & Poors, Morningstar. * Includes prior bull markets with the full return period available. For Index descriptors, see "Index Descriptions" at end of document. Past performance is no guarantee of future results.
CHART 6
Source: Richard Bernstein Advisors LLC, Standard & Poors, Morningstar. For Index descriptors, see "Index Descriptions" at end of document. Past performance is no guarantee of future results.
A low return environment or simply poor asset allocation choices?
Although it is widely accepted that equities are mired in a period of low returns, the data suggest the rhetoric appears to be a significant misperception. Actual returns appear to be quite normal (i.e., neither too hot nor too cold) for the ongoing bull market, regardless of the time horizon reviewed.
While it is true that historical returns that incorporate 10 and 20 years appear well below normal, those inferior returns appear to be attributable to the “lost decade” of the 2000s and not to the current cycle’s returns. In other words, the so-called low return environment already occurred and equity returns are returning to normal.
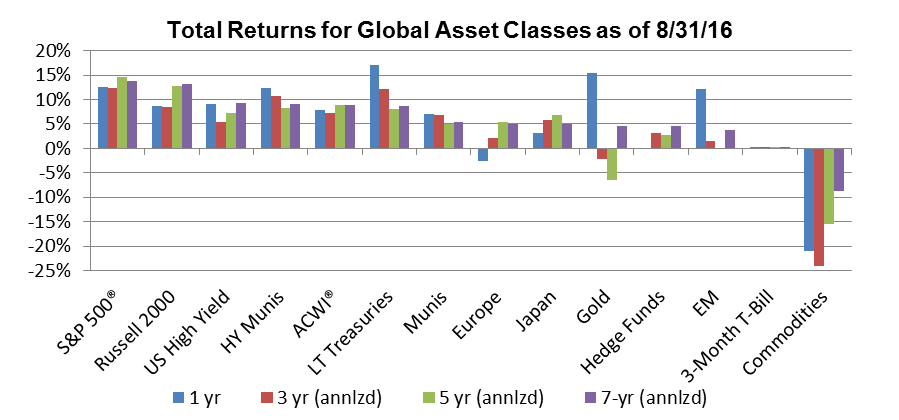
Chart 7 on the next page shows major asset class performance over the past 1,3,5 and 7-year time horizons. Clearly US equities have had strong absolute as well as strong relative performance over each of these periods. However a number of asset classes have not fared well at all. It appears the misperception that low returns are the ongoing norm may merely be the result of investors’ poor asset allocation decisions over the past several years.
The opportunity cost of misperception and poor asset allocation has been very high. Both institutional and individual investors have largely missed out on an annualized return of roughly 14% in the past seven years in the US equity market, and recent surveys and flow of funds suggest investors generally remain wallflowers.
It appears as though there is nothing “new” about the “new normal”. It’s simply “normal”.
CHART 7
Source: Richard Bernstein Advisors LLC, Standard & Poors, MSCI, HFRI BofA Merrill Lynch. For Index descriptors, see "Index Descriptions" at end of document. Past performance is no guarantee of future results. *Hedge Fund performance latest available thru 7/31/16.
INDEX DESCRIPTIONS:
The following descriptions, while believed to be accurate, are in some cases abbreviated versions of more detailed or comprehensive definitions available from the sponsors or originators of the respective indices. Anyone interested in such further details is free to consult each such sponsor’s or originator’s website.
The past performance of an index is not a guarantee of future results.
Each index reflects an unmanaged universe of securities without any deduction for advisory fees or other expenses that would reduce actual returns, as well as the reinvestment of all income and dividends. An actual investment in the securities included in the index would require an investor to incur transaction costs, which would lower the performance results. Indices are not actively managed and investors cannot invest directly in the indices.
MSCI All Country World Index (ACWI®): The MSCI ACWI® Index is a widely recognized, free-float-adjusted, market-capitalization-weighted index designed to measure the equity-market performance of developed markets.
S&P 500®: Standard & Poor’s (S&P) 500® Index. The S&P 500® Index is an unmanaged, capitalization-weighted index designed to measure the performance of the broad US economy through changes in the aggregate market value of 500 stocks representing all major industries.
Russell 2000: Russell 2000 Index. The Russell 2000 Index is an unmanaged, capitalization-weighted index designed to measure the performance of the small-cap segment of the US equity universe. The Russell 2000 Index is a subset of the Russell 3000® Index.
Europe: MSCI Europe Index. The MSCI Europe Index is a free-float-adjusted, market-capitalization-weighted index designed to measure the equity-market performance of the developed markets in Europe. The MSCI Europe Index consists of the following 16 developed market country indices: Austria, Belgium, Denmark, Finland, France, Germany, Greece, Ireland, Italy, the Netherlands, Norway, Portugal, Spain, Sweden, Switzerland, and the United Kingdom
Japan: MSCI Japan Index: The MSCI Japan Index is a free-float-adjusted, market-capitalization-weighted index designed to measure the equity-market performance of Japan.
EM Equity: MSCI Emerging Markets (EM) Index. The MSCI EM Index is a free-float-adjusted, market-capitalization-weighted index designed to measure the equity-market performance of emerging markets.
Gold: Gold Spot USD/oz Bloomberg GOLDS Commodity. The Gold Spot price is quoted as US Dollars per Troy Ounce.
Commodities: S&P GSCI® Index. The S&P GSCI® seeks to provide investors with a reliable and publicly available benchmark for investment performance in the commodity markets, and is designed to be a “tradable” index. The index is calculated primarily on a world production-weighted basis and is comprised of the principal physical commodities that are the subject of active, liquid futures markets.
Hedge Fund Index: HFRI Fund Weighted Composite Index. The HFRI Fund Weighted Composite Index is a global, equal-weighted index of over 2,000 single-manager funds that report to the HFR (Hedge Fund Research) database. Constituent funds report monthly net-of-all-fees performance in USD and have a minimum of $50 million under management or a twelve (12)-month track record of active performance. The Index includes both domestic (US) and offshore funds, and does not include any funds of funds.
3-Mo T-Bills: BofA Merrill Lynch 3-Month US Treasury Bill Index. The BofA Merrill Lynch 3-Month US Treasury Bill Index is comprised of a single issue purchased at the beginning of the month and held for a full month. The Index is rebalanced monthly and the issue selected is the outstanding Treasury Bill that matures closest to, but not beyond, three months from the rebalancing date.
Long-term Treasury Index: BofA Merrill Lynch 15+ Year US Treasury Index. The BofA Merrill Lynch 15+ Year US Treasury Index is an unmanaged index comprised of US Treasury securities, other than inflation-protected securities and STRIPS, with at least $1 billion in outstanding face value and a remaining term to final maturity of at least 15 years.
Municipals: BofA Merrill Lynch US Municipal Securities Index. The BofA Merrill Lynch US Municipal Securities Index tracks the performance of USD-denominated, investment-grade rated, tax-exempt debt publicly issued by US states and territories (and their political subdivisions) in the US domestic market. Qualifying securities must have at least one year remaining term to final maturity, a fixed coupon schedule, and an investment-grade rating (based on an average of Moody’s, S&P and Fitch). Minimum size requirements vary based on the initial term to final maturity at the time of issuance.
High Yield Municipals: The Barclays Municipal Custom High Yield Composite Index. The Barclays Municipal Custom High Yield Composite Index is calculated using a market value weighting methodology and it tracks the high-yield municipal bond market with a 75% weight in non-investment grade municipal bonds and a 25% weight in Baa/BBB-rated investment grade municipal bonds for liquidity and balance.
U.S. High Yield: BofA Merrill Lynch US Cash Pay High Yield Index. The BofA Merrill Lynch US Cash Pay High Yield Index tracks the performance of USD-denominated, below-investment-grade-rated corporate debt, currently in a coupon-paying period, that is publicly issued in the US domestic market. Qualifying securities must have a below-investment-grade rating (based on an average of Moody’s, S&P and Fitch) and an investment-grade-rated country of risk (based on an average of Moody’s, S&P and Fitch foreign currency long-term sovereign debt ratings), at least one year remaining term to final maturity, a fixed coupon schedule, and a minimum amount outstanding of $100 million.
© Copyright 2016 Richard Bernstein Advisors LLC. All rights reserved.
PAST PERFORMANCE IS NO GUARANTEE OF FUTURE RESULTS
Nothing contained herein constitutes tax, legal, insurance or investment advice, or the recommendation of or an offer to sell, or the solicitation of an offer to buy or invest in any investment product, vehicle, service or instrument. Such an offer or solicitation may only be made by delivery to a prospective investor of formal offering materials, including subscription or account documents or forms, which include detailed discussions of the terms of the respective product, vehicle, service or instrument, including the principal risk factors that might impact such a purchase or investment, and which should be reviewed carefully by any such investor before making the decision to invest. Links to appearances and articles by Richard Bernstein, whether in the press, on television or otherwise, are provided for informational purposes only and in no way should be considered a recommendation of any particular investment product, vehicle, service or instrument or the rendering of investment advice, which must always be evaluated by a prospective investor in consultation with his or her own financial adviser and in light of his or her own circumstances, including the investor's investment horizon, appetite for risk, and ability to withstand a potential loss of some or all of an investment's value. Investing is subject to market risks. Investors acknowledge and accept the potential loss of some or all of an investment's value. Past performance is, of course, no guarantee of future results. Views represented are subject to change at the sole discretion of Richard Bernstein Advisors LLC. Richard Bernstein Advisors LLC does not undertake to advise you of any changes in the views expressed herein.
Membership required
Membership is now required to use this feature. To learn more:
View Membership BenefitsSponsored Content
Upcoming Virtual Events View All


