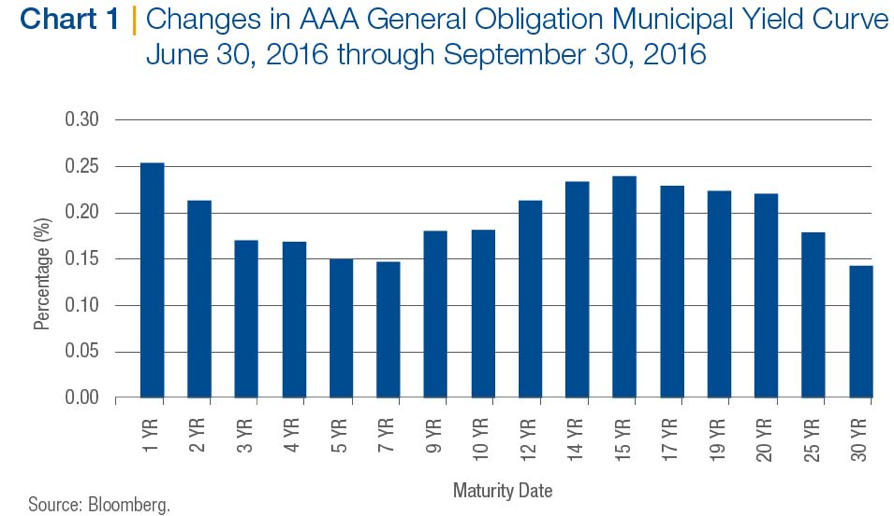
It was an interesting quarter in the fixed income markets and the municipal markets in particular, ranging from "Brexit" in the United Kingdom to the Federal Reserve Board (Fed) threatening to raise the Fed funds rate yet again (sounding like "Chicken Little"). In addition to these macro-level events, the fixed income markets were positioning themselves for new money market fund regulations, which took effect October 14. In the municipal bond market, the normally quiet period of June through September was treated with about 20% more new issue supply than last year. All these forces joined together to put upward pressure on interest rates. A 10-year AAA general obligation municipal bond yielded 1.34% on June 30, 2016, and ended the quarter on September 30, 2016, yielding 1.52%. Chart 1 below shows the impact of these events across the entire yield curve.
On June 23, 2016, British voters, in a populist uprising that brought down the government of David Cameron, voted to leave the European Union. It wasn't only Cameron's government that tumbled, the S&P 500 Index lost about 113 points during the ensuing two days as pundit analysis went from this event being a harbinger of "the end of the world as we know it" to "no big deal." The index recovered all of its post-Brexit losses by July 8, so the "no big deal" camp won. The 10-year U.S. Treasury bond had a similar ride, but in the opposite direction. Yields went from about 1.75% pre-Brexit to a low of 1.36% post-Brexit on July 8 (bond prices move in the opposite direction of yields). By the end of September, the 10-year U.S. Treasury was yielding 1.60%; I guess another market rejected "the end of the world" scenario.
The Fed—citing the Brexit vote and a punk May jobs report in an otherwise healthy series—found yet another reason not to increase short-term interest rates, reminding the markets that they may take such action at any future meetings (dependent on the data, as always). With the subsequent release of the minutes of the September Fed meeting, the markets saw how the debate unfolded to cause three voting members to dissent in the final tally.
The time leading up to the approaching October 14 effective date for new SEC money market regulations caused some interesting anomalies in the front end of both the taxable and tax-exempt markets. As the deadline drew near, and investors re-align their money market investments between prime and government money markets, intermediaries have been deluged with Variable Rate Demand Notes (VRDNs), very liquid, highly rated securities that do not fit the definition of government security. These very same intermediaries, toiling under new federal regulation and the watchful eye of U.S. Senator Elizabeth Warren, find placing these securities in their inventory (read "on their balance sheets") to be quite burdensome. So they raise the yield on these securities to whatever level is necessary to clear the market. That means securities that yielded 0.01% in March 2016 now yield 0.87% today. This is wonderful for investors like Thornburg that have higher reserve levels than usual. It is not so good for issuers who have a significant exposure to the short end of the municipal market. This situation also highlights another factor that we have written about and keeps us up at night: the illiquidity of the fixed income markets. Short-term rates have increased so much that investors have to move out to the three-year maturity range to find comparable yields.
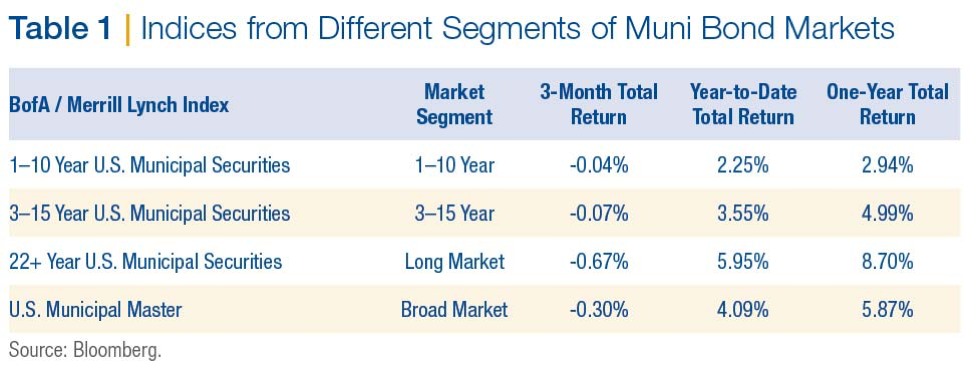
Over the third quarter, returns in all segments of the municipal market were negative, but on a year-to-date basis remain positive. Table 1 below shows the results of several leading BofA / Merrill Lynch indices from across different segments of the municipal bond market.
The value metrics we use at Thornburg all point to the fact the municipal bond market is pricing in the rosiest of scenarios going forward. The main reason for this is that global central banks, with their overly accommodative monetary policies, have pushed investors further out on the risk spectrum in search of yield. Let's first look at real yields, which is the amount of yield greater than inflation that investors are being paid to own municipal bonds. As alluded to above, a 10-year AAA general obligation bond is yielding 1.64% and Core PCE is running at 1.70%, so investors are earning less than inflation. Over the last 20 years, investors have earned an average of 2% over inflation for the opportunity to invest in a 10-year AAA general obligation municipal bond.
The second thing to consider are credit spreads, which reflect the incremental yield an investor earns from owning a lower-rated credit versus a higher rated credit, and which are now very narrow. As of September 30, 2016, an investor earned about 1% more for owning a 10-year BBB revenue bond versus a 10-year AAA general obligation bond. That is slightly higher than the average 0.75% an investor earned between 1994 and 2007. In 2007, approximately 50% of the new issue municipal bond market was insured by AAA/AAA municipal bond insurers. Today, there are no AAA/AAA municipal bond insurers, and insurance coverage in general accounts for just 6% to 8% of the new issue municipal bond market. On top of that, the security covenants of current lower-quality investment-grade securities are the most lax in years. This is a great time to be an issuer of lower-quality investment-grade municipal bonds but not a great time to be an investor in them.
Finally, the slope of the yield curve, which tracks how much incremental yield an investor earns by owning securities with longer maturities, is also quite flat. Currently, investors are earning 0.78% for owning a 10-year AAA general obligation municipal bond, versus a one-year AAA general obligation municipal bond. Since 1994, an investor earned on average almost 1.6% to extend maturities from one to 10 years. The stretch for income is causing investors to absorb more risk at lower and lower relative yields.
One of the best risk mitigating tools an investor has is diversification. By splitting a portfolio into several asset classes, an investor can reduce the volatility of that portfolio's returns. This is because the returns of various asset classes are not always correlated. There are times when this is not the case, such as the 2008 financial crisis when all correlations went to 1. For the long-term investor, however, the benefits of diversification stand firm. When added to a portfolio of stocks, municipal bonds tend to reduce the volatility of the combined portfolio. Strategies that utilize laddered structure are an ideal choice in a total diversified portfolio of stocks and bonds.
Thank you for your continued trust in us.
Performance data shown represents past performance and is no guarantee of future results. Investment return and principal value will fluctuate so shares, when redeemed, may be worth more or less than their original cost. Current performance may be lower or higher than quoted. For performance current to the most recent month end, see the mutual funds performance page or call 877-215-1330. The Low Duration and Limited Term funds have a maximum sales charge of 1.50%. The Intermediate Municipal Fund and the Strategic Municipal Income Fund have a maximum sales charge of 2.00%.
Important Information
Before investing, carefully consider the Fund’s investment goals, risks, charges, and expenses. For a prospectus or summary prospectus containing this and other information, contact your financial advisor or visit our literature center. Read them carefully before investing.
Unless otherwise noted, the source of all data is Thornburg Investment Management, Inc., as of 9/30/16.
Investments carry risks, including possible loss of principal. Portfolios investing in bonds have the same interest rate, inflation, and credit risks that are associated with the underlying bonds. The value of bonds will fluctuate relative to changes in interest rates, decreasing when interest rates rise. This effect is more pronounced for longer-term bonds. Unlike bonds, bond funds have ongoing fees and expenses. Investments in lower rated and unrated bonds may be more sensitive to default, downgrades, and market volatility; these investments may also be less liquid than higher rated bonds. Investments in derivatives are subject to the risks associated with the securities or other assets underlying the pool of securities, including illiquidity and difficulty in valuation. Investments in the Fund are not FDIC insured, nor are they bank deposits or guaranteed by a bank or any other entity.
The views expressed by the portfolio managers reflect their professional opinions and are subject to change. Under no circumstances does the information contained within represent a recommendation to buy or sell any security.
Class I shares may not be available to all investors. Minimum investments for the I share class may be higher than those for other classes.
Diversification does not assure or guarantee better performance and cannot eliminate the risk of investment losses.
Income earned from municipal bonds is exempt from regular federal and in some cases, state and local income tax. Income may be subject to the alternative minimum tax (AMT).
There is no guarantee that the Fund will meet its investment objectives.
Please see our glossary for a definition of terms.
Thornburg mutual funds are distributed by Thornburg Securities Corporation.
Thornburg Investment Management, Inc. mutual funds are sold through investment professionals including investment advisors, brokerage firms, bank trust departments, trust companies and certain other financial intermediaries. Thornburg Securities Corporation (TSC) does not act as broker of record for investors.
© Thornburg Investment Management