In a recent report we demonstrated that, contrary to popular belief, investors are not faced with a low return environment. Through October 31st, the annualized five-year return on the S&P 500® exceeded 13%. We asked how long will returns need to exceed expectations before investors will admit that the financial markets are not in a low return environment? (See, http://www.rbadvisors.com/images/pdfs/New_normal.pdf).
It appears that a fear of equities and the resulting poor asset allocations have resulted in below normal returns. Investors as a group seem to be rationalizing their poor returns by agreeing with each other that it is difficult to achieve higher returns. The reality, however, is that equities are providing higher returns, and the opportunity cost of under-weighting equities is growing.
It’s fear. It’s not demographics
Many observers have claimed that investors’ search for more conservative investments is attributable to demographics. It is common to hear that the baby-boomers are aging and have a greater need for income-producing investments.
We have disagreed with this theory. Of course it is true that the baby-boomers are aging, but their preference for fixed-income and income-oriented equity seems to be more a function of fear than of demographics. They feel that investing for income is safe, but investing for capital appreciation is risky. 2008’s stock market debacle remains fresh in their memories, and income-producing strategies outperformed during that time because of the low betas imbedded in dividend strategies, and because of the negative correlation that existed between treasuries and stocks.
Safe strategies are safe until everyone thinks they are safe and makes those strategies the core of their portfolios. The over popularity of any strategy is ultimately its demise because valuations get stretched and the underlying macroeconomic environment typically changes. Investors can be left with overvalued investments that may be inappropriate for a subsequent economic setting.
That appears to be the case today with many fixed-income investments. “Lower for longer” was this past summer’s popular investment theme, but the popularity of that theme coincided with the trough in inflation expectations.
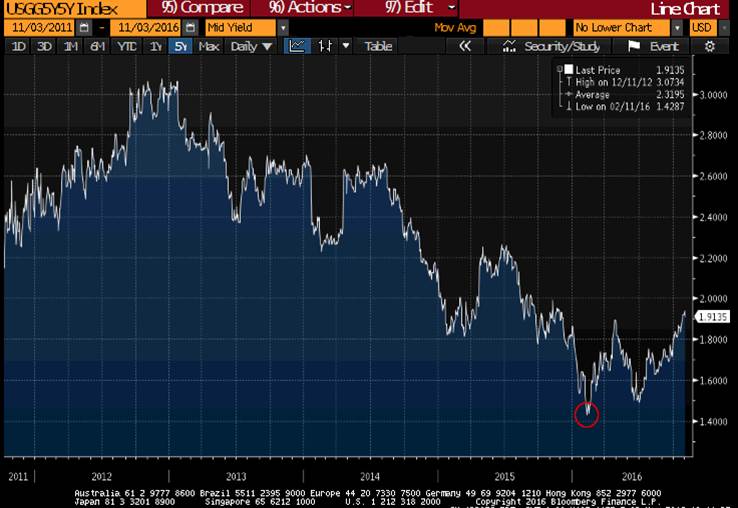
Chart 1 shows the 5-year 5-year forward inflation breakeven, which is supposedly the Fed’s favorite measure of inflation expectations. Inflation expectations in the US appeared to have troughed in February. It seems unreasonable to expect broad fixed-income returns to be attractive if the recent trend in inflation expectations continues.
The US is not the only country in which inflation expectations have started to increase. Inflation expectations in the UK and in Germany are similarly rising, and they are stabilizing in Japan.
Chart 1:
US 5-Year 5-Year Forward Breakeven

Source: Bloomberg Finance L.P.
The opportunity cost
Few investors seem to appreciate the magnitude of the opportunity cost of avoiding equities. Individuals, pensions, endowments, foundations, and hedge funds have all suffered sub-par returns because of their fear of the equity market.
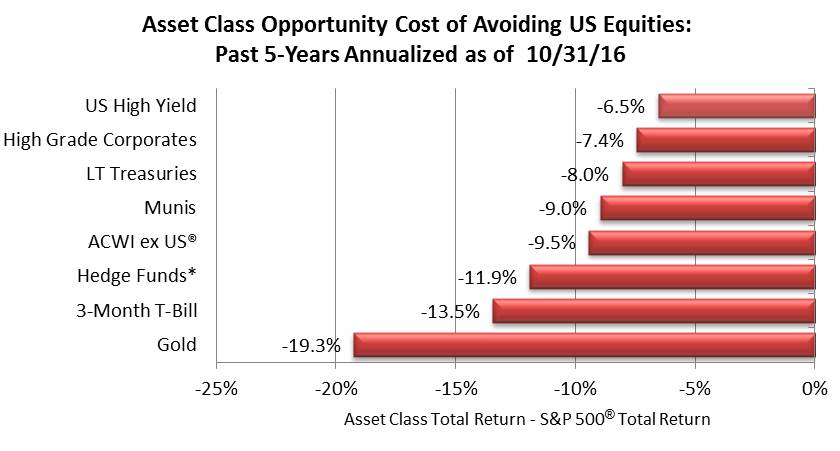
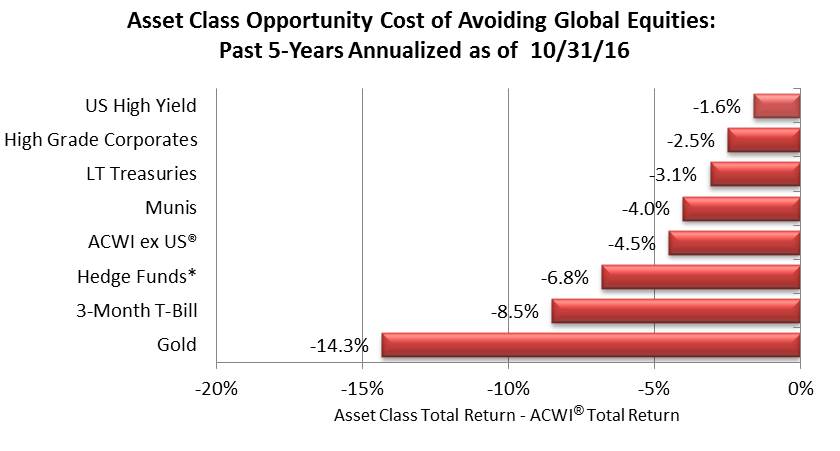
The following two charts show the cost of being scared of equities over the past five years. Chart 2 shows the relative performance of various asset classes’ annualized returns versus the S&P 500®’s, and Chart 3 shows the same comparison versus global equities.
When comparing five-year returns against the S&P 500®, the closest performing asset class was US High Yield Bonds. However, the opportunity cost was over 650 basis points per year! Paying 650 basis points per year for perceived safety seems exorbitant. Although the opportunity cost versus global equities was not nearly as high (the US stock market has outperformed global markets), it was still meaningful. Instead of paying over 650 basis points per year, US High Yield only cost 160 basis points per year. That seems a high cost for an asset class with performance that is strongly correlated to that of equities.
CHART 2:
Source: Richard Bernstein Advisors LLC, MSCI, Standard & Poor’s, BofA Merrill Lynch, Bloomberg Finance L.P. * Hedge Fund performance not yet reported for 10/31/16 so is lagged a month. For Index descriptors, see "Index Descriptions" at end of document.
Chart 3:
Source: Richard Bernstein Advisors LLC, MSCI, Standard & Poor’s, BofA Merrill Lynch, Bloomberg Finance L.P. * Hedge Fund performance not yet reported for 10/31/16 so is lagged a month. For Index descriptors, see "Index Descriptions" at end of document.
Is your portfolio missing out?
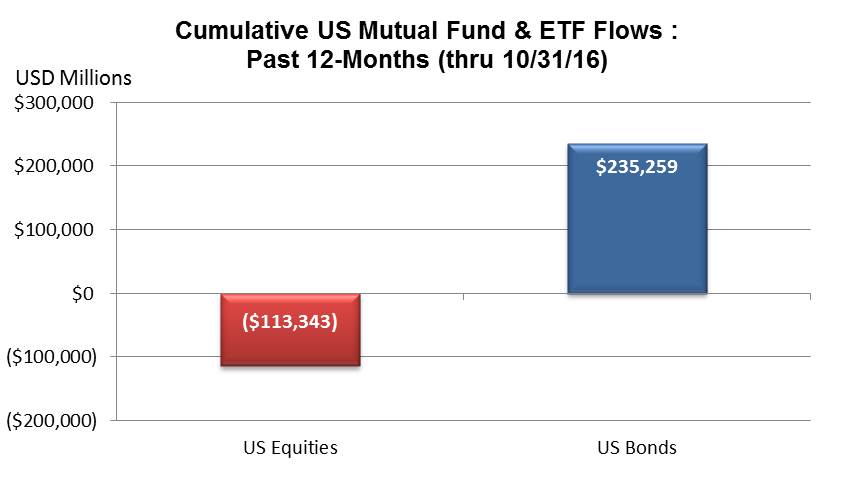
It is incredible that investors have basically been wallflowers during the second longest bull market of the post-war period. Investors’ fears about 2008’s bear market repeating has led them to avoid equities and take unrecognized risks in other asset classes. Chart 4 on the next page highlights that this misallocation of investment capital has continued even during the last year.
Chart 4:
Source: Investment Company Institute (ICI). October flows based on ICI weekly estimated flows.
Meanwhile, pensions remain underfunded, hedge fund performance has suffered, and individuals are worried about saving for retirement as the opportunity cost of not investing in equities grows. Proper asset allocation could help alleviate some of those issues.
It’s prudent to be somewhat fearful of riskier assets, but one needs to judge the opportunity cost and potential returns one is giving up to protect one’s portfolio against downside risk. As we have since 2010, we believe that investors are too scared of the equity market and are paying too much for downside protection. Their portfolios may be missing out.
INDEX DESCRIPTIONS:
The following descriptions, while believed to be accurate, are in some cases abbreviated versions of more detailed or comprehensive definitions available from the sponsors or originators of the respective indices. Anyone interested in such further details is free to consult each such sponsor’s or originator’s website.
The past performance of an index is not a guarantee of future results.
Each index reflects an unmanaged universe of securities without any deduction for advisory fees or other expenses that would reduce actual returns, as well as the reinvestment of all income and dividends. An actual investment in the securities included in the index would require an investor to incur transaction costs, which would lower the performance results. Indices are not actively managed and investors cannot invest directly in the indices.
S&P 500®: Standard & Poor’s (S&P) 500® Index. The S&P 500® Index is an unmanaged, capitalization-weighted index designed to measure the performance of the broad US economy through changes in the aggregate market value of 500 stocks representing all major industries.
ACWI®: MSCI All Country World Index (ACWI®): The MSCI ACWI® Index is a widely recognized, free-float-adjusted, market-capitalization-weighted index designed to measure the equity-market performance of developed markets.
ACWI® ex US: MSCI ACWI® exluding United States Index : The MSCI World Index ex-US index is a free-float-adjusted, market-capitalization-weighted index designed to measure the equity-market performance of developed markets excluding the United States..
Gold: Gold Spot USD/oz Bloomberg GOLDS Commodity. The Gold Spot price is quoted as US Dollars per Troy Ounce.
Hedge Fund Index: HFRI Fund Weighted Composite Index. The HFRI Fund Weighted Composite Index is a global, equal-weighted index of over 2,000 single-manager funds that report to the HFR (Hedge Fund Research) database. Constituent funds report monthly net-of-all-fees performance in USD and have a minimum of $50 million under management or a twelve (12)-month track record of active performance. The Index includes both domestic (US) and offshore funds, and does not include any funds of funds.
3-Mo T-Bills: BofA Merrill Lynch 3-Month US Treasury Bill Index. The BofA Merrill Lynch 3-Month US Treasury Bill Index is comprised of a single issue purchased at the beginning of the month and held for a full month. The Index is rebalanced monthly and the issue selected is the outstanding Treasury Bill that matures closest to, but not beyond, three months from the rebalancing date.
Long-term Treasury Index: BofA Merrill Lynch 15+ Year US Treasury Index. The BofA Merrill Lynch 15+ Year US Treasury Index is an unmanaged index comprised of US Treasury securities, other than inflation-protected securities and STRIPS, with at least $1 billion in outstanding face value and a remaining term to final maturity of at least 15 years.
© Richard Bernstein Advisors LLC
© Richard Bernstein Advisors
Read more commentaries by Richard Bernstein Advisors