NOVEMBER 2016 TO BE A MONTH NOT SOON FORGOTTEN AS SEISMIC POLITICAL AND FINANCIAL SHIFTS CONTINUE
Donald Trump’s largely unexpected victory of the U.S. presidential election echoed the Brexit vote of just six months prior, reinforcing an ongoing fundamental shift in political currents and capital markets around the globe.
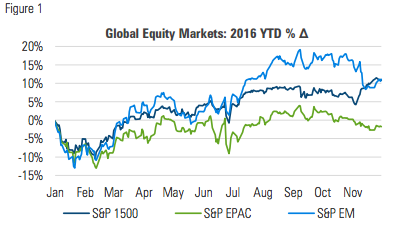
GLOBAL EQUITY MARKETS DIVERGED AFTER ELECTION AS INVESTORS ABSORBED IMPLICATIONS OF TRUMP PRESIDENCY
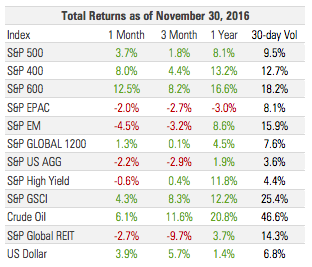
Developed and emerging equity markets declined in November while US markets pushed higher, led by small- and mid-cap stocks:
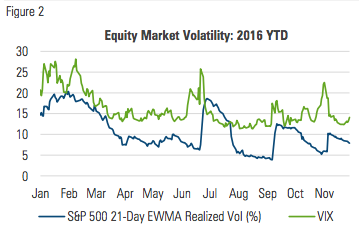
Higher equity market volatility in early November abated as the month wore on and markets digested the results of the election:
MANAGED RISK PORTFOLIOS
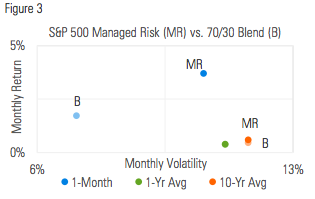
The S&P 500 Managed Risk Index (which has a 0% bond allocation and volatility target of 18%) once again maintained a 100% equity allocation through November, the fourth consecutive calendar month it has done so. Volatility came close to breaking through the index’s target of 18%, but retreated without causing any reduction in equity exposure.
The return of S&P 500 Managed Risk Index matched that of the S&P 500, and more than doubled the return of a 70/30 blend:
Last month’s commentary examined the idea of “an ounce of prevention being worth a pound of cure” in the context of investing. A simple illustration looking at the last 30 years of daily stock market returns showed that avoiding the 10 worst days had a much larger absolute effect than missing the 10 best days.
On the one hand, the simplicity of the illustration offers valuable insight by plainly differentiating the effects of not participating in the market’s best and worst returns. The difference in the results is remarkable.
On the other hand, the illustration leaves more to be desired. In reality no investor captures all the best days without also participating in the worst days. Absent the ability to peer into the future, investors either participate fully in both the best and worst returns, or make a tradeoff to mitigate downside participation in exchange for some of the upside.
Figure four expands on the initial illustration by considering varying degrees of tradeoffs. The two orange dots show the results of the first illustration, with the full removal of either the 10 best or worst days from the time series. From 1987 through 2016, capturing 0% of the S&P 500’s return on its worst days while still capturing 100% on its best days would have resulted in an annualized return of 13.7% with volatility of 17.5%. Inversely, capturing 100% on the worst days and 0% on the best days would have resulted in a return of 7.5% with volatility of 17.8%.
The blue dots depict varying degrees of tradeoffs in 10 percent increments. Point A in the chart shows the effect of capturing 20% of the returns on the 10 worst days and 80% of the returns on the 10 best days. For example, if one of the 10 worst returns was -10%, the results in point A would be a function of changing that day’s return to -2%, since it’s capturing 20% of the returns from the worst days. Inversely, point B captures 80% of the returns on the worst days and 20% on the best days.
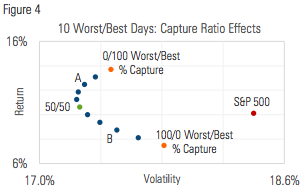
This chart highlights again the disproportionate implications of mitigating severe negative returns, relative to capturing the largest positive returns. But it also goes one step further in providing a glimpse into the nature and effects of tradeoffs. The shape of the curve is noteworthy, reflecting the change in riskadjusted returns as it makes its way from one extreme to the other. The green dot pinpoints the result of capturing 50% of the returns on both the best and worst days: a 10.6% return with volatility of 17.3%. This return is higher than that of the S&P 500, with less volatility.
Figure five shows the effects of a slightly different approach that captures equal amounts of the returns from the 10 best and worst days:
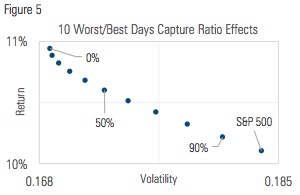
With each incremental reduction in participation of the best and worst returns, the risk-adjusted return gets incrementally better. The implication here again is that the case for an approach that gives up exposure to the largest upswings in pursuit of downside mitigation, is worth consideration.
Of course it’s one thing to want to reduce downside participation. It is another, however, to have to pay for it. If there’s anything to be gleaned from this simple thought experiment, it is perhaps that investors can indeed trade substantial upside participation for downside mitigation and still maintain the potential to come out ahead.
Put another way, an approach that mitigates the severest downside at the expense of upside is preferable in the long run to one that aims to capture all the upside, but has to endure and recover from the full depths of drawdowns. This is especially relevant for investors relying on their investments for income.
MARKET COMMENTARY
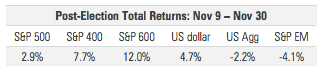
November 2016 was a month to remember. President Obama noted in September, “My legacy is on the ballot.” Voters elected to move in a different direction and chose Donald Trump as the 44th president of the United States. They also strengthened conservative control of congress and brought a total of 68 (of 98) state legislative chambers and 33 governorships under the same. The reaction of financial markets reflected the magnitude and depth of the shift in the political landscape:
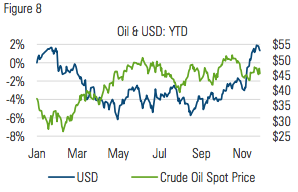
August 19 marked a significant change in direction for the US dollar. Down more than 5% year-to-date, the dollar reversed course, setting out on steady upward path into November. Incidentally, the dollar’s move began just two days after a Trump campaign reorganization brought Steve Bannon and Kellyanne Conway on board for the final push. Down 2.5% y-t-d heading into Election Day, the dollar accelerated in the days following the election, finishing November up 7.6% from its August inflection.
Apart from the dollar’s move, perhaps nothing was more indicative of the market’s seismic shift than the increase in interest rates. The November rise in yields marked the biggest one month loss for the aggregate US bond market since September 2008.
Like the dollar, rates had been on a steady upward trend since mid-summer. From its all-time low of 1.36% on July 8, the yield on the 10-Yr US Treasury had climbed nearly 50 bps to 1.84% on Election Day. By month’s end, the yield had again increased by another 50 bps, albeit in a fraction of the time.
The last move of such magnitude occurred during the so-called “taper tantrum” of 2013, when Ben Bernanke hinted that the Fed could begin to taper its QE3 asset purchases:
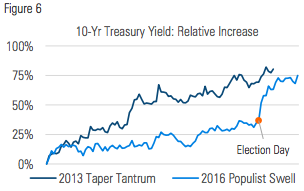
The end of the 2013 taper tantrum rate increase marked the beginning of a three-year decline in rates. Whether or not more pain lies ahead for bond investors today will be a function of the nature of policy changes that ensue and how deeply they take root. This result may also offer insight into the effect that changing age demographics are having on market dynamics.
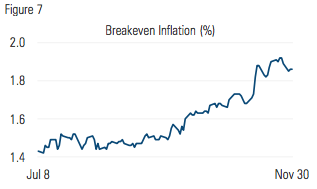
Notably, approximately half the increase in nominal rates over the last four months has been due to a rise in real rates, while the other half has reflected a substantial increase in inflation expectations. While still short of the Fed target, the increase helps make the case for rate hikes down the road:
Equity markets weren’t immune to the changes either as different segments exhibited varying responses. At the broadest levels, US markets climbed while developed and EM retreated. Among US sectors, financial stocks rose sharply while utilities and consumer staples saw the largest declines.
Remarkably, mid- and small-cap stocks handily outperformed large caps after the election, likely due in part to the substantial proportion of large-cap revenues generated outside the US. The stronger dollar means that the pounds, pesos and euros being earned abroad are now making a smaller top line contribution. Moreover, the higher valuations of mid- and small-cap stocks may reflect investors’ expectation of more protectionist trade policy under a Trump administration that could make smaller businesses more competitive domestically.
Crude oil continued to trade in a relatively narrow range. News on the discovery of the largest oil and gas deposit ever found in the US was offset at the end of the month by news of an OPEC agreement to cut production. Member countries agreed to cut 1.2 million barrels per day while non-member countries signed on to a reduction of 600,000 barrels/day. The incentives for OPEC members to cheat, however, remain high in a world awash with oil and exporters facing the prospect of losing market share:
WHAT MIGHT IT ALL MEAN?
The increase in rates and inflation expectations is directly in response to the policy changes that are expected to come out of a Trump administration. Investors seem to be treating the suddenly bright prospect of lower tax rates, less regulation and significant infrastructure spending as a catalyst that neither the Fed nor a politically divided capital have been able to generate during the last eight years. Having both the legislative and executive branches under Republican control paves the way to enact pro-growth fiscal policy.
Importantly, this comes just as the Fed is showing signs of gaining confidence to continue, and perhaps even accelerate, the process of normalizing monetary policy and to reduce its disproportionate influence in the global economy. Such a shift would put financial markets back on a path to where positive economic news is actually viewed as good news, rather than an easy money buzz kill.
As the Fed diminishes its role as the market’s backstop, and its analogous “put option” moves increasingly out of the money, markets will be less distorted by Fed activism and will more accurately reflect risks. As this happens, investors will be forced to rely less on the Fed to calm the markets and will have to take matters of risk management more into their own hands. In the face of severe and sustained market declines, investors will need to practice vigilance to protect against the devastating, wealthdestroying effects. For investors whose income is derived from their investments, ongoing, proactive volatility management and capital protection will become all the more important.
Creating transformational improvement in the retirement savings industry.
Milliman Financial Risk Management LLC is a global leader in financial risk management to the retirement savings industry. Milliman FRM provides investment advisory, hedging, and consulting services on over $166 billion in global assets (as of June 30, 2016).
Established in 1998, the practice includes professionals operating from three trading platforms around the world (Chicago, London, and Sydney).
Milliman is among the world's largest providers of actuarial and related products and services. The firm has consulting practices in healthcare, property & casualty insurance, life insurance and financial services, and employee benefits. Founded in 1947, Milliman is an independent firm with offices in major cities around the globe.
For further information:
MILLIMAN.COM/FRM
Recipients must make their own independent decisions regarding any strategies or securities or financial instruments mentioned herein.
The products or services described or referenced herein may not be suitable or appropriate for the recipient. Many of the products and services described or referenced herein involve significant risks, and the recipient should not make any decision or enter into any transaction unless the recipient has fully understood all such risks and has independently determined that such decisions or transactions are appropriate for the recipient.
Any discussion of risks contained herein with respect to any product or service should not be considered a disclosure of all risks or a complete discussion of the risks involved. The recipient should not construe any of the material contained herein as investment, hedging, trading, legal, regulatory, tax, accounting or other advice.
The recipient should not act on any information in this document without consulting its investment, hedging, trading, legal, regulatory, tax, accounting and other advisors. The materials in this document represent the opinion of the authors and are not representative of the views of Milliman, Inc. Milliman does not certify the information, nor does it guarantee the accuracy and completeness of such information. Use of such information is voluntary and should not be relied upon unless an independent review of its accuracy and completeness has been performed. Materials may not be reproduced without the express consent of Milliman.
MIL_COM_1 12/16_12/17 © 2016 Milliman Financial Risk Management LLC


