It’s checkers not chess.
At RBA, we strictly focus on macro fundamentals, and the data during 2016 seemed to be clearly suggesting investors were too defensively positioned. A focus on defensive income rather than on growth ultimately curtailed many investors’ 2016 performance.
There is an old saying that “It’s chess, not checkers”, which implies that things are more complicated than one might expect. However, right now we view the markets as being more checkers than chess. The stock and bond markets’ performances are currently based on a rather simple construct: when in the past has Washington, DC ever proposed significant fiscal stimulus when the economy was NOT in recession? Answer: never. Adding significant fiscal stimulus to a healthy, albeit not robust, economy is virtually unprecedented.
Many have ascribed the markets’ performances solely to a post-election surprise, but the performance trends seen after the election actually began in the first quarter of 2016. The markets have been forecasting an improving global economy for 10 months, and not simply for 10 weeks. The post-election acceleration in the stock market’s performance, however, strongly supports our point. Why wouldn’t the stock market like (and the bond market dislike) this unprecedented situation?
It’s checkers, not chess.
Focus on low quality and cyclicality
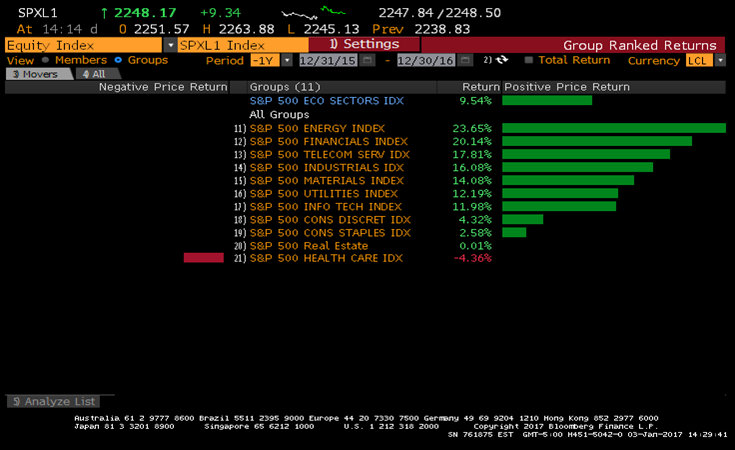
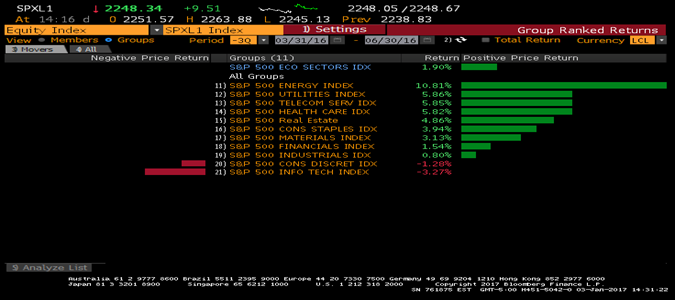
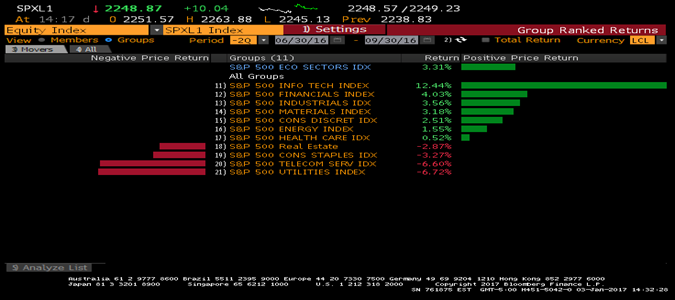
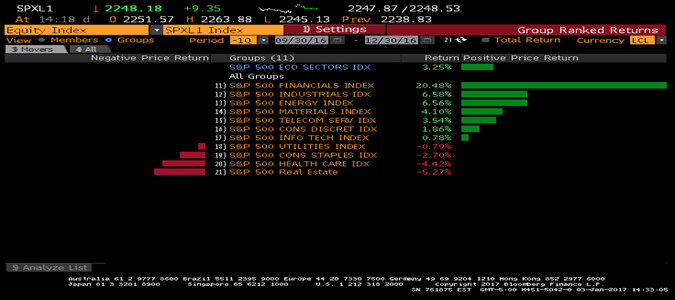
2016’s sector and size performance clearly suggested that corporate profits would improve more than investors expected. Chart 1 shows 2016 sector performance, and cyclical sectors dominated 2016’s returns. Four of the top five performing sectors during the year (Energy, Financials, Industrials, and Materials) are cyclical sectors. Charts 2-4 show second, third, and fourth quarter sector returns. The rotation toward cyclical shares began long before Election Day. Although Energy was the only cyclical sector to dominate performance during the second quarter, the cyclical leadership clearly broadened during the third quarter.
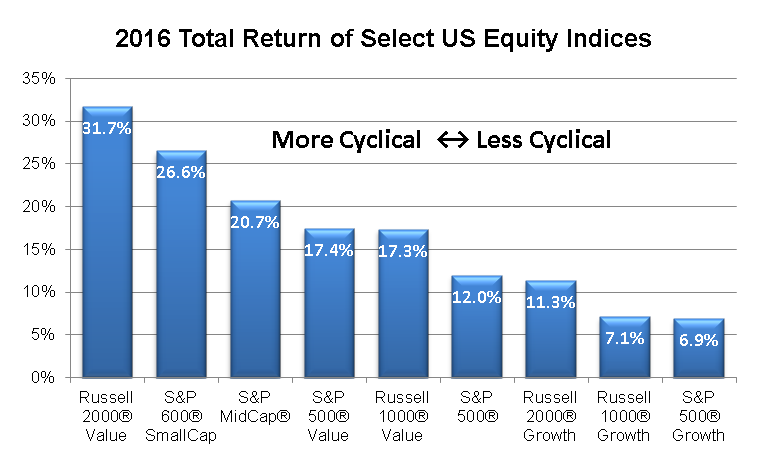
Similarly, Chart 5 shows 2016 total returns by style and size. More cyclical indices (i.e., small value) significantly outperformed more defensive ones (i.e., large growth).
CHART 1:
2016 S&P 500® Sector Performance

CHART 2:
2nd Qtr 2016 S&P 500® Sector Performance
CHART 3:
3rd Qtr 2016 S&P 500® Sector Performance
CHART 4:
4th Qtr 2016 S&P 500® Sector Performance
Source: Bloomberg Finance L.P.
CHART 5:
Source: Richard Bernstein Advisors LLC, Bloomberg Finance L.P.
“March 2000” for bonds
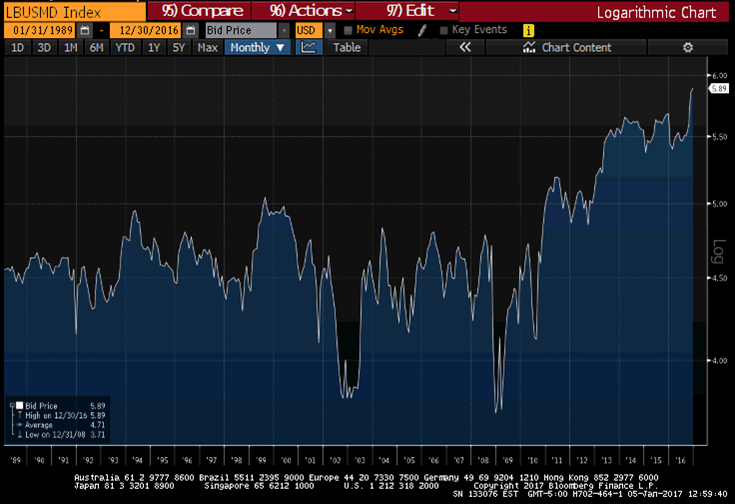
Investors are typically the most bullish regarding an asset class at the peak of that asset class’s performance. This past summer’s incredible enthusiasm for bonds was a perfect example. Chart 6 shows that the bond market was the riskiest (i.e., had the longest duration) in history last summer. We’ve called last summer the “March 2000” for the bond market because just as investors poured into technology shares when those stocks were at their riskiest point in March 2000, investors poured into bonds when the risk to bonds was at its all-time highest. In 2000 it was the “new economy”. This time it was the “new normal”.
CHART 6:
Bloomberg Barclays US Aggregate Bond Index:
Modified Adjusted Duration
Source: Bloomberg Finance L.P.
Anti-equity sentiment remains
We repeatedly argued in 2016 that the global financial markets have been suggesting that the period of global deflation was slowly, but surely ending. In the US, inflation expectations troughed in February 2016 (almost a year ago!), but yet consensus positioning remains largely anti-equity.
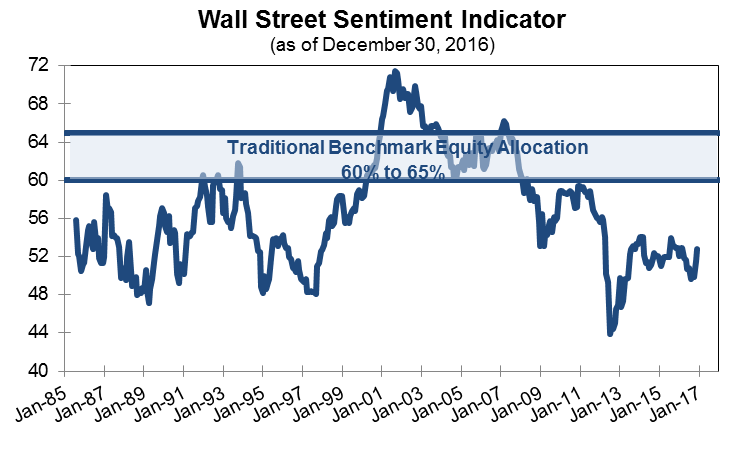
Chart 7 shows Wall Street’s consensus recommended allocation to equities. Certainly, there has been a near-term shift toward equities and investments that outperform during periods of rising nominal growth. However, Wall Street is still recommending an underweight of equities relative to the traditional 60-65% benchmark weight, and it is very hard to argue that cyclicality and inflation are the core themes imbedded into most portfolios.
CHART 7:
Source: Richard Bernstein Advisors LLC
It’s checkers, not chess
Observers always make the financial markets seem more complicated than they really are, and today is no different. The simple reality is significant fiscal stimulus is being discussed when the economy is already healthy. On paper, this would imply stronger stock markets, stronger commodity markets, and weaker bond markets.
All those performance characteristics are indeed happening. It’s not that complicated. It seems like checkers.
Special thanks to Henry Timmons for the catchy title to this commentary.
INDEX DESCRIPTIONS:
The following descriptions, while believed to be accurate, are in some cases abbreviated versions of more detailed or comprehensive definitions available from the sponsors or originators of the respective indices. Anyone interested in such further details is free to consult each such sponsor’s or originator’s website.
The past performance of an index is not a guarantee of future results.
Each index reflects an unmanaged universe of securities without any deduction for advisory fees or other expenses that would reduce actual returns, as well as the reinvestment of all income and dividends. An actual investment in the securities included in the index would require an investor to incur transaction costs, which would lower the performance results. Indices are not actively managed and investors cannot invest directly in the indices.
S&P 500®: Standard & Poor’s (S&P) 500® Index. The S&P 500® Index is an unmanaged, capitalization-weighted index designed to measure the performance of the broad US economy through changes in the aggregate market value of 500 stocks representing all major industries.
S&P 500® Value: Standard & Poor’s (S&P) 500® Value Index. The S&P 500 Value® Index is a market capitalization weighted index. All the stocks in the underlying parent index are allocated into value or growth. Stocks that do not have pure value or pure growth characteristics have their market caps distributed between the value & growth indices. Prior to 12/19/2005 this index represented the S&P 500/Barra Value® Index.
S&P 500® Growth: Standard & Poor’s (S&P) 500® Growth Index. The S&P 500 Growth® Index is a market capitalization weighted index. All the stocks in the underlying parent index are allocated into value or growth. Stocks that do not have pure value or pure growth characteristics have their market caps distributed between the value & growth indices. Prior to 12/19/2005 this index represented the S&P 500/Barra Growth® Index.
S&P SmallCap 600® : Standard & Poor’s (S&P) SmallCap 600® Index. The S&P SmallCap 600® measures the small-cap segment of the U.S. equity market reflecting the distinctive risk and return characteristics of this market segment.
S&P MidCap 400®: Standard & Poor’s (S&P) MidCap 400® Index. The S&P MidCap 400® measures the performance of mid-sized companies, reflecting the distinctive risk and return characteristics of this market segment.
Russell 1000®: Russell 1000® Index. The Russell 1000® Index is an unmanaged, market-capitalization-weighted index designed to measure the performance of the large-cap segment of the US equity universe. The Russell 1000® Index is a subset of the Russell 3000® Index.
Russell 1000 Value®: Russell 1000 Value® Index. The Russell 1000 Value® Index measures the performance of those Russell 1000® companies with lower price-to-book ratios and lower forecasted growth values. The index was developed with a base value of 200 as of August 31, 1992.
Russell 1000 Growth®: Russell 1000 Growth® Index. The Russell 1000 Growth® Index measures the performance of those Russell 1000® companies with higher price-to-book ratios and higher forecasted growth values. The index was developed with a base value of 200 as of August 31, 1992.
Russell 2000®: Russell 2000® Index. The Russell 2000® Index is an unmanaged, market-capitalization-weighted index designed to measure the performance of the small-cap segment of the US equity universe. The Russell 2000® Index is a subset of the Russell 3000® Index.
Russell 2000 Value®: Russell 2000 Value® Index. The Russell 2000 Value® Index measures the performance of those Russell 2000® companies with lower price-to-book ratios and lower forecasted growth values.
Russell 2000 Growth®: Russell 2000 Growth® Index. The Russell 2000 Growth® Index measures the performance of those Russell 2000® companies with higher price-to-book ratios and higher forecasted growth values.
Sector/Industries: Sector/industry references in this report are in accordance with the Global Industry Classification Standard (GICS®) developed by MSCI Barra and Standard & Poor’s. The GICS structure consists of 10 sectors, 24 industry groups, 68 industries and 154 sub-industries.
Bloomberg Barclays US Agg: Bloomberg Barclays US Aggregate Bond Index. The Bloomberg Barclays US Aggregate Bond Index is a broad-based flagship benchmark that measures the investment grade, US dollar-denominated, fixed-rate taxable bond market. The index includes Treasuries, government-related and corporate securities, MBS (agency fixed-rate and hybrid ARM pass-throughs), ABS and CMBS (agency and non-agency).
© Copyright 2017 Richard Bernstein Advisors LLC. All rights reserved.
PAST PERFORMANCE IS NO GUARANTEE OF FUTURE RESULTS
Nothing contained herein constitutes tax, legal, insurance or investment advice, or the recommendation of or an offer to sell, or the solicitation of an offer to buy or invest in any investment product, vehicle, service or instrument. Such an offer or solicitation may only be made by delivery to a prospective investor of formal offering materials, including subscription or account documents or forms, which include detailed discussions of the terms of the respective product, vehicle, service or instrument, including the principal risk factors that might impact such a purchase or investment, and which should be reviewed carefully by any such investor before making the decision to invest. Links to appearances and articles by Richard Bernstein, whether in the press, on television or otherwise, are provided for informational purposes only and in no way should be considered a recommendation of any particular investment product, vehicle, service or instrument or the rendering of investment advice, which must always be evaluated by a prospective investor in consultation with his or her own financial adviser and in light of his or her own circumstances, including the investor's investment horizon, appetite for risk, and ability to withstand a potential loss of some or all of an investment's value. Investing is subject to market risks. Investors acknowledge and accept the potential loss of some or all of an investment's value. Past performance is, of course, no guarantee of future results. Views represented are subject to change at the sole discretion of Richard Bernstein Advisors LLC. Richard Bernstein Advisors LLC does not undertake to advise you of any changes in the views expressed herein.
© Richard Bernstein Advisors
Read more commentaries by Richard Bernstein Advisors