February 11, 2016 Was More Important Than November 8
Questions whether the stock market could enter a correction or worse because of Washington, DC’s policy failures seem to totally miss the point that fundamentals were improving long before the presidential election. Certainly, the market’s appreciation accelerated after the election, but few investors seem aware of the improvement in fundamentals and market rotation that occurred more than a year ago. The important date in 2016 for investors was February 11, and not November 8. The stock market bottomed on February 11, and the sectors leading the stock market out of that trough were cyclical. Investment discussions focused solely on Washington, DC seem to ignore that important point. Whether the market enters a correction based on Washington, DC’s failures seems a moot question because virtually no one can consistently time corrections. However, we think the probability of a much more serious bear market is very low regardless of Washington because the underlying US and global fundamentals remain healthy.
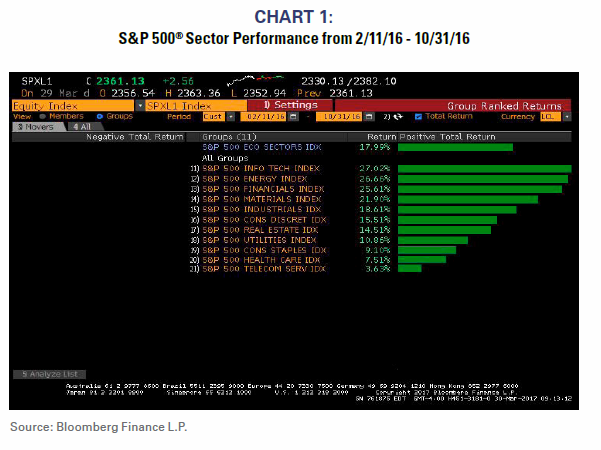
Sector leadership after February 11
Charts 1 and 2 demonstrate S&P 500R sector performance before and after the election. Certainly, cyclical performance was obvious after the election, but those sectors’ outperformance actually began nine months before the election. The election has been credited with the outperformance of Financials, but even that group significantly outperformed the market before the election.

Profits cycle once again dominates
February’s cyclical rotation seems attributable to the 4Q15 trough in the profits cycle. 2016 was the year of profits recovery, and history clearly shows that cyclicals tend to outperform during period of profits recoveries. 2016 fits the historical norm.
Chart 3 shows the S&P 500R profits cycle. The trough in the fourth quarter of 2015 and 2016’s profits recovery are clear. By our reckoning, roughly 20% earnings growth seems quite reasonable during 2017.

Stimulus cocktail doesn’t have to be strong
The US economy is normally in a recession when Washington starts mixing policy cocktails of tax cuts, fiscal spending, and deregulation. That is clearly not the case today. Of course, the economy could be stronger, but the fact is the US economy is actually quite healthy.
Because policy makers are starting with a healthy economy, a stimulus cocktail does not have to be very strong to get the economy booming. The risk at this point in the cycle could be that the cocktail is too strong and the economy actually overheats.
Expectations might currently be too optimistic regarding the potential strength of a stimulus cocktail, and short-term disappointment could occur. However, investors need to gauge any program to the health of the current economy. Expectations do not need to be set very high because even a small sip of a stimulus cocktail might produce a booming economy given the economy’s current health.
Bottom line: It’s the bottom line, not Washington that matters
It’s always important to remember that corporate fundamentals and not Washington, DC ultimately dictate the direction of the stock market. Expectations for Washington’s success might be too high, but the reality is that corporate fundamentals remain quite healthy.
That’s why the market troughed on February 11 and not on November 8.
For more information on RBA’s Pactive® strategies, please contact your local RBA Representative. (http://www.rbadvisors.com/images/pdfs/Portfolio_Specialist_Map.pdf).
INDEX DESCRIPTIONS:
The following descriptions, while believed to be accurate, are in some cases abbreviated versions of more detailed or comprehensive definitions available from the sponsors or originators of the respective indices. Anyone interested in such further details is free to consult each such sponsor’s or originator’s website.
The past performance of an index is not a guarantee of future results.
Each index reflects an unmanaged universe of securities without any deduction for advisory fees or other expenses that would reduce actual returns, as well as the reinvestment of all income and dividends. An actual investment in the securities included in the index would require an investor to incur transaction costs, which would lower the performance results. Indices are not actively managed and investors cannot invest directly in the indices.
S&P 500®: Standard & Poor’s (S&P) 500® Index. The S&P 500® Index is an unmanaged, capitalization-weighted index designed to measure the performance of the broad US economy through changes in the aggregate market value of 500 stocks representing all major industries.
ACWI®: MSCI All Country World Index (ACWI®): The MSCI ACWI® Index is a widely recognized, free-float-adjusted, market-capitalization-weighted index designed to measure the equity-market performance of developed markets.
ACWI® ex US: MSCI ACWI® excluding United States Index: The MSCI World Index ex-US index is a free-float-adjusted, market-capitalization-weighted index designed to measure the equity-market performance of developed markets excluding the United States.
Gold: Gold Spot USD/oz Bloomberg GOLDS Commodity. The Gold Spot price is quoted as US Dollars per Troy Ounce.
Hedge Fund Index: HFRI Fund Weighted Composite Index. The HFRI Fund Weighted Composite Index is a global, equal-weighted index of over 2,000 single-manager funds that report to the HFR (Hedge Fund Research) database. Constituent funds report monthly net-of-all-fees performance in USD and have a minimum of $50 million under management or a twelve (12)-month track record of active performance. The Index includes both domestic (US) and offshore funds, and does not include any funds of funds.
3-Mo T-Bills: BofA Merrill Lynch 3-Month US Treasury Bill Index. The BofA Merrill Lynch 3-Month US Treasury Bill Index is comprised of a single issue purchased at the beginning of the month and held for a full month. The Index is rebalanced monthly and the issue selected is the outstanding Treasury Bill that matures closest to, but not beyond, three months from the rebalancing date.
Long-term Treasury Index: BofA Merrill Lynch 15+ Year US Treasury Index. The BofA Merrill Lynch 15+ Year US Treasury Index is an unmanaged index comprised of US Treasury securities, other than inflation-protected securities and STRIPS, with at least $1 billion in outstanding face value and a remaining term to final maturity of at least 15 years.
About Richard Bernstein Advisors
Richard Bernstein Advisors LLC is an independent investment adviser. RBA partners with several firms including Eaton Vance Corporation and First Trust Portfolios LP, and currently has $3.8 billion collectively under management and advisement as of January 31st 2016. RBA acts as sub‐advisor for the Eaton Vance Richard Bernstein Equity Strategy Fund and the Eaton Vance Richard Bernstein All‐Asset Strategy Fund and also offers income and unique theme‐oriented unit trusts through First Trust. RBA is also the index provider for the First Trust RBA American Industrial Renaissance ETF and the First Trust RBA Quality Income ETF. Additionally, RBA runs ETF asset allocation SMA portfolios at UBS, Merrill Lynch, Morgan Stanley Smith Barney, Wells Fargo and on select RIA platforms. RBA’s investment insights as well as further information about the firm and products can be found at www.RBAdvisors.com.
© Copyright 2017 Richard Bernstein Advisors LLC. All rights reserved.
PAST PERFORMANCE IS NO GUARANTEE OF FUTURE RESULTS
Nothing contained herein constitutes tax, legal, insurance or investment advice, or the recommendation of or an offer to sell, or the solicitation of an offer to buy or invest in any investment product, vehicle, service or instrument. Such an offer or solicitation may only be made by delivery to a prospective investor of formal offering materials, including subscription or account documents or forms, which include detailed discussions of the terms of the respective product, vehicle, service or instrument, including the principal risk factors that might impact such a purchase or investment, and which should be reviewed carefully by any such investor before making the decision to invest. Links to appearances and articles by Richard Bernstein, whether in the press, on television or otherwise, are provided for informational purposes only and in no way should be considered a recommendation of any particular investment product, vehicle, service or instrument or the rendering of investment advice, which must always be evaluated by a prospective investor in consultation with his or her own financial adviser and in light of his or her own circumstances, including the investor’s investment horizon, appetite for risk, and ability to withstand a potential loss of some or all of an investment’s value. Investing is subject to market risks. Investors acknowledge and accept the potential loss of some or all of an investment’s value. Past performance is, of course, no guarantee of future results. Views represented are subject to change at the sole discretion of Richard Bernstein Advisors LLC. Richard Bernstein Advisors LLC does not undertake to advise you of any changes in the views expressed herein.


