Fundamentals, Fundamentals, Fundamentals
We’ve said many times politicians crave the spotlight, but it’s a shame that investors watch the show. History shows quite well that fundamentals, and not politics, ultimately drive the financial markets. Our November 2014 report, titled “Are you tired of being scared yet?” (http://www.rbadvisors.com/images/pdfs/tired_of_being_scared. pdf) emphasized that investors were overly concerned about a broad range of issues. We listed nearly 70 risks that at the time led investors to generally conclude that the stock market was an imprudent investment. That was more than two years ago, but such fears have hardly subsided.
An old adage on Wall Street is that one should never take investment advice from Washington, DC. The on-going 9-year (!) bull market proves this seems like sound advice. Investors have been hesitant to invest in this bull market partially because of the warnings of imminent gloom and doom from Washington’s right and left.
Politics vs. Fundamentals
It’s probably fair to say that politics are overwhelming investing fundamentals because it has become difficult to tell the difference between the financial media and traditional news media. Geopolitics, domestic politics, public policy and the like seem to have totally supplanted earnings and sales as investment discussion topics.
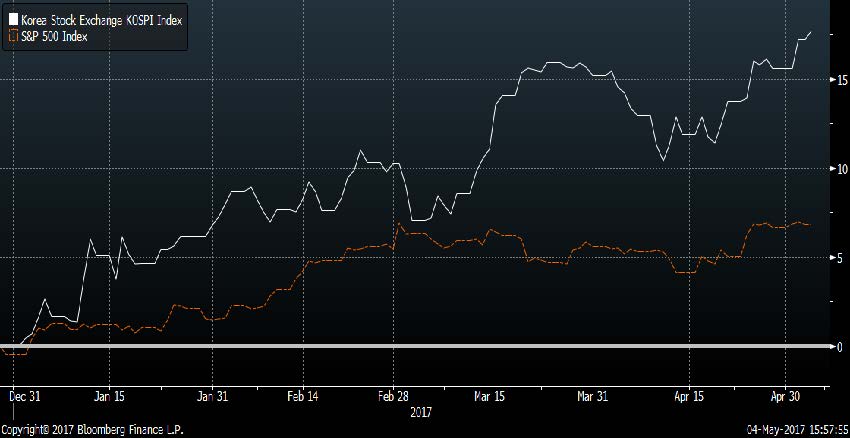
For example, few investors realize that the South Korean stock market is up 18% YTD (through 5/4/17 in USD) because they are so apprehensive about the geopolitical news regarding a potential North Korea nuclear threat. We’ve attempted to capitalize on that misjudgment, and have overweighted Korean stocks in many of our portfolios for months, but the typical investor has probably shunned the region’s stocks.
CHART 1:
Washington focusing on North Korea. Investors focusing on South Korea.

Source: Bloomberg Finance L.P.
Profits growth looks very healthy with or without tax reform.
Investors have somewhat lost touch with overall corporate fundamentals because they are myopically watching politics. RBA’s research has indicated for more than a year that the trough in the US profits cycle was 4Q15, that 2016 was the year of profits recovery, and that 2017 would be the year of the profits expansion. It is likely that S&P 500® reported profits growth will exceed 20% at some point this year. (See Chart 2)
Some investors are incredulous that our optimistic earnings forecasts include no assumptions for corporate tax reform. They cannot believe that profit fundamentals are currently as strong as they are because they’ve been distracted by Washington.
CHART 2:
S&P 500® Reported Y/Y Trailing GAAP EPS Growth from December 1980 – December 2016
Source: Richard Bernstein Advisors LLC, Standard & Poor’s.
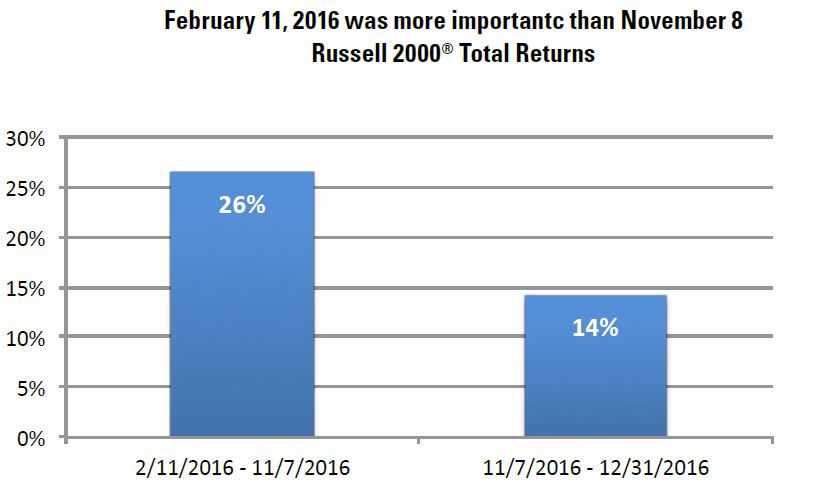
Similarly, many investors have attributed 2016’s stock market performance to the election. However, as Chart 3 shows, nearly 2/3rd of the Russell 2000’s 2016 performance came before Election Day! The Russell 2000 might have appreciated after Election Day because of the election, but 2/3rd of the yearly performance was attributable to improving fundamentals.
CHART 3:
February 11, 2016 was more importantc than November 8 Russell 2000® Total Returns
Source: Richard Bernstein Advisors LLC, Bloomberg Finance L.P.
Top-Down, but not event-driven
Although RBA is a strictly top-down, macro firm, we are not event- driven as are most macro investors. We follow a disciplined approach to macro fundamentals. In the past year, this approach has served us well during events like Brexit, the US Presidential election, North Korea, Iran, Syria, the French election, and a litany of other events that in the end have had little effect on the equity bull market.
Politicians are always looking for a good photo opportunity like kissing babies. Unfortunately, kissing babies doesn’t typically lead to good portfolio performance. Fundamentally-based disciplined approaches tend to be much more successful.
INDEX DESCRIPTIONS:
The following descriptions, while believed to be accurate, are in some cases abbreviated versions of more detailed or comprehensive definitions available from the sponsors or originators of the respective indices. Anyone interested in such further details is free to consult each such sponsor’s or originator’s website.
The past performance of an index is not a guarantee of future results.
Each index reflects an unmanaged universe of securities without any deduction for advisory fees or other expenses that would reduce actual returns, as well as the reinvestment of all income and dividends. An actual investment in the securities included in the index would require an investor to incur transaction costs, which would lower the performance results. Indices are not actively managed and investors cannot invest directly in the indices.
S&P 500®: Standard & Poor’s (S&P) 500® Index.
The S&P 500® Index is an unmanaged, capitalization-weighted index designed to measure the performance of the broad US economy through changes in the aggregate market value of 500 stocks representing all major industries.
ACWI®: MSCI All Country World Index (ACWI®):
The MSCI ACWI® Index is a widely recognized, free-float- adjusted, market-capitalization-weighted index designed to measure the equity-market performance of developed markets.
ACWI® ex US: MSCI ACWI® exluding United States Index :
The MSCI World Index ex-US index is a free-float-adjusted, market- capitalization-weighted index designed to measure the equity-market performance of developed markets excluding the United States..
Gold: Gold Spot USD/oz Bloomberg GOLDS Commodity.
The Gold Spot price is quoted as US Dollars per Troy Ounce.
Hedge Fund Index: HFRI Fund Weighted Composite Index. The HFRI Fund Weighted Composite Index is a global, equal- weighted index of over 2,000 single-manager funds that report to the HFR (Hedge Fund Research) database. Constituent funds report monthly net-of-all-fees performance in USD and have a minimum of $50 million under management or a twelve (12)-month track record of active performance. The Index includes both domestic (US) and offshore funds, and does not include any funds of funds.
3-Mo T-Bills: BofA Merrill Lynch 3-Month US Treasury Bill Index. The BofA Merrill Lynch 3-Month US Treasury Bill Index is comprised of a single issue purchased at the beginning of the month and held for a full month. The Index is rebalanced monthly and the issue selected is the outstanding Treasury Bill that matures closest to, but not beyond, three months from the rebalancing date.
Long-term Treasury Index: BofA Merrill Lynch 15+ Year US Treasury Index. The BofA Merrill Lynch 15+ Year US Treasury Index is an unmanaged index comprised of US Treasury securities, other than inflation-protected securities and STRIPS, with at least $1 billion in outstanding face value and a remaining term to final maturity of at least 15 years.
© Copyright 2017 Richard Bernstein Advisors LLC. All rights reserved. PAST PERFORMANCE IS NO GUARANTEE OF FUTURE RESULTS
Nothing contained herein constitutes tax, legal, insurance or investment advice, or the recommendation of or an offer to sell, or the solicitation of an offer to buy or invest in any investment product, vehicle, service or instrument. Such an offer or solicitation may only be made by delivery to a prospective investor of formal offering materials, including subscription or account documents or forms, which include detailed discussions of the terms of the respective product, vehicle, service or instrument, including the principal risk factors that might impact such a purchase or investment, and which should be reviewed carefully by any such investor before making the decision to invest. Links to appearances and articles by Richard Bernstein, whether in the press, on television or otherwise, are provided for informational purposes only and in no way should be considered a recommendation of any particular investment product, vehicle, service or instrument or the rendering of investment advice, which must always be evaluated by a prospective investor in consultation with his or her own financial adviser and in light of his or her own circumstances, including the investor’s investment horizon, appetite for risk, and ability to withstand a potential loss of some or all of an investment’s value. Investing is subject to market risks. Investors acknowledge and accept the potential loss of some or all of an investment’s value. Past performance is, of course, no guarantee of future results. Views represented are subject to change at the sole discretion of Richard Bernstein Advisors LLC. Richard Bernstein Advisors LLC does not undertake to advise you of any changes in the views expressed herein.
© Richard Bernstein Advisors
Read more commentaries by Richard Bernstein Advisors