Active vs. Passive
Membership required
Membership is now required to use this feature. To learn more:
View Membership BenefitsEvery investor seems well aware of the on-going debate of active versus passive investment management. ETF and index fund firms have strongly suggested that investors should view active managers as a group as both imprudent and expensive. Active managers are pushing back by suggesting that the trend toward passive investments is speculatively skewing the market.
Most of RBA’s investment portfolios mix active and passive investing (i.e., PactiveR investing), so accordingly we think both active and passive investments have something to offer investors. However, the current debate seems to ignore some important questions:
➜ Why have so many active managers underperformed? Is all active management bad?
➜ How does one know which passive portfolio (or even active portfolio) to buy and when?
Why have so many active managers underperformed?
Is all active management bad?
Past research (including our own) highlights that active management typically underperforms when market leadership narrows (i.e., fewer stocks outperform the benchmark). A few potential reasons help to explain this phenomenon:
1. Narrow markets conflict with fiduciary responsibility – narrow markets imply a tighter concentration of stocks outperforms the overall market index. If managers of broad portfolios similarly concentrated portfolios, they could be chided for not following prudent diversification principles. For example, managers who focused portfolios on the narrow technology leadership during the technology bubble were subsequently considered foolish once the bubble deflated.
2. Broader markets aid those without skill – if one assumes that active managers have no skill whatsoever, then the simple probability of picking an outperforming stock goes up as markets broaden. If 60% of a benchmark’s constituent stocks outperformed the benchmark, a naïve manager would have a 60% probability of picking an outperforming stock. The probability of outperforming under that scenario would be higher than if only 40% of the benchmark outperformed. Because all managers’ skills cannot be above average, broader markets should improve active management performance.
However, actual performance history shows that these are not the only influences. There are cases during which active managers underperform during broader markets (i.e., as they did during 2016). We think there is another explanation.
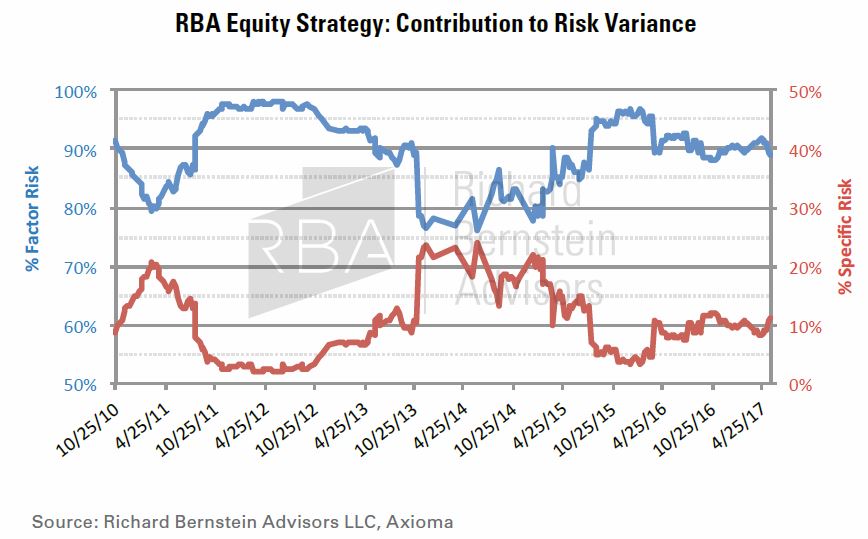
RBA is a top-down, macro investment manager, and we go to great lengths to demonstrate our commitment to macro investing. Chart 1 highlights the decomposition of risk within the holdings of the RBA Equity Strategy. The majority of a macro firm’s investment risk should come from macro factors and not from stock selection, and that is exactly reflected in the risk decomposition of this portfolio. About 90% of the risk that we take in this portfolio is macro factor risk, whereas only about 10% is attributable to stock selection. A high-concentration stock picking strategy would likely be the exact opposite, i.e., 90% of the risk would be stock selection risk and there would be very little macro risk.
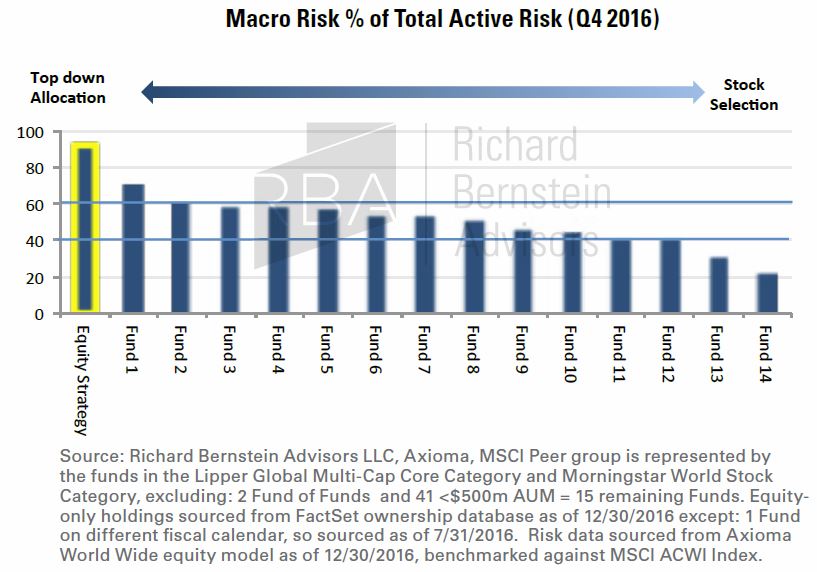
Chart 2 compares the risk decomposition of the RBA Equity Strategy to peers’ portfolios. We sort the portfolios by the proportion of total risk that is macro-based. RBA is the most macro-oriented of the managers in the study, but it is interesting that the majority of the managers fall between 40-60%, although their total risk might be substantial (although we are skeptical), most managers appear unwilling to take substantial stock selection risk despite common claims regarding superior stock selection. We limit our stock selection risk on purpose because RBA is a macro firm. However, it appears as though stock picking managers are generally unwilling to take similarly substantial proportions of stock selection risk.
A basic tenet of investing is that risk is rewarded with higher returns. So, active managers are unlikely to outperform if they are unwilling to take substantial macro risk and are simultaneously unwilling to take substantial stock selection risk. Investors simply should not expect long-term outperformance
Source: Richard Bernstein Advisors, Axioma Inc.
How does one know which passive investments to buy and when?
Although passive investments do tend to outperform the corresponding mediocre active management through time, that discussion totally omits the more important question of which passive investment to buy and when to buy it. That may be a much more important question.
Advocates of pure passive investing tend to ignore this question and believe that investors should hold passive investments for the “long term”. This sounds prudent on the surface, but it is actually quite unrealistic.
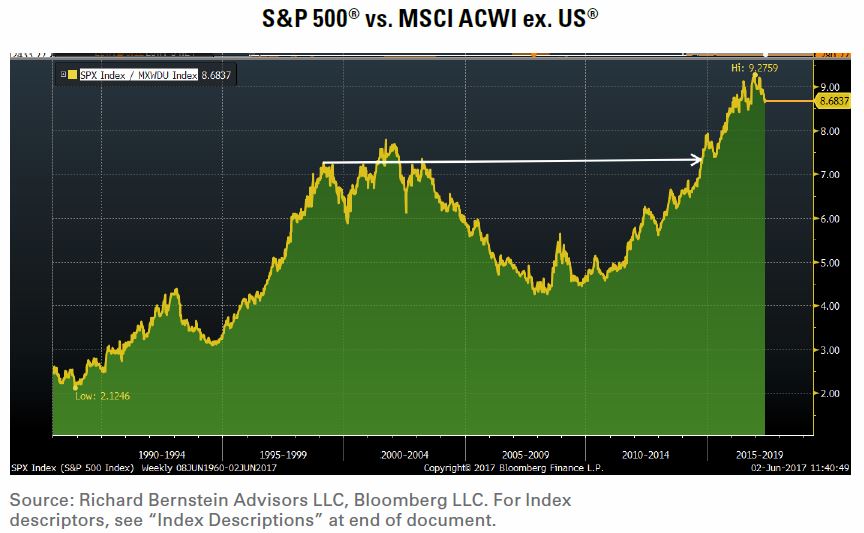
During the late-1990s many pundits were claiming that investors should simply invest in S&P 500® index funds for the “long term”. However, as Chart 3 points out, that might have not been such a good suggestion. The chart shows the relative price between the S&P 500® and the MSCI ACWI ex. US® indices. The S&P 500® was outperforming the MSCI ACWI ex US® during periods in which the line rises and vice versa. The S&P 500® did outperform non-US stocks for several years after the late-1990s, but ultimately the S&P 500® didn’t catch up to non-US stocks for more than 15 years! A choice to invest in an S&P 500® index fund, which was widely recommended at the time, turned out to be a substantially inferior investment.
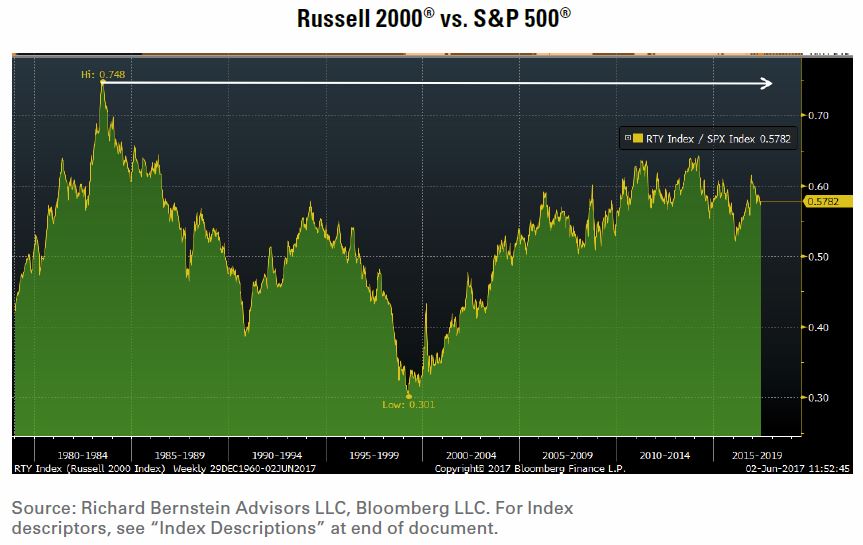
Similarly, Chart 4 shows the relative price between the Russell 2000® and the S&P 500®. If one had bought a small stock index fund at the relative price peak in the early 1980s when small stocks were at their peak popularity, that index fund’s relative price still would not be equal to the S&P 500® today after 33 years. In fact, the S&P 500®’s cumulative return since the Russell 2000®’s early-1980s relative price peak has more than doubled that of the Russell 2000®!
Holding for the long-term can sound prudent, but timing remains critical. The current argument about passive versus active totally misses that point. Which passive investment (or for that matter, active investment) to buy and when to buy it remains the most important consideration.
Chart 5 shows the 20-year performance of the “average investor” as computed by Dalbar. We compare their data to the returns for a broad range of asset and sub-asset class returns. It is painfully obvious that investors are very poor at timing investments regardless of whether they are active or passive.
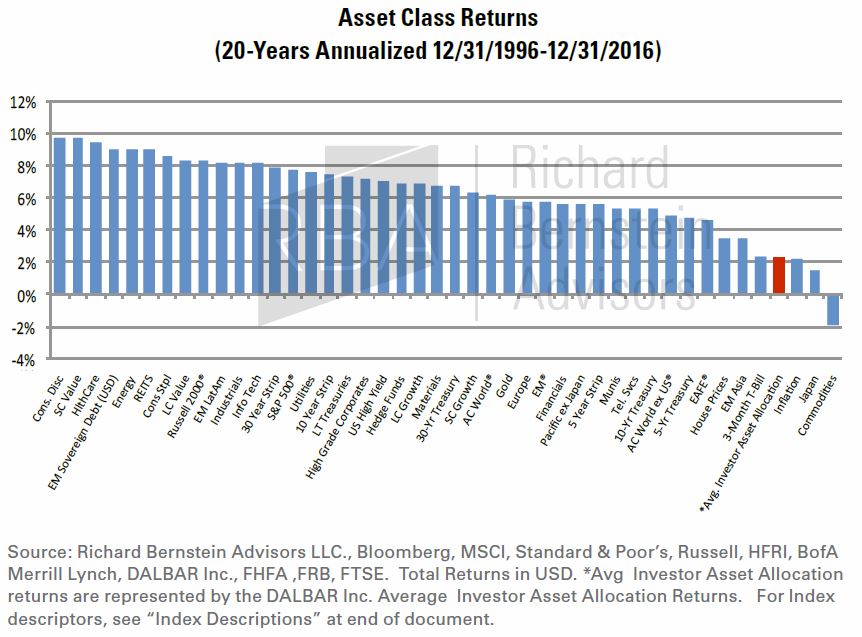
RBA’s Pactive® portfolios focus on the active use of passive investments. The Dalbar history seems to suggest to us that incorporating a Pactive® manager into a portfolio could potentially improve performance.
INDEX DESCRIPTIONS:
The following descriptions, while believed to be accurate, are in some cases abbreviated versions of more detailed or comprehensive definitions available from the sponsors or originators of the respective indices. Anyone interested in such further details is free to consult each such sponsor’s or originator’s website.
The past performance of an index is not a guarantee of future results.
Each index reflects an unmanaged universe of securities without any deduction for advisory fees or other expenses that would reduce actual returns, as well as the reinvestment of all income and dividends. An actual investment in the securities included in the index would require an investor to incur transaction costs, which would lower the performance results. Indices are not actively managed and investors cannot invest directly in the indices.
MSCI All Country World Index (ACWI®): The MSCI ACWI® Index is a widely recognized, free-float-adjusted, market-capitalization-weighted index designed to measure the equity-market performance of global developed and emerging markets.
MSCI All Country World Index (ACWI®) ex US : The MSCI ACWI® ex US Index is a free-float-adjusted, market-capitalization-weighted index designed to measure the equity-market performance of global developed and emerging markets excluding the US.
S&P 500®: Standard & Poor’s (S&P) 500® Index. The S&P 500® Index is an unmanaged, capitalization-weighted index designed to measure the performance of the broad US economy through changes in the aggregate market value of 500 stocks representing all major industries.
U.S. Small Caps: Russell 2000 Index. The Russell 2000 Index is an unmanaged, capitalization-weighted index designed to measure the performance of the small-cap segment of the US equity universe. The Russell 2000 Index is a subset of the Russell 3000® Index.
Russell 2000 Index. The Russell 2000 Index is an unmanaged, capitalization-weighted index designed to measure the performance of the small-cap segment of the US equity universe. The Russell 2000 Index is a subset of the Russell 3000® Index.
EM Equity: MSCI Emerging Markets (EM) Index. The MSCI EM Index is a free-float-adjusted, market-capitalization-weighted index designed to measure the equity-market performance of emerging markets.
EM Asia: MSCI Emerging Markets Asia Index. The MSCI EM Asia Index is a free-float-adjusted, market-capitalization-weighted index designed to measure the equity-market performance of emerging markets in Asia.
Latam: MSCI EM (Emerging Markets) Latin America Index. The MSCI EM Latin America Index s a free float-adjusted market capitalization weighted index that is designed to measure the equity market performance of emerging markets in Latin America. The MSCI EM Latin America Index consists of the following 5 emerging market country indices: Brazil, Chile, Colombia, Mexico, and Peru.
Japan: MSCI Japan Index. The MSCI Japan Index is a free-float-adjusted, market-capitalization-weighted index designed to measure the equity-market performance of Japan.
EAFE®: MSCI Europe, Australasia, Far East (EAFE®) The MSCI EAFER Index is a free-float-adjusted, market-capitalization-weighted index designed to measure the equity-market performance of developed markets excluding the US & Canada.
Pacific ex Japan: The MSCI Pacific ex Japan Index is a free-float-adjusted, market-capitalization-weighted index designed to measure the equity-market performance of Australia, New Zealand, Hong Kong and Singapore markets.
Europe: MSCI Europe Index. The MSCI Europe index is a free float-adjusted market capitalization weighted index that is designed to measure the equity market performance of the developed markets in Europe. The MSCI Europe Index consists of the following 16 developed market country indices: Austria, Belgium, Denmark, Finland, France, Germany, Greece, Ireland, Italy, the Netherlands, Norway, Portugal, Spain, Sweden, Switzerland, and the United Kingdom.
Large Cap Growth: The Russell 1000 Growth Index. The Russell 1000 Growth Index measures the performance of the large-cap growth segment of the U.S. equity universe. It includes those Russell 1000 Index companies with higher price-to-book ratios and higher forecasted growth values. The Russell 1000 Growth Index is constructed to provide a comprehensive and unbiased barometer for the large-cap growth segment. The Index is completely reconstituted annually to ensure new and growing equities are included and that the represented companies continue to reflect growth characteristics.
Large Cap Value: The Russell 1000 Value Index. The Russell 1000 Value Index measures the performance of the large-cap value segment of the U.S. equity universe. It includes those Russell 1000 Index companies with lower price-to-book ratios and lower expected growth values. The Russell 1000 Value Index is constructed to provide a comprehensive and unbiased barometer for the largecap value segment. The Index is completely reconstituted annually to ensure new and growing equities are included and that the represented companies continue to reflect value characteristics
Small Cap Growth: The Russell 2000 Growth Index. The Russell 2000 Growth Index measures the performance of the small-cap growth segment of the U.S. equity universe. It includes those Russell 2000 Index companies with higher price-to-book ratios and higher forecasted growth values. The Russell 2000 Growth Index is constructed to provide a comprehensive and unbiased barometer for the small-cap growth segment. The Index is completely reconstituted annually to ensure new and growing equities are included and that the represented companies continue to reflect growth characteristics.
Small Cap Value: The Russell 2000 Value Index. The Russell 2000 Value Index measures the performance of the small-cap value segment of the U.S. equity universe. It includes those Russell 2000 Index companies with lower price-to-book ratios and lower expected growth values. The Russell 2000 Value Index is constructed to provide a comprehensive and unbiased barometer for the small-cap value segment. The Index is completely reconstituted annually to ensure new and growing equities are included and that the represented companies continue to reflect value characteristics .
Sector/Industries: Sector/industry references in this report are in accordance with the Global Industry Classification Standard (GICSR) developed by MSCI Barra and Standard & Poor’s. The GICS structure consists of 10 sectors, 24 industry groups, 68 industries and 154 sub-industries.
Gold: Gold Spot USD/oz Bloomberg GOLDS Commodity. The Gold Spot price is quoted as US Dollars per Troy Ounce.
Commodities: S&P GSCI® Index. The S&P GSCIR seeks to provide investors with a reliable and publicly available benchmark for investment performance in the commodity markets, and is designed to be a “tradable” index. The index is calculated primarily on a world production-weighted basis and is comprised of the principal physical commodities that are the subject of active, liquid futures markets.
Hedge Fund Index: HFRI Fund Weighted Composite Index. The HFRI Fund Weighted Composite Index is a global, equal-weighted index of over 2,000 single-manager funds that report to the HFR (Hedge Fund Research) database. Constituent funds report monthly net-of-all-fees performance in USD and have a minimum of $50 million under management or a twelve (12)-month track record of active performance. The Index includes both domestic (US) and offshore funds, and does not include any funds of funds.
REITS: THE FTSE NAREIT Composite Index. The FTSE NAREIT Composite Index is a free-float-adjusted, market-capitalization-weighted index that includes all tax qualified REITs listed in the NYSE, AMEX, and NASDAQ National Market.
3-Mo T-Bills: BofA Merrill Lynch 3-Month US Treasury Bill Index. The BofA Merrill Lynch 3-Month US Treasury Bill Index is comprised of a single issue purchased at the beginning of the month and held for a full month. The Index is rebalanced monthly and the issue selected is the outstanding Treasury Bill that matures closest to, but not beyond, three months from the rebalancing date.
Long-term Treasury Index: BofA Merrill Lynch 15+ Year US Treasury Index. The BofA Merrill Lynch 15+ Year US Treasury Index is an unmanaged index comprised of US Treasury securities, other than inflation-protected securities and STRIPS, with at least $1 billion in outstanding face value and a remaining term to final maturity of at least 15 years.
Municipals: BofA Merrill Lynch US Municipal Securities Index. The BofA Merrill Lynch US Municipal Securities Index tracks the performance of USD-denominated, investment-grade rated, tax-exempt debt publicly issued by US states and territories (and their political subdivisions) in the US domestic market. Qualifying securities must have at least one year remaining term to final maturity, a fixed coupon schedule, and an investment-grade rating (based on an average of Moody’s, S&P and Fitch). Minimum size requirements vary based on the initial term to final maturity at the time of issuance.
High Grade Corporates: BofA Merrill Lynch 15+ Year AAA-AA US Corporate Index. The BofA Merrill Lynch 15+ Year AAA-AA US Corporate Index is a subset of the BofA Merrill Lynch US Corporate Index (an unmanaged index comprised of USD-denominated, investment-grade, fixed-rate corporate debt securities publicly issued in the US domestic market with at least one year remaining term to final maturity and at least $250 million outstanding) including all securities with a remaining term to final maturity of at least15 years and rated AAA through AA3, inclusive.
U.S. High Yield: BofA Merrill Lynch US Cash Pay High Yield Index. The BofA Merrill Lynch US Cash Pay High Yield Index tracks the performance of USD-denominated, below-investmentgrade- rated corporate debt, currently in a coupon-paying period, that is publicly issued in the US domestic market. Qualifying securities must have a below-investment-grade rating (based on an average of Moody’s, S&P and Fitch) and an investment-grade-rated country of risk (based on an average of Moody’s, S&P and Fitch foreign currency long-term sovereign debt ratings), at least one year remaining term to final maturity, a fixed coupon schedule, and a minimum amount outstanding of $100 million. STRIP has a zero coupon, a purchase yield equal to the yield of the corresponding point on the coupon STRIP curve, and a purchase price which is derived from the purchase yield.
5-Year Treasury: The BofA Merrill Lynch 5-Year US Treasury Index. The BofA Merrill Lynch 5-Year US Treasury Index is a one-security index comprised of the most recently issued 5-year US Treasury note. The index is rebalanced monthly. In order to qualify for inclusion, a 5-year note must be auctioned on or before the third business day before the last business day of the month.
5-Year Strip: The BofA Merrill Lynch US 5-Year Constant Maturity STRIP Index (S010) The BofA Merrill Lynch US 10 Year Constant Maturity STRIP Index tracks the performance of a single synthetic US Treasury STRIP purchased at the beginning of the month, held for one month, and then sold at the end of the month with the proceeds rolled into a new instrument. Therefore, on the purchase date, the bond has a maturity exactly equal to the stated maturity of the index, and at the point it is sold it is one month short of the index stated maturity. The synthetic STRIP has a zero coupon, a purchase yield equal to the yield of the corresponding point on the coupon STRIP curve, and a purchase price which is derived from the purchase yield.
10-Year Treasury: The BofA Merrill Lynch 10-Year US Treasury Index. The BofA Merrill Lynch 10-Year US Treasury Index is a one-security index comprised of the most recently issued 10-year US Treasury note. The index is rebalanced monthly. In order to qualify for inclusion, a 10-year note must be auctioned on or before the third business day before the last business day of the month.
10-Year Strip: The BofA Merrill Lynch US 30-Year Constant Maturity STRIP Index (S010) The BofA Merrill Lynch US 10 Year Constant Maturity STRIP Index tracks the performance of a single synthetic US Treasury STRIP purchased at the beginning of the month, held for one month, and then sold at the end of the month with the proceeds rolled into a new instrument. Therefore, on the purchase date, the bond has a maturity exactly equal to the stated maturity of the index, and at the point it is sold it is one month short of the index stated maturity. The synthetic STRIP has a zero coupon, a purchase yield equal to the yield of the corresponding point on the coupon STRIP curve, and a purchase price which is derived from the purchase yield.
30-Year Treasury: The BofA Merrill Lynch Current 30- Year US Treasury Index. The BofA Merrill Lynch Current 30-Year US Treasury Index is a one-security index comprised of the most recently issued 30-year US Treasury bond. The index is rebalanced monthly. In order to qualify for inclusion, a 30-year bond must be auctioned on or before the third business day before the last business day of the month.
30-Year Strip: The BofA Merrill Lynch US 30 Year Constant Maturity STRIP Index (S030) The BofA Merrill Lynch US 30 Year Constant Maturity STRIP Index tracks the performance of a single synthetic US Treasury STRIP purchased at the beginning of the month, held for one month, and then sold at the end of the month with the proceeds rolled into a new instrument. Therefore, on the purchase date, the bond has a maturity exactly equal to the stated maturity of the index, and at the point it is sold it is one month short of the index stated maturity. The synthetic STRIP has a zero coupon, a purchase yield equal to the yield of the corresponding point on the coupon STRIP curve, and a purchase price which is derived from the purchase yield.
EM Sovereign: The BofA Merrill Lynch US Dollar Emerging Markets Sovereign Plus Index. The BofA Merrill Lynch US Dollar Emerging Markets Sovereign Plus Index tracks the performance of US dollar denominated emerging market and cross-over sovereign debt publicly issued in the Eurobond or US domestic market. Qualifying countries must have a BBB1 or lower foreign currency long-term sovereign debt rating (based on an average of Moody’s, S&P and Fitch). Countries that are not rated, or that are rated “D” or “SD” by one or several rating agencies qualify for inclusion in the index but individual nonperforming securities are removed. Qualifying securities must have at least one year remaining term to final maturity, a fixed or floating coupon and a minimum amount outstanding of $250 million. Local currency debt is excluded from the Index.
House Prices: The FHFA HPI. The HPI is a broad measure of the movement of single-family house prices. The HPI is a weighted, repeat-sales index, meaning that it measures average price changes in repeat sales or refinancings on the same properties. This information is obtained by reviewing repeat mortgage transactions on single-family properties whose mortgages have been purchased or securitized by Fannie Mae or Freddie Mac since January 1975.
Inflation: The Consumer Price Index (CPI) . The CPI is a measure of the average change in prices over time of goods and services purchased by households. The CPI is based on prices of food, clothing, shelter, and fuels, transportation fares, charges for doctors’ and dentists’ services, drugs, and other goods and services that people buy for day-to-day living. Source: Bureau of Labor Statistics.
Avg. Asset Allocation Investor Returns: Returns are for the period ending December 31, 2016. The DALBAR Inc. Average Asset Allocation Investor performance results are calculated using data supplied by the Investment Company Institute. Investor returns are represented by the change in total mutual fund assets after excluding sales, redemptions and exchanges. This method of calculation captures realized and unrealized capital gains, dividends, interest, trading costs, sales charges, fees, expenses and any other costs. After calculating investor returns in dollar terms, two percentages are calculated for the period examined: Total investor return rate and annualized investor return rate. Total return rate is determined by calculating the investor return dollars as a percentage of the net of the sales, redemptions and exchanges for each period.
© Richard Bernstein Advisors LLC All rights reserved.
PAST PERFORMANCE IS NO GUARANTEE OF FUTURE RESULTS
Nothing contained herein constitutes tax, legal, insurance or investment advice, or the recommendation of or an offer to sell, or the solicitation of an offer to buy or invest in any investment product, vehicle, service or instrument. Such an offer or solicitation may only be made by delivery to a prospective investor of formal offering materials, including subscription or account documents or forms, which include detailed discussions of the terms of the respective product, vehicle, service or instrument, including the principal risk factors that might impact such a purchase or investment, and which should be reviewed carefully by any such investor before making the decision to invest. Links to appearances and articles by Richard Bernstein, whether in the press, on television or otherwise, are provided for informational purposes only and in no way should be considered a recommendation of any particular investment product, vehicle, service or instrument or the rendering of investment advice, which must always be evaluated by a prospective investor in consultation with his or her own financial adviser and in light of his or her own circumstances, including the investor’s investment horizon, appetite for risk, and ability to withstand a potential loss of some or all of an investment’s value. Investing is subject to market risks. Investors acknowledge and accept the potential loss of some or all of an investment’s value. Past performance is, of course, no guarantee of future results. Views represented are subject to change at the sole discretion of Richard Bernstein Advisors LLC. Richard Bernstein Advisors LLC does not undertake to advise you of any changes in the views expressed herein.
Membership required
Membership is now required to use this feature. To learn more:
View Membership BenefitsSponsored Content
Upcoming Virtual Events View All


