Short-Term Volatility vs. Full-Blown Bear Market
Membership required
Membership is now required to use this feature. To learn more:
View Membership BenefitsThe 2008 bear market and recession appears to have permanently damaged investors’ psychology. Despite the ongoing bull market, investors generally remain quite scared of traditional long-only equity risk. Although some surveys are beginning to show increasing enthusiasm for stocks, actual public equity allocations among individual investors, pensions, endowments, foundations, and hedge funds remain more focused on limiting the downside risk of public equity holdings than on potential opportunities.
The current financial media is full of discussions predicting imminent bear market, the collapse of a sector, or some extreme speculation that “will end badly.” Bulls who aren’t advocating equity-income strategies are treated with suspicion, whereas bears, many of whom have missed the entire 8-year bull market, are considered wisely prudent.
It seems to us that this is definitely not the sentiment backdrop that tends to accompany a stock market peak. Investors tend to be wildly bullish when a bull market is in “the bottom of the 9th inning with 2 outs and 2 strikes on the batter.” We can find no investor class that is showing such over-enthusiasm for stocks.
Of course volatility and corrections can occur at any time, but we strongly doubt that anyone can consistently time short-term market gyrations. More importantly, investors need to objectively consider the probability of a full-blown bear market. Currently, we’d argue the probability of a bear market is meaningfully lower than most investors suspect.
Futile attempt to time the market short-term
As we’ve repeatedly demonstrated, trying to time the market on a short- term basis is a futile exercise. In fact, intra-day trading is like flipping a coin. The probability of a trade making money on an intra-day basis is about 50/50 (i.e., like flipping a coin), whereas investing with longer time horizons has a considerably higher probability of being successful.
The data show that investors’ returns have been significantly hurt by poorly timing market and asset class movements. Chart 1 shows the performance of the “average investor” using data from the Dalbar Group. Because investors are constantly mistiming investment decisions, investors have actually not outperformed cash over the past 20 years.
CHART 1:
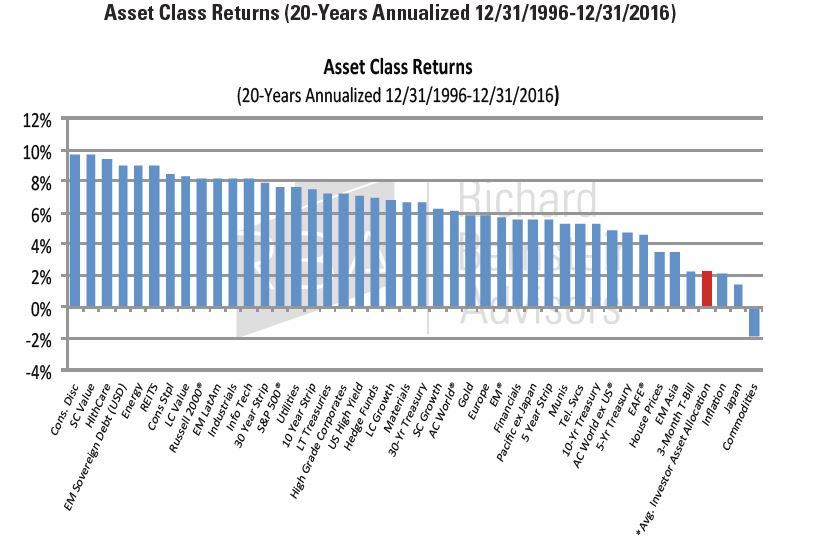
Source: Richard Bernstein Advisors LLC., Bloomberg, MSCI, Standard & Poor's, Russell, HFRI, BofA Merrill Lynch, DALBAR Inc., FHFA ,FRB, FTSE. Total Returns in USD. *Avg Investor Asset Allocation returns are represented by the DALBAR Inc. Average Investor Asset Allocation Returns. For Index descriptors, see "Index Descriptions" at end of document.
What tends to signal a bear market?
There are basically three sets of indicators RBA watches to determine if a bear market could be on the horizon: corporate profits, liquidity, and sentiment/valuation. Everyone has their favorite indicators, but these indicators have been tested on long histories, and we have used these through many real-time market cycles. A combination of deteriorating corporate profits, too much liquidity drained from the economy, and euphoric sentiment toward equities have historically been a very reliable combination to signal a looming bear market.
Although, none of these categories are as attractive as they were at the beginning of the bull market in March 2009, none are currently signaling a significant probability of a bear market.
Corporate profits
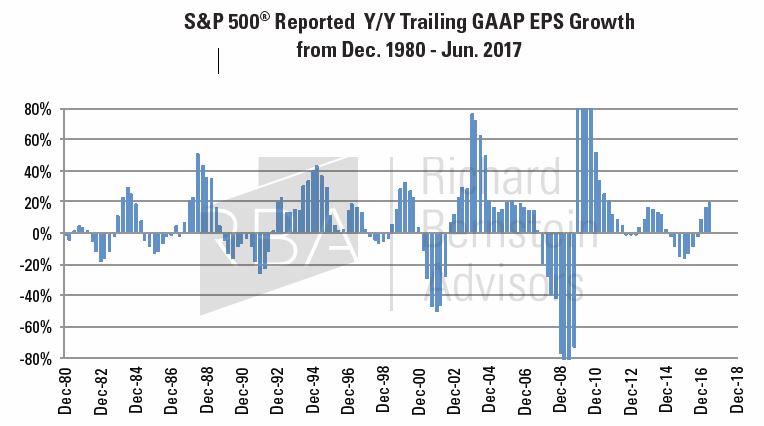
The US corporate profits cycle troughed in 4Q2015, and has accelerated since ( i.e., the growth rate in profits has been increasing). Admittedly, growth comparisons get tougher during 2018, but corporate profits continue to appear healthy. Chart 2 shows the historical US corporate profits cycle. History suggests it would be extremely unusual to have a bear market when profits are accelerating.
CHART 2:
Liquidity
Liquidity is the life blood of both the financial and real economies. In other words, it supports both financial investment and capital investment. By most measures, there remains abundant liquidity within the US economy. It has historically not been troublesome when the Federal Reserve begins to withdraw liquidity from the economy. Investors need to watch for when they withdraw too much liquidity.
The slope of the yield curve has been a reliable indicator to determine when too much liquidity has been withdrawn from the economy. A positively sloped curve generally indicates adequate liquidity, but an inverted curve (i.e., short-term rates are higher than long-term rates) has historically indicated a higher probability of both a bear market and an economic recession.
Although the curve has flattened during 2017, it remains positively sloped (see Chart 3). Accordingly, the probability of a bear market seems low.
CHART 3:
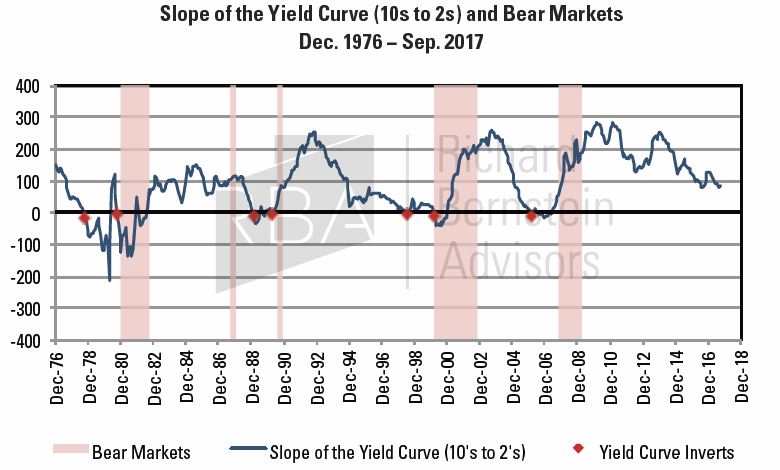
Source: Richard Bernstein Advisors, LLC., Standard & Poor’s, Bloomberg Finance L.P.
Sentiment/Valuation
I used to teach in the Stern School of Business MBA program. Valuation discussions always involved a future stream of cash flows discounted by the appropriate interest rate. It is puzzling why the current debate on stock market valuation does not include a discussion of interest rates. Valuation measures, such as PE ratios, need to be gauged by interest rates, and discussing PEs in isolation has no meaning.
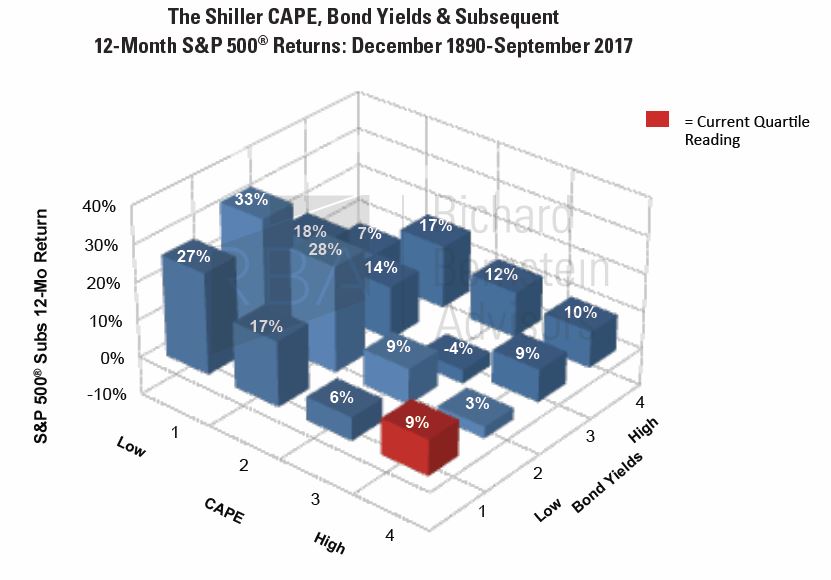
When the stock market’s P/E ratio was about 30 in 1999/2000 and had exceeded 40 based on the Shiller Cyclically Adjusted P/E (CAPE), the 10-year T-note ranged between 5.8% and 6.8%. Today, the Shiller CAPE is about 30 and the 10-year T-note is about 2.3%. It seems odd that few investors were concerned about valuation in 1999/2000, but it is a standard discussion topic today.
Chart 4 shows the 12-month forward expected return given combinations of The Shiller CAPE and interest rates. The current expected return from this analysis is 9%.
CHART 4:
Short-term volatility vs. a full-blown bear market
Investors should ignore the noise about short-term volatility and imminent market collapse, and get back to the basics of asset allocation. Fears of a repeat of 2008 have probably led most investors to significantly underweight public equities throughout the bull market, and portfolio performance has likely suffered as a result.
Timing short-term volatility has historically been a worthless exercise for the vast majority of investors. Investors need to differentiate the noise of the potential for short-term volatility from a fundamental assessment of the probability of a recession and bear market.
Our time-tested research approach continues to indicate that the probability of a full-blown bear market is considerably lower than most investors believe. We continue to believe that there is plenty of opportunity in the global equity markets despite the length of the current bull market.
INDEX DESCRIPTIONS:
The following descriptions, while believed to be accurate, are in some cases abbreviated versions of more detailed or comprehensive definitions available from the sponsors or originators of the respective indices. Anyone interested in such further details is free to consult each such sponsor’s or originator’s website.
The past performance of an index is not a guarantee of future results.
Each index reflects an unmanaged universe of securities without any deduction for advisory fees or other expenses that would reduce actual returns, as well as the reinvestment of all income and dividends. An actual investment in the securities included in the index would require an investor to incur transaction costs, which would lower the performance results. Indices are not actively managed and investors cannot invest directly in the indices.
MSCI All Country World Index (ACWI®): The MSCI ACWI® Index is a widely recognized, free-float-adjusted, market- capitalization-weighted index designed to measure the equity- market performance of global developed and emerging markets.
MSCI All Country World Index (ACWI®) ex US : The MSCI ACWI® ex US Index is a free-float-adjusted, market-capitalization-weighted index designed to measure the equity-market performance of global developed and emerging markets excluding the US.
S&P 500®: Standard & Poor’s (S&P) 500® Index. The S&P 500® Index is an unmanaged, capitalization-weighted index designed to measure the performance of the broad US economy through changes in the aggregate market value of 500 stocks representing all major industries.
U.S. Small Caps: Russell 2000 Index. The Russell 2000 Index is an unmanaged, capitalization-weighted index designed to measure the performance of the small-cap segment of the US equity universe. The Russell 2000 Index is a subset of the Russell 3000® Index.
EM Equity: MSCI Emerging Markets (EM) Index. The MSCI EM Index is a free-float-adjusted, market-capitalization-weighted index designed to measure the equity-market performance of emerging markets.
EM Asia: MSCI Emerging Markets Asia Index. The MSCI EM Asia Index is a free-float-adjusted, market-capitalization-weighted index designed to measure the equity-market performance of emerging markets in Asia.
Latam: MSCI EM (Emerging Markets) Latin America Index. The MSCI EM Latin America Index s a free float-adjusted market capitalization weighted index that is designed to measure the equity market performance of emerging markets in Latin America. The MSCI EM Latin America Index consists of the following 5 emerging market country indices: Brazil, Chile, Colombia, Mexico, and Peru.
Japan: MSCI Japan Index. The MSCI Japan Index is a free- float-adjusted, market-capitalization-weighted index designed to measure the equity-market performance of Japan.
EAFE®: MSCI Europe, Australasia, Far East (EAFE®) The MSCI EAFE® Index is a free-float-adjusted, market-capitalization-weighted index designed to measure the equity-market performance of developed markets excluding the US & Canada.
Pacific ex Japan: The MSCI Pacific ex Japan Index is a free-float-adjusted, market-capitalization-weighted index designed to measure the equity-market performance of Australia, New Zealand, Hong Kong and Singapore markets.
Europe: MSCI Europe Index. The MSCI Europe index is a free float-adjusted market capitalization weighted index that is designed to measure the equity market performance of the developed markets in Europe. The MSCI Europe Index consists of the following 16 developed market country indices: Austria, Belgium, Denmark, Finland, France, Germany, Greece, Ireland, Italy, the Netherlands, Norway, Portugal, Spain, Sweden, Switzerland, and the United Kingdom.
Large Cap Growth: The Russell 1000 Growth Index. The Russell 1000 Growth Index measures the performance of the large-cap growth segment of the U.S. equity universe. It includes those Russell 1000 Index companies with higher price-to-book ratios and higher forecasted growth values. The Russell 1000 Growth Index is constructed to provide a comprehensive and unbiased barometer for the large-cap growth segment. The Index is completely reconstituted annually to ensure new and growing equities are included and that the represented companies continue to reflect growth characteristics.
Large Cap Value: The Russell 1000 Value Index. The Russell 1000 Value Index measures the performance of the large-cap value segment of the U.S. equity universe. It includes those Russell 1000 Index companies with lower price-to-book ratios and lower expected growth values. The Russell 1000 Value Index is constructed to provide a comprehensive and unbiased barometer for the large-cap value segment. The Index is completely reconstituted annually to ensure new and growing equities are included and that the represented companies continue to reflect value characteristics
Small Cap Growth: The Russell 2000 Growth Index. The Russell 2000 Growth Index measures the performance of the small-cap growth segment of the U.S. equity universe. It includes those Russell 2000 Index companies with higher price-to-book ratios and higher forecasted growth values. The Russell 2000 Growth Index is constructed to provide a comprehensive and unbiased barometer for the small-cap growth segment. The Index is completely reconstituted annually to ensure new and growing equities are included and that the represented companies continue to reflect growth characteristics.
Sector/Industries: Sector/industry references in this report are in accordance with the Global Industry Classification Standard (GICS®) developed by MSCI Barra and Standard & Poor’s. The GICS structure consists of 10 sectors, 24 industry groups, 68 industries and 154 sub-industries.
Gold: Gold Spot USD/oz Bloomberg GOLDS Commodity. The Gold Spot price is quoted as US Dollars per Troy Ounce.
Commodities: S&P GSCI® Index. The S&P GSCI® seeks to provide investors with a reliable and publicly available benchmark for investment performance in the commodity markets, and is designed to be a “tradable” index. The index is calculated primarily on a world production-weighted basis and is comprised of the principal physical commodities that are the subject of active, liquid futures markets.
Hedge Fund Index: HFRI Fund Weighted Composite Index. The HFRI Fund Weighted Composite Index is a global, equal-weighted index of over 2,000 single-manager funds that report to the HFR (Hedge Fund Research) database. Constituent funds report monthly net-of-all-fees performance in USD and have a minimum of $50 million under management or a twelve (12)-month track record of active performance. The Index includes both domestic (US) and offshore funds, and does not include any funds of funds.
REITS: THE FTSE NAREIT Composite Index. The FTSE NAREIT Composite Index is a free-float-adjusted, market- capitalization-weighted index that includes all tax qualified REITs listed in the NYSE, AMEX, and NASDAQ National Market.
3-Mo T-Bills: BofA Merrill Lynch 3-Month US Treasury Bill Index. The BofA Merrill Lynch 3-Month US Treasury Bill Index is comprised of a single issue purchased at the beginning of the month and held for a full month. The Index is rebalanced monthly and the issue selected is the outstanding Treasury Bill that matures closest to, but not beyond, three months from the rebalancing date.
Long-term Treasury Index: BofA Merrill Lynch 15+ Year US Treasury Index. The BofA Merrill Lynch 15+ Year US Treasury Index is an unmanaged index comprised of US Treasury securities, other than inflation-protected securities and STRIPS, with at least $1 billion in outstanding face value and a remaining term to final maturity of at least 15 years.
Municipals: BofA Merrill Lynch US Municipal Securities Index. The BofA Merrill Lynch US Municipal Securities Index tracks the performance of USD-denominated, investment-grade rated, tax- exempt debt publicly issued by US states and territories (and their political subdivisions) in the US domestic market. Qualifying securities must have at least one year remaining term to final maturity, a fixed coupon schedule, and an investment-grade rating (based on an average of Moody’s, S&P and Fitch). Minimum size requirements vary based on the initial term to final maturity at the time of issuance.
High Grade Corporates: BofA Merrill Lynch 15+ Year AAA-AA US Corporate Index. The BofA Merrill Lynch 15+ Year AAA-AA US Corporate Index is a subset of the BofA Merrill Lynch US Corporate Index (an unmanaged index comprised of USD-denominated, investment-grade, fixed-rate corporate debt securities publicly issued in the US domestic market with at least one year remaining term to final maturity and at least $250 million outstanding) including all securities with a remaining term to final maturity of at least15 years and rated AAA through AA3, inclusive.
U.S. High Yield: BofA Merrill Lynch US Cash Pay High Yield Index. The BofA Merrill Lynch US Cash Pay High Yield Index tracks the performance of USD-denominated, below-investment- grade-rated corporate debt, currently in a coupon-paying period, that is publicly issued in the US domestic market. Qualifying securities must have a below-investment-grade rating (based on an average of Moody’s, S&P and Fitch) and an investment- grade-rated country of risk (based on an average of Moody’s, S&P and Fitch foreign currency long-term sovereign debt ratings), at least one year remaining term to final maturity, a fixed coupon schedule, and a minimum amount outstanding of $100 million.
5-Year Strip: The BofA Merrill Lynch US 5-Year Constant Maturity STRIP Index (S010) The BofA Merrill Lynch US 10 Year Constant Maturity STRIP Index tracks the performance of a single synthetic US Treasury STRIP purchased at the beginning of the month, held for one month, and then sold at the end of the month with the proceeds rolled into a new instrument. Therefore, on the purchase date, the bond has a maturity exactly equal to the stated maturity of the index, and at the point it is sold it is one month short of the index stated maturity. The synthetic STRIP has a zero coupon, a purchase yield equal to the yield of the corresponding point on the coupon STRIP curve, and a purchase price which is derived from the purchase yield.
10-Year Treasury: The BofA Merrill Lynch 10-Year US Treasury Index. The BofA Merrill Lynch 10-Year US Treasury Index is a one- security index comprised of the most recently issued 10-year US Treasury note. The index is rebalanced monthly. In order to qualify for inclusion, a 10-year note must be auctioned on or before the third business day before the last business day of the month.
10-Year Strip: The BofA Merrill Lynch US 30-Year Constant Maturity STRIP Index (S010) The BofA Merrill Lynch US 10 Year Constant Maturity STRIP Index tracks the performance of a single synthetic US Treasury STRIP purchased at the beginning of the month, held for one month, and then sold at the end of the month with the proceeds rolled into a new instrument.Therefore, on the purchase date, the bond has a maturity exactly equal to the stated maturity of the index, and at the point it is sold it is one month short of the index stated maturity. The synthetic STRIP has a zero coupon, a purchase yield equal to the yield of the corresponding point on the coupon STRIP curve, and a purchase price which is derived from the purchase yield.
30-Year Treasury: The BofA Merrill Lynch Current 30-Year US Treasury Index The BofA Merrill Lynch Current 30-Year US Treasury Index is a one-security index comprised of the most recently issued 30-year US Treasury bond. The index is rebalanced monthly. In order to qualify for inclusion, a 30-year bond must be auctioned on or before the third business day before the last business day of the month.
30-Year Strip: The BofA Merrill Lynch US 30 Year Constant Maturity STRIP Index (S030) The BofA Merrill Lynch US 30 Year Constant Maturity STRIP Index tracks the performance of a single synthetic US Treasury STRIP purchased at the beginning of the month, held for one month, and then sold at the end of the month with the proceeds rolled into a new instrument. Therefore, on the purchase date, the bond has a maturity exactly equal to the stated maturity of the index, and at the point it is sold it is one month short of the index stated maturity. The synthetic STRIP has a zero coupon, a purchase yield equal to the yield of the corresponding point on the coupon STRIP curve, and a purchase price which is derived from the purchase yield.
EM Sovereign: The BofA Merrill Lynch US Dollar Emerging Markets Sovereign Plus Index. The BofA Merrill Lynch US Dollar Emerging Markets Sovereign Plus Index tracks the performance of US dollar denominated emerging market and cross-over sovereign debt publicly issued in the Eurobond or US domestic market. Qualifying countries must have a BBB1 or lower foreign currency long-term sovereign debt rating (based on an average of Moody’s, S&P and Fitch). Countries that are not rated, or that are rated “D” or “SD” by one or several rating agencies qualify for inclusion in the index but individual non-performing securities are removed. Qualifying securities must have at least one year remaining term to final maturity, a fixed or floating coupon and a minimum amount outstanding of $250 million. Local currency debt is excluded from the Index.
House Prices: The FHFA HPI. The HPI is a broad measure of the movement of single-family house prices. The HPI is a weighted, repeat-sales index, meaning that it measures average price changes in repeat sales or refinancings on the same properties. This information is obtained by reviewing repeat mortgage transactions on single-family properties whose mortgages have been purchased or securitized by Fannie Mae or Freddie Mac since January 1975.
Inflation: The Consumer Price Index (CPI). The CPI is a measure of the average change in prices over time of goods and services purchased by households. The CPI is based on prices of food, clothing, shelter, and fuels, transportation fares, charges for doctors' and dentists' services, drugs, and other goods and services that people buy for day-to-day living. Source: Bureau of Labor Statistics.
Avg. Asset Allocation Investor Returns: Returns are for the period ending December 31, 2016. The DALBAR Inc. Average Asset Allocation Investor performance results are calculated using data supplied by the Investment Company Institute. Investor returns are represented by the change in total mutual fund assets after excluding sales, redemptions and exchanges. This method of calculation trading costs, sales charges, fees, expenses and any other costs. After calculating investor returns in dollar terms, two percentages are calculated for the period examined: Total investor return rate and annualized investor return rate. Total return rate is determined by calculating the investor return dollars as a percentage of the net of the sales, redemptions and exchanges for each period.
Bear Market: Bear Market defined as the S&P 500® Index closing at least 20% down from its previous high close. It’s duration is the period from the previous high to the lowest close reached after it has fallen 20% or more.
CAPE: The cyclically adjusted price-to-earnings ratio, commonly known as CAPE, Shiller P/E, or P/E 10 ratio, is a valuation measure commonly applied to the US S&P 500® equity market. It is defined as price divided by the average of ten years of earnings (moving average), adjusted for inflation. It was developed by Robert Shiller, a professor of economics at Yale University and author of “Irrational Exuberance” (Crown Business, 2006).
© Copyright 2017 Richard Bernstein Advisors LLC. All rights reserved. PAST PERFORMANCE IS NO GUARANTEE OF FUTURE RESULTS
Nothing contained herein constitutes tax, legal, insurance or investment advice, or the recommendation of or an offer to sell, or the solicitation of an offer to buy or invest in any investment product, vehicle, service or instrument. Such an offer or solicitation may only be made by delivery to a prospective investor of formal offering materials, including subscription or account documents or forms, which include detailed discussions of the terms of the respective product, vehicle, service or instrument, including the principal risk factors that might impact such a purchase or investment, and which should be reviewed carefully by any such investor before making the decision to invest. Links to appearances and articles by Richard Bernstein, whether in the press, on television or otherwise, are provided for informational purposes only and in no way should be considered a recommendation of any particular investment product, vehicle, service or instrument or the rendering of investment advice, which must always be evaluated by a prospective investor in consultation with his or her own financial adviser and in light of his or her own circumstances, including the investor’s investment horizon, appetite for risk, and ability to withstand a potential loss of some or all of an investment’s value. Investing is subject to market risks. Investors acknowledge and accept the potential loss of some or all of an investment’s value. Past performance is, of course, no guarantee of future results. Views represented are subject to change at the sole discretion of Richard Bernstein Advisors LLC. Richard Bernstein Advisors LLC does not undertake to advise you of any changes in the views expressed herein.
Membership required
Membership is now required to use this feature. To learn more:
View Membership BenefitsSponsored Content
Upcoming Virtual Events View All


