Some Thoughts on 2018
Membership required
Membership is now required to use this feature. To learn more:
View Membership BenefitsAs we thought might happen, 2017 turned out to be a better year for the stock market than investors expected. The S&P 500®’s total return so far this year (through 11/30) is nearly 21%. Despite the consensus view that investors are confronting a “low return environment”, the S&P 500® has returned more than 15%/year over the last five years. Bonds (approximately 2%/year) and hedge funds (approximately 4%/year) certainly provided low returns, but the general perception that returns are below normal seems to reflect investors’ poor asset allocation decisions rather than the reality of public equity returns (see Chart 1).
CHART 1
Stocks vs. Bonds and Hedge Funds Past 5 years
(11/30/12 – 11/30/17)
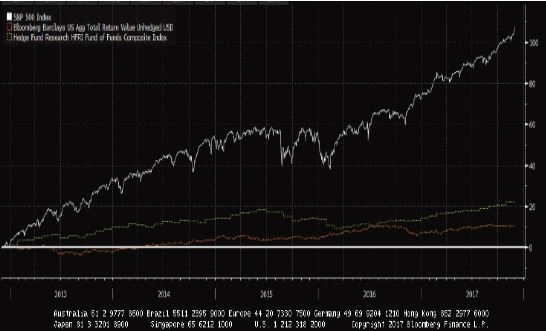
Source: Richard Bernstein Advisors LLC., Bloomberg Finance L.P.
Investors still do not fully appreciate the magnitude of opportunity cost they have paid to alleviate their fears that 2008 would repeat. Considering the S&P 500® fell about 55% during 2008’s bear market, it seems rather irrational to be so scared as to sacrifice roughly 97% return (i.e., the 5-year compounded difference between stock and bond returns).
Chart 2 shows the historical probability of large drawdowns in the S&P 500®. Drawdowns similar to 2008’s have historically occurred only 0.5% of the time! Yet, both individual and institutional investors have been structuring portfolios as though the markets were necessarily going to replay 2008.
CHART 2:
S&P 500®: Historical Probability of a Loss
(Rolling 12-Month Total Returns, Dec. 1926 - Nov. 2017)
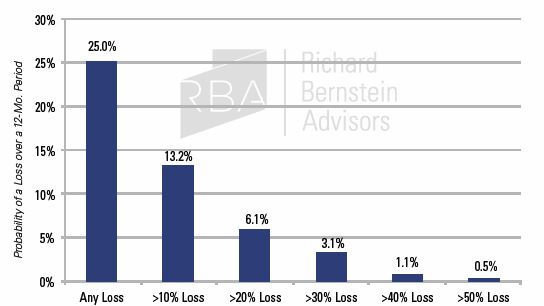
Source: Richard Bernstein Advisors LLC., Morningstar(Ibbotson)
Drawdowns similar to 2008’s have historically occurred only 0.5% of the time! Yet, both individual and institutional investors have been structuring portfolios as though the markets were necessarily going to replay 2008.
Fear has caused 2017 to largely be another year of missed opportunities, and we remain bullish on the global equity markets for 2018 based on our previously stated considerations of improving global profits, significant liquidity, and investor’s general hesitancy to embrace equities. Here are several other issues investors should consider:
Return on capital is highest when capital is scarce(r).
One of RBA’s primary investment tenets is that return on capital is highest when capital is scarce. In other words, it is more profitable to be the one banker in a town of 1,000 borrowers than it is to be one of 1,000 bankers in a town of one borrower. Simple supply and demand for capital tends to set prospective investment returns.
Financial markets remain flooded with liquidity, and most central banks remain net liquidity providers. A positively sloped yield curve is a reasonable measure of whether central banks are liquidity providers, and 95% of the world’s yield curves are currently positively sloped. In addition, both the corporate sector (available share repurchase resources) and buyout-oriented private equity firms (available “dry powder”) remain substantial additional sources of liquidity.
However, it is difficult today to find segments of the global financial markets that are starved for capital because of the abundance of liquidity. However, we have found success in our portfolios by searching for market segments in which capital is relatively scarcer if not scarce.
Chart 3 shows the flows into bond and commodity mutual funds and ETFs since interest rates troughed in mid-2016. It’s hard to argue that bonds are starved for capital when nearly a half-trillion dollars have flowed into bond funds and ETFs. However, only about 1/100th of that amount has flowed into commodity funds and ETFs during the period. This is one reason RBA’s portfolios have been overweight materials, gold miners, and gold, and why the fixed-income weights in our multi-asset portfolios have been close to their minimum allowed levels.
CHART 3:
Cumulative Fund & ETF Flows
(June 2016 - October 2017)
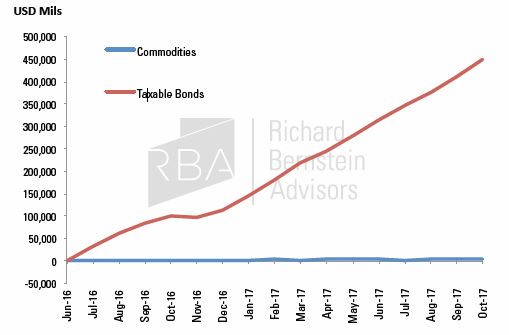
Source: Richard Bernstein Advisors LLC., Morningstar
Nearly a half-trillion dollars have flowed into bond funds and ETFs. However, only about 1/100th of that amount has flowed into commodity funds and ETFs during the period.
US yield curve still OK
The slope of the yield curve has historically been a very reliable indicator of future nominal growth, and inverted yield curves have generally signaled a looming profits recession. Although US investors generally ignored the yield curve’s positive message when the curve was steep, they are now paying inordinate attention to the curve’s slope as it flattens. Contrary to popular belief, a flattening yield curve has historically still been an optimistic sign for equity returns.
The yield curve’s signals have not mimicked a dimmer switch, meaning that flatter curves do not forecast incrementally lower returns and incrementally higher probabilities of bear markets. Rather, the yield curve’s signals have mimicked an on/off switch. Stock market expected returns are generally positive so long as the curve is positively sloped, but expected returns skew negatively when the curve inverts.
Table 1 shows historical expected returns and probabilities of a negative return for varying ranges of yield curve slopes. Note that the stock market’s expected return was about 17%, the expected return was negative only 12% of the time, and the 12-month potential drawdown was the shallowest when the spread between the 10-year and 2-year t-notes was between 0 and 50 bps.
TABLE 1:
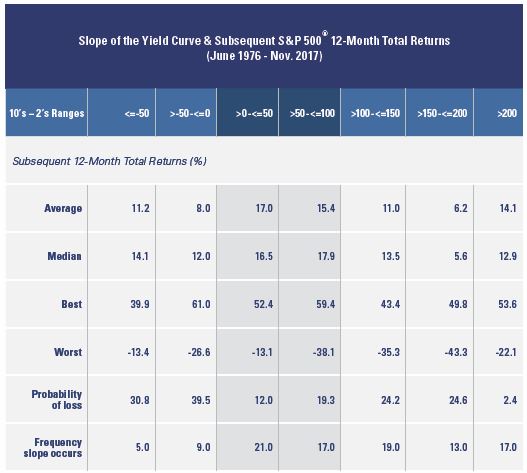
Source: Richard Bernstein Advisors, LLC., FRB, Bloomberg Finance L.P.
Note that the stock market’s expected return was about 17%, the expected return was negative only 12% of the time, and the 12-month potential drawdown was the shallowest when the spread between the 10-year and 2-year t-notes was between 0 and 50 bps.
Quick takes on taxes
Several points regarding taxes in 2018, keeping in mind that nothing has been finalized in Washington as we write:
➜ C utting corporate taxes is, taken alone, an unmitigated bullish event for the equity market. Cutting corporate taxes is specifically designed to benefit the owners of capital. Who are the owners of capital? Equity shareholders!
➜ C utting corporate taxes is like giving a shot of adrenalin to a healthy patient. The US corporate sector is very healthy (see Chart 4 ), and cutting taxes will likely make the sector even healthier.
CHART 4:
US Corporate Profits* as a Percentage of GDP
(4Q 1947 − 3Q 2017)
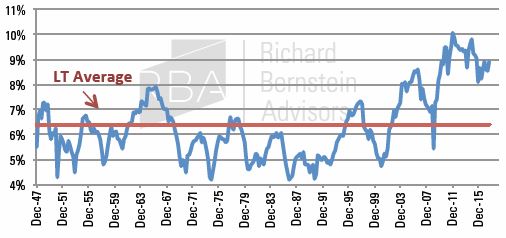
Source: Richard Bernstein Advisors, LLC., BEA, *US Corporate Profits computed after tax with IVA and CCA. For IVA and CCA descriptors see "Index Descriptions" at end of document.
Cutting corporate taxes is like giving a shot of adrenalin to a healthy patient. The US corporate sector is very healthy (see Chart 4 ), and cutting taxes will likely make the sector even healthier.
➜ Cutting personal taxes makes tax-oriented strategies marginally less advantageous. For example, if the personal tax rate were 0%, there would be no need for tax-oriented strategies. Clearly, tax rates are not going to 0%, but history shows that lowering personal tax rates can lessen the attractiveness of tax havens. This was an important consideration after the 1980’s tax reform. RBA currently has minimal muni bond exposure in our multi-asset portfolios.
➜ One should be skeptical of the political claims regarding the strength of the multiplier effects of tax cuts on employment, etc. For example, a company might consider purchasing new computers if capital equipment can be immediately depreciated/ expensed, but those computers are most likely manufactured in Taiwan, Korea, or China rather than in the US. So some portion of the tax cuts’ stimulus will inevitably “leak” abroad.
➜ Similarly, there is the risk of leakage whether households save or spend their tax savings. If they buy a new TV, car, or home goods, the odds are that the goods bought will be produced outside
the US. It’s possible that the trade deficit could deteriorate as a result. If they save, then some portion of the incremental savings might be allocated to non-US markets and lower the cost of capital for non-US companies, which might increase their relative competitiveness.
➜ No one knows whether any of the multiplier effects will leak abroad, but it is a fair guess that the multiplier effects within the US economy will be smaller than those touted. We believe the emerging markets might be an unintended beneficiary. Emerging markets have been significantly overweight within RBA’s portfolios.
➜ The odds are that the Federal Reserve will have a tighter policy because of the tax cuts because of potentially stronger nominal growth. In addition, the Fed might worry about potential capital flight and the associated rising inflation expectations of a weaker US dollar.
These tax-related factors further support our overweight positions in our portfolios in emerging markets, US cyclicals, and very short-duration and minimally weighted fixed-income.
The requisite comment on Bitcon (our sarcastic name)
After the technology and housing bubbles, investors too frequently use the term bubble. Whereas it is true that all bubbles contain speculation, not all speculation can be classified as a bubble. Bubbles are much broader than speculation in that bubbles go beyond the financial markets and pervade society.
From our research, there are five characteristics of a financial bubble:
- Available liquidity
- Increased use of leverage
- Democratization of the market
- Increased new issues
- Increased turnover
Cyrpto-currencies clearly have all five characteristics of a bubble:
- Available liquidity - central banks have clearly provided a sea of liquidity.
- Leverage - the upcoming listing of futures contracts may be just the beginning.
- Democratization – individuals globally are active participants.
- New issues - there are over 1,000 crypto-currencies.
- Turnover - trading volumes have soared.
Bubbles tend to continue until the liquidity needed to speculate dries up. The technology and housing bubbles’ peaks were both preceded by an inverted yield curve. Accordingly, it is our guess that the crypto-bubble will continue until the Fed and other central banks remove too much liquidity from the economy, the availability of “greater fools” decreases, and the bubble deflates. We do not see an inverted yield curve anytime soon, so the bubble seems likely to inflate more. One would have thought that investors would have learned their lesson from the deflation of the technology and housing bubbles, but that doesn’t appear to be the case. The sad reality is that many more investors will likely get sucked into this bubble too.
The key question is whether investors in 2018 will finally regain their confidence in the equity markets. It is ironic that they fear traditional equities, but they do not fear crypto- currencies. One must remember that risk typically lies in what you’re invested in, and not in what you fearfully avoid.
INDEX DESCRIPTIONS:
The following descriptions, while believed to be accurate, are in some cases abbreviated versions of more detailed or comprehensive defini- tions available from the sponsors or originators of the respective indices. Anyone interested in such further details is free to consult each such sponsor’s or originator’s website.
The past performance of an index is not a guarantee of future results.
Each index reflects an unmanaged universe of securities without any deduction for advisory fees or other expenses that would reduce actual returns, as well as the reinvestment of all income and dividends. An actual investment in the securities included in the index would require an investor to incur transaction costs, which would lower the performance results. Indices are not actively managed and investors cannot invest directly in the indices.
S&P 500®: Standard & Poor’s (S&P) 500® Index. The S&P 500® Index is an unmanaged, capitalization-weighted index designed to measure the performance of the broad US economy through changes in the aggregate market value of 500 stocks representing all major industries.
Bonds: The Bloomberg Barclays US Aggregate Bond Index: The Bloomberg Barclays US Aggregate Bond Index is a broad-based benchmark that measures the investment grade, US dollar- denominated, fixed-rate taxable bond market. The index includes Treasuries, government-related and corporate securities, MBS (agency fixed-rate and hybrid ARM pass-throughs), ABS and CMBS (agency and non-agency).
Hedge Funds: HFRI Fund Weighted Composite Index.
The HFRI Fund Weighted Composite Index is a global, equal-weighted index of over 2,000 single-manager funds that report to the HFR (Hedge Fund Research) database. Constituent funds report monthly net- of-all-fees performance in USD and have a minimum of $50 million under management or a twelve (12)-month track record of active performance. The Index includes both domestic (US) and offshore funds, and does not include any funds of funds.
Corporate Profits IVA: Inventory Valuation Adjustment. The inventory valuation adjustment (IVA) is an adjustment made in the national income and product accounts (NIPAs) to corporate profits and proprietors' income in order to remove inventory "profits“, which are more like capital gains than profits from current production.
Corporate Profits CCA: Capital Consumption Adjustment. The capital consumption adjustment (CCA) is used to adjust gross domestic product for the wear and tear of capital during the course of production. The result of this adjustment is net domestic product. The CCA is also the difference between gross private domestic investment (i.e., the total amount of investment expenditures for capital goods) and net private domestic investment.
© Richard Bernstein Advisors LLC. All rights reserved. PAST PERFORMANCE IS NO GUARANTEE OF FUTURE RESULTS
Nothing contained herein constitutes tax, legal, insurance or investment advice, or the recommendation of or an offer to sell, or the solicitation of an offer to buy or invest in any investment product, vehicle, service or instrument. Such an offer or solicitation may only be made by delivery to a prospective investor of formal offering materials, including subscription or account documents or forms, which include detailed discussions of the terms of the respective product, vehicle, service or instrument, including the principal risk factors that might impact such a purchase or investment, and which should be reviewed carefully by any such investor before making the decision to invest. Links to appearances and articles by Richard Bernstein, whether in the press, on television or otherwise, are provided for informational purposes only and in no way should be considered a recommendation of any particular investment product, vehicle, service or instrument or the rendering of investment advice, which must always be evaluated by a prospective investor in consultation with his or her own financial adviser and in light of his or her own circumstances, including the investor’s investment horizon, appetite for risk, and ability to withstand a potential loss of some or all of an investment’s value. Investing is subject to market risks. Investors acknowledge and accept the potential loss of some or all of an investment’s value. Past performance is, of course, no guarantee of future results. Views represented are subject to change at the sole discretion of Richard Bernstein Advisors LLC. Richard Bernstein Advisors LLC does not undertake to advise you of any changes in the views expressed herein.
Membership required
Membership is now required to use this feature. To learn more:
View Membership BenefitsSponsored Content
Upcoming Virtual Events View All


