One of RBA’s axioms of investing is that markets do not care about the levels of economic statistics. Rather, markets move based on the change in those statistics. The entire concept of a cycle is based on the economy improving, peaking, deteriorating, and troughing, and not on absolute levels of growth. “Good” or “bad” doesn’t matter; markets care about “better” or “worse”.
We re-structured our bond holdings during mid-year 2016 because the inflation backdrop began to change. The absolute level of inflation was low, but many indicators began to suggest that inflation could rise. It seemed to us that bond returns could suffer if inflation began to rise more than investors expected.
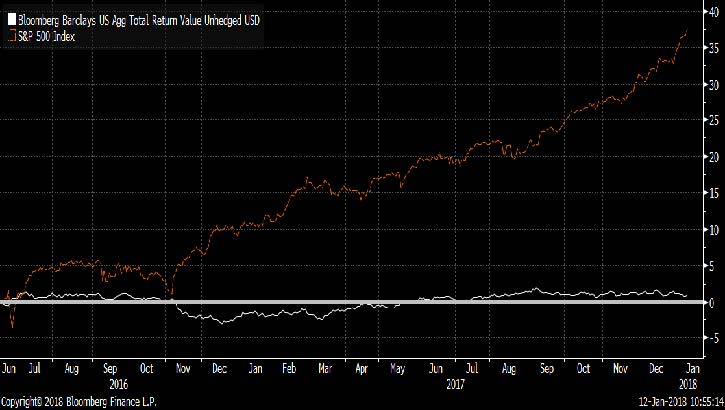
In retrospect, our timing was fortunate. Bond returns have suffered as inflation expectations rose. As Charts 1 and 2 point out, bonds have underperformed stocks by more than 35 percentage points since inflation expectations troughed in June 2016. In fact, bonds have barely produced positive returns since inflation expectations troughed.
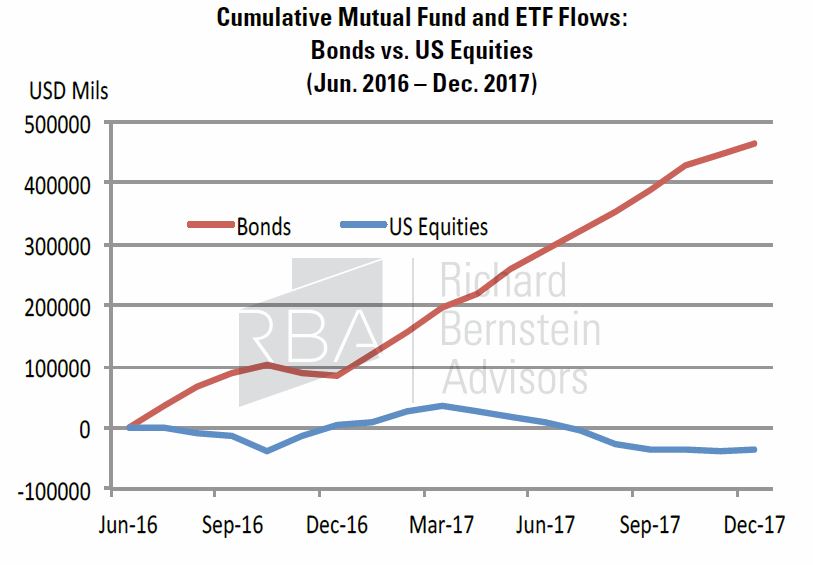
Flows into bond funds and ETFs (see Chart 3) indicate investors have generally ignored bonds’ underperformance or perhaps considered the underperformance temporary. However, the business cycle isn’t dead, and inflation has begun to rise as it normally does in a late-cycle environment. Bond investors’ ostrich-like strategy to this shifting environment suggests that bonds’ day of reckoning may be upon us.
CHART 1:
Inflation Expectations: 5 Yr 5Yr Forward Breakeven
(Weekly, Jan. 18, 2013 – Jan. 11, 2018)

Source: Richard Bernstein Advisors LLC., Bloomberg Finance L.P.
CHART 2:
S&P 500® vs. Bloomberg Barclays US Aggregate Bond Index
(Jun. 30, 2016 – Jan. 11, 2018)
Source: Richard Bernstein Advisors LLC., Bloomberg Finance L.P.
CHART 3:
Source: Richard Bernstein Advisors LLC., ICI
Inflation is a normal business cycle event
Inflation is a normal business cycle event. Both monetarist and Keynesian theories suggest that inflation should pick up as a business cycle matures. A monetarist might argue that corporate profits and wages improve as the cycle matures, companies and households become more credit-worthy, lending increases, and inflation picks up as money growth increases. A Keynesian might argue that demand outstrips supply and prices accordingly rise as the cycle matures and bottlenecks form within the economy.
Inflation is a lagging indicator. Whether one utilizes the monetarist or the Keynesian framework discussed, one should realize that the economy must gain some strength before credit conditions improve and before bottlenecks form. This was true even in the last cycle when the US CPI didn’t peak until mid-2008 at 5.6%.
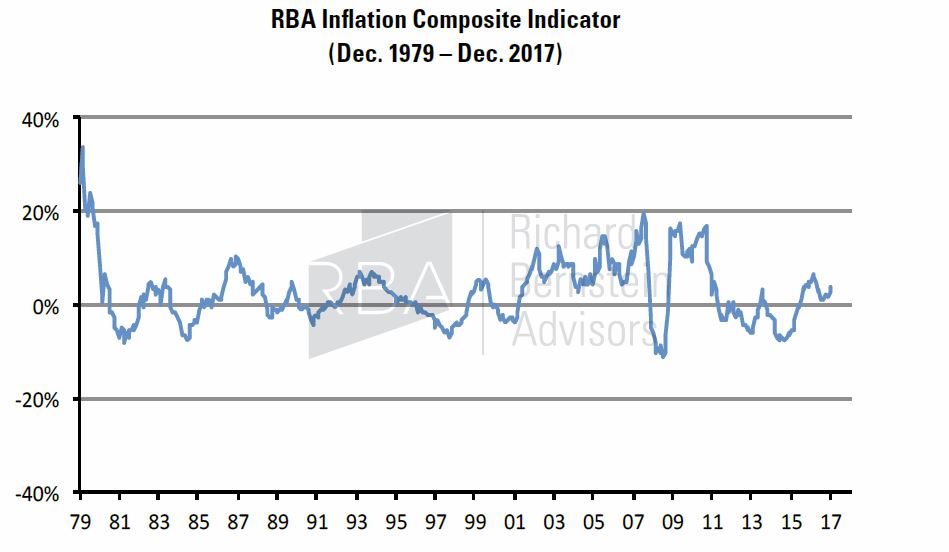
RBA’s Inflation Composite Indicator suggests that this normal late-cycle situation is indeed forming. The indicator is a proprietary composite of a number of well-known inflation measures. Chart 4 shows that the composite has been rising since 2014/15 as the normal later-cycle pressures have begun to build.
CHART 4:
The weakening USD doesn’t help
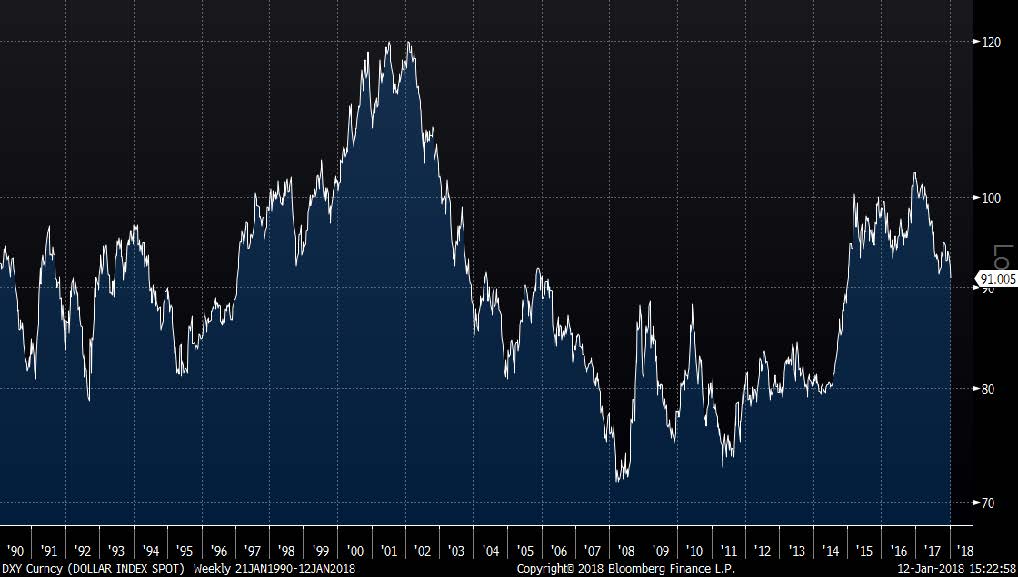
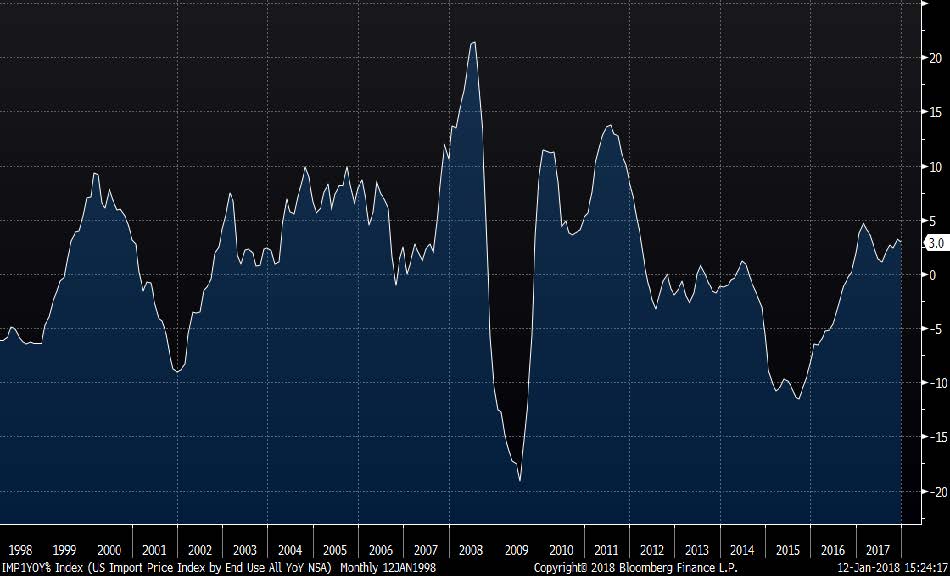
The weakening USD (see Chart 5) could be another contributor to rising prices, especially within the context of the US trade deficit. Although we are among the original subscribers to the American Industrial Renaissance® theme, we strongly doubt that the US manufacturing sector can grow fast enough to alleviate the inflationary combination of a weak currency and a large trade deficit. Goods prices seem bound to increase. In fact, import prices are already in an uptrend (see Chart 6).
CHART 5:
The US Dollar (DXY Index)
(Weekly, Jan. 21, 2000 – Jan. 11, 2018)
CHART 6:
US Import Price Index YoY
(Jan. 1998 – Dec. 2017)
Don’t be an ostrich
Ostriches don’t actually bury their heads in the sand, but bond investors still shouldn’t mimic the myth. Ignoring reality and hoping that the inflationary tendencies that have already significantly constrained bond returns will go away doesn’t seem to us to be a very prudent strategy. Rather, investors should admit that the business cycle is not dead, and the normal late-cycle effects are starting to form.
Accordingly, RBA’s bond allocations remain minimal relative to our portfolios’ guardrails.
INDEX DESCRIPTIONS:
The following descriptions, while believed to be accurate, are in some cases abbreviated versions of more detailed or comprehensive definitions available from the sponsors or originators of the respective indices. Anyone interested in such further details is free to consult each such sponsor’s or originator’s website.
The past performance of an index is not a guarantee of future results.
Each index reflects an unmanaged universe of securities without any deduction for advisory fees or other expenses that would reduce actual returns, as well as the reinvestment of all income and dividends. An actual investment in the securities included in the index would require an investor to incur transaction costs, which would lower the performance results. Indices are not actively managed and investors cannot invest directly in the indices.
S&P 500®: Standard & Poor’s (S&P) 500® Index. The S&P 500® Index is an unmanaged, capitalization-weighted index designed to measure the performance of the broad US economy through changes in the aggregate market value of 500 stocks representing all major industries.
Bonds: The Bloomberg Barclays US Aggregate Bond Index: The Bloomberg Barclays US Aggregate Bond Index is a broad- based benchmark that measures the investment grade, US dollar-denominated, fixed-rate taxable bond market. The index includes Treasuries, government-related and corporate securities, MBS (agency fixed-rate and hybrid ARM pass- throughs), ABS and CMBS (agency and non-agency).
US Dollar: InterContinentalExchange (ICE) US Dollar Index (DXY). The ICE US Dollar Index, indicating the general international value of the USD, averages the exchange rates between the USD and six major world currencies, using rates supplied by some 500 banks.
© Richard Bernstein Advisors LLC
© Richard Bernstein Advisors
Read more commentaries by Richard Bernstein Advisors