SUMMARY
- We maintain a neutral outlook for U.S. commercial real estate prices overall this year, following a 3% to 5% decline from their 2015 peak.
- Nonetheless, we believe select but compelling opportunities will abound as bank regulations, public market dynamics and accelerating changes in demographics and technology continue to drive price dislocations.
- We believe investors should closely monitor real estate investment trusts, foreign capital flows and retail transactions for insight on market conditions.
- It’s critical to look at the market from all angles, pursue diversification and act flexibly with respect to both asset types and capital structure.
Commercial real estate (CRE) markets in the U.S. will likely remain range-bound in 2018, as moderately positive fundamentals are offset by reduced demand from real estate investment trusts (REITs) and overseas buyers. Nonetheless, selective but compelling opportunities abound. Bank regulations, public market dynamics and accelerating changes in demographics and technology will continue to drive dislocations that flexible investors can seek to exploit, as John Murray and Anthony Clarke explain in the following Q&A.
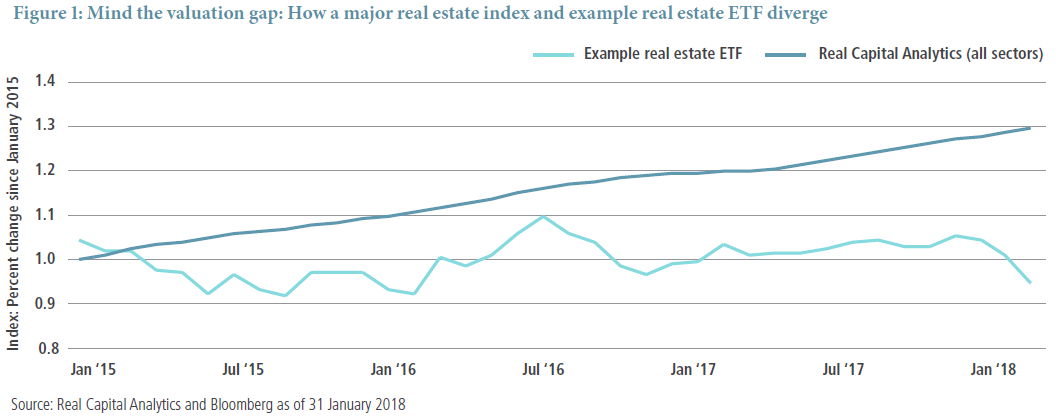
Q: U.S. CRE prices appear to have done well in recent years. According to RCA, values rose 7% in 2017 and 16% over the last two years.1 Do you agree?
A: No, we believe that overall values have fallen by 3% to 5% from their 2015 peak, chiefly due to declining capital flows into major markets and broader pressures in the retail sector. Some major indexes, which can suffer from lags, or perhaps, selection bias, simply don’t show it yet. Figure 1, in fact, shows how an example real estate ETF suggests prices have fallen since 2015, a stark contrast to the RCA Index. In our 2016 article, “U.S. Real Estate: A Storm Is Brewing,” we outlined why U.S. CRE prices would likely fall.
Consider that the volume of transactions greater than $25 million declined 18% in 2017,2 notably a 59% plunge in New York City.3 The falloff reflects a precipitous drop in demand from overseas investors and the withdrawal of real estate investment trusts (REITs) from the market. Given this, it’s hard to think that values have appreciated.
Finally, as we’ve seen at the ground level through our private investment strategies, there are fewer bidders, aside from the industrial sector. As a result, many owners have taken their properties off the market or refinanced, limiting transparency into where prices have really gone in the past two years.

Q: So could a major downturn be on the horizon?
A: While it’s arguably 2008 in parts of the retail sector, we see minimal risk of a broader, 2008-like downturn over the cyclical horizon. The landscape is quite different. Leading up to the financial crisis, buyers accepted lower and lower capitalization rates in anticipation of higher and higher rent growth. Over the past five years, though, buyers have been accepting lower cap rates because of the broader low-yield environment.
Further, even though financing for cash-flowing assets is once again abundant, underwritten loan-to-value (LTV) ratios for commercial mortgage-backed securities (CMBS) remain 10 percentage points lower (roughly 61% versus 71% LTV pre-crisis)4 with generally more stringent standards for determining value today than in the prior peak. In general, borrowers have more equity in their deals. Furthermore, at the end of 2017, closed-end equity funds controlled over $200 billion of dry powder globally, and over $70 billion more than 2008.5 In the event of a surprise sell-off, we believe this pool of capital would provide a floor under prices.
Q: What sectors of the market bear watching?
A: We are monitoring REITs closely, in particular, the continued disconnect between CRE asset values implied by public market REIT prices and values implied by private market transactions and indexes. Most REITs are currently trading at implied discounts of over 10% to their net asset value.6 This is arguably due the public markets’ over-simplified view that higher rates imply commensurate increases in cap rates.
Whether accurate or not, however, the dynamic can become somewhat self-fulfilling with respect to REITs – their implied discounts have turned REITs into net sellers. For perspective, REITs have been net sellers of more than $40 billion of real estate over the past two years.7
Foreign capital flows also are critical. Given Chinese capital controls and shrunken coffers in energy-based economies, foreign transaction volume will likely remain muted or fall further. Foreign capital flows into U.S. CRE were down by about 40% in 2017,8 a significant decline given that foreign capital represented 14% of total deal volume in 20169 and about 30% in New York.10 Chinese purchases have fallen over 66% since 2016, down to $5.9 billion.11 News reports suggest some large Chinese buyers could actually become forced sellers this year, putting even greater pressure on U.S. CRE pricing, particularly in major markets. Of course, there are some wild cards as well, including the recent weakening of the U.S. dollar, which could reignite foreign capital flows. Other country-specific policy changes also could favor U.S. CRE. Japanese institutional investors, for instance, control over $4 trillion12 of capital. Facing domestic yields that are even lower than those in the U.S., some of this capital has begun migrating to the U.S. market.
Finally, the retail transaction space should be monitored closely, especially malls. Many mall owners, including REITs, have sought to sell properties but have been so horribly disappointed by offers that they’ve refused to sell.
We think 2018 will be the year this stalemate ends. Mall REITS face the greatest shareholder pressure to sell assets, as they have been trading at implied discounts of more than 20% to their net asset value implied by private market indexes.13 Further, over the next few years an increasing number of loans will mature and force resolutions in the mall space. For example, in CMBS, over $5 billion of retail loans are expected to mature by year end 2018.14 Given these pressures, we may finally get some transparency into the true clearing level for retail assets.
Q: How are you adjusting your underwriting in light of these dynamics?
A: We are generally underwriting moderate cap rate expansion to varying degrees depending on the underlying asset type. We maintain a modest curve steepening bias. While cap rates are a function of both interest rates and growth expectations, many core office assets have long-term, fixed leases, which don’t directly benefit from rent growth. Thus, rising rates affect values of core office assets more negatively than, say, multifamily assets, where rents can reset with inflation.
Regarding supply and demand fundamentals, we remain increasingly vigilant about the accelerating impact of demographics and disruptive technologies, which are generally negative for the office and retail sectors. For example, the millennial demographic has just become the largest part of the workforce, while baby boomers will leave the workforce at increasing rates. As today’s baby boom generation of decision makers retires, millennials’ preference for creative office layouts with higher densities and greater amenities will accelerate, at the expense of office landlords.
As for disruptive technologies, e-commerce trends have clearly benefited the industrial sector, where rents have jumped by approximately 15% over the last three years15 – whereas mall tenants’ effective rents were roughly flat during the period.16 But advancements in other disruptive technologies, such as driverless vehicles, also present huge impacts to CRE that are only now being assessed.
Finally, on the lending side, whether via CMBS or private loans, we are increasingly vigilant on recapitalizations given the aforementioned paucity of sales and limited transparency into true market values.
Q: So where do you see compelling opportunities?
A: In the debt space, regulation continues to create dislocations. Higher equity prices have made banks more eager to lend, and has led to an increase in year-over-year originations of CMBS. However, regulations such Basel III and the risk retention rules under the Dodd-Frank Act continue to keep banks in a tight credit box that is limited chiefly to cash-flowing, stabilized assets with LTVs below 65%.
Transitional and development assets are prime examples. Banks will generally shy away from lending directly on these types of assets given the higher risk capital charges they incur. The same is true for assets that are underperforming for lenders and face impairment charges. Yet, in select cases, non-bank lenders can indirectly take advantage of the cheap financing banks are offering for properties with low LTVs or positive cash flows. Doing so involves structuring or re-structuring loans into senior and junior tranches and selling the senior tranche to a traditional lender such as a bank or using lending lines that fit within the banks’ regulatory box.
On the private equity side, the retail sector shakeout is creating attractive opportunities. While we expect opportunities to arise in repositioning troubled retail projects into better uses, we’d caution that this can be a lengthy process that may expose investors to secular macroeconomic risks.
We see relatively more attractive, retail-related opportunities in less direct vehicles, such as public market debt or CMBS, where some bonds or derivatives have been dislocated due to their retail exposures. For investor platforms that can understand both the structural complications of CMBS and CMBS derivatives, as well as the underlying credit of the retail and non-retail loans, these sectors can present relatively attractive retail-related investment opportunities.
Finally, we see opportunity on the public equity side. Dislocations between public and private market implied CRE valuations, particularly during market sell-offs such as the nearly 10% plunge earlier this quarter, create opportunities to gain CRE exposure at inherent discounts to underlying asset values. Today, we believe certain REITs have overcorrected and expect that good management teams will increasingly look to bridge the gap between their market capitalizations and the underlying net value of their holdings via asset-specific joint ventures, share buybacks or mergers and acquisitions. From an asset allocation perspective, PIMCO believes REITs offer the potential for positive return along with inflation hedging.
In sum, we believe CRE pricing will remain constrained in 2018. For investors, diversification and flexibility with respect to both asset types and capital structure will remain essential.
1 Real Capital Analytics: https://www.rcanalytics.com/us-prices-2017-cppi/
2 Eastdil Secured 2018 Capital Markets Outlook
3 Eastdil Secured 2018 Capital Markets Outlook
4 Moody’s 2018 CMBS Outlook
5 Eastdil Secured 2018 Capital Markets Outlook
6 Green Street Advisors: Calculated using equal weighting (pricing as of 14 February 2018)
7 Colliers U.S. Research Report: 2017 Midyear Capital Flows
8 Newmark Knight Frank: http://www.ngkf.com/home/research/real-insight/foreign-investment-in-us-commercial-real-estate.aspx
9 Colliers U.S. Research Report: Capital Flows – 2016 Year-End Review and 2017+ Outlook
10 Commercial Observer: https://commercialobserver.com/2017/11/whats-happening-with-chinese-investment-in-new-york-city-commercial-real-estate/
11 Bloomberg: https://www.bloomberg.com/news/articles/2018-01-28/china-ousted-as-asia-s-no-1-buyer-of-u-s-commercial-property
12 Eastdil Secured 2018 Capital Markets Outlook
13 Green Street Advisors (pricing as of 14 February 2018)
14 Bloomberg
15 Green Street Advisors: Industrial Sector Update, 27 November2017
16 Green Street Advisors: Mall Sector Update, 1 December 2017
DISCLOSURES
Past performance is not a guarantee or a reliable indicator of future results.
All investments contain risk and may lose value. Investments in commercial real estate debt and mortgage loans are subject to risks that include prepayment, delinquency, foreclosure, risks of loss, servicing risks and adverse regulatory developments, which risks may be heightened in the case of non-performing loans. Investing in the bond market is subject to risks, including market, interest rate, issuer, credit, inflation risk, and liquidity risk. The value of most bonds and bond strategies are impacted by changes in interest rates. Bonds and bond strategies with longer durations tend to be more sensitive and volatile than those with shorter durations; bond prices generally fall as interest rates rise, and the current low interest rate environment increases this risk. Current reductions in bond counterparty capacity may contribute to decreased market liquidity and increased price volatility. Bond investments may be worth more or less than the original cost when redeemed. Commercial mortgage and asset-backed securities are highly complex instruments that may be sensitive to changes in interest rates and subject to early repayment risk. While generally supported by a government, government-agency or private guarantor, there is no assurance that the guarantor for mortgage and asset-backed securities will meet its obligations. Private equity investments are considered speculative, illiquid, and performance could be volatile, which may increase the risk of investment loss. Equity investments may decline in value due to both real and perceived general market, economic and industry conditions. REITs are subject to risk, such as poor performance by the manager, adverse changes to tax laws or failure to qualify for tax-free pass-through of income. The value of real estate and portfolios that invest in real estate may fluctuate due to: losses from casualty or condemnation, changes in local and general economic conditions, supply and demand, interest rates, property tax rates, regulatory limitations on rents, zoning laws, and operating expenses Derivatives may involve certain costs and risks, such as liquidity, interest rate, market, credit, management and the risk that a position could not be closed when most advantageous. Investing in derivatives could lose more than the amount invested.
Forecasts, estimates and certain information contained herein are based upon proprietary research and should not be interpreted as investment advice, as an offer or solicitation, nor as the purchase or sale of any financial instrument. Statements concerning financial market trends or portfolio strategies are based on current market conditions, which will fluctuate. There is no guarantee that these investment strategies will work under all market conditions or are suitable for all investors and each investor should evaluate their ability to invest for the long term, especially during periods of downturn in the market. Outlook and strategies are subject to change without notice. Investors should consult their investment professional prior to making an investment decision.
This material contains the current opinions of the manager and such opinions are subject to change without notice. This material is distributed for informational purposes only and should not be considered as investment advice or a recommendation of any particular security, strategy or investment product. Information contained herein has been obtained from sources believed to be reliable, but not guaranteed.
PIMCO provides services only to qualified institutions and investors. This is not an offer to any person in any jurisdiction where unlawful or unauthorized. | Pacific Investment Management Company LLC, 650 Newport Center Drive, Newport Beach, CA 92660 is regulated by the United States Securities and Exchange Commission. | PIMCO Europe Ltd(Company No. 2604517) and PIMCO Europe Ltd - Italy (Company No. 07533910969) are authorised and regulated by the Financial Conduct Authority (25 The North Colonnade, Canary Wharf, London E14 5HS) in the UK. The Italy branch is additionally regulated by the Commissione Nazionale per le Società e la Borsa (CONSOB) in accordance with Article 27 of the Italian Consolidated Financial Act. PIMCO Europe Ltd services are available only to professional clients as defined in the Financial Conduct Authority’s Handbook and are not available to individual investors, who should not rely on this communication. | PIMCO Deutschland GmbH (Company No. 192083, Seidlstr. 24-24a, 80335 Munich, Germany), PIMCO Deutschland GmbH Italian Branch (Company No. 10005170963) and PIMCO Deutschland GmbH Swedish Branch (SCRO Reg. No. 516410-9190) are authorised and regulated by the German Federal Financial Supervisory Authority (BaFin) (Marie- Curie-Str. 24-28, 60439 Frankfurt am Main) in Germany in accordance with Section 32 of the German Banking Act (KWG). The Italian Branch and Swedish Branch are additionally supervised by the Commissione Nazionale per le Società e la Borsa (CONSOB) in accordance with Article 27 of the Italian Consolidated Financial Act and the Swedish Financial Supervisory Authority (Finansinspektionen) in accordance with Chapter 25 Sections 12-14 of the Swedish Securities Markets Act, respectively. The services provided by PIMCO Deutschland GmbH are available only to professional clients as defined in Section 67 para. 2 German Securities Trading Act (WpHG). They are not available to individual investors, who should not rely on this communication. | PIMCO (Schweiz) GmbH (registered in Switzerland, Company No. CH-020.4.038.582-2), Brandschenkestrasse 41, 8002 Zurich, Switzerland, Tel: + 41 44 512 49 10. The services provided by PIMCO (Schweiz) GmbH are not available to individual investors, who should not rely on this communication but contact their financial adviser. | PIMCO Asia Pte Ltd (8 Marina View, #30-01, Asia Square Tower 1, Singapore 018960, Registration No. 199804652K) is regulated by the Monetary Authority of Singapore as a holder of a capital markets services licence and an exempt financial adviser. The asset management services and investment products are not available to persons where provision of such services and products is unauthorised. | PIMCO Asia Limited (Suite 2201, 22nd Floor, Two International Finance Centre, No. 8 Finance Street, Central, Hong Kong) is licensed by the Securities and Futures Commission for Types 1, 4 and 9 regulated activities under the Securities and Futures Ordinance. The asset management services and investment products are not available to persons where provision of such services and products is unauthorised. | PIMCO Australia Pty Ltd ABN 54 084 280 508, AFSL 246862 (PIMCO Australia). This publication has been prepared without taking into account the objectives, financial situation or needs of investors. Before making an investment decision, investors should obtain professional advice and consider whether the information contained herein is appropriate having regard to their objectives, financial situation and needs. |PIMCO Japan Ltd (Toranomon Towers Office 18F, 4-1-28, Toranomon, Minato-ku, Tokyo, Japan 105-0001) Financial Instruments Business Registration Number is Director of Kanto Local Finance Bureau (Financial Instruments Firm) No. 382. PIMCO Japan Ltd is a member of Japan Investment Advisers Association and The Investment Trusts Association, Japan. Investment management products and services offered by PIMCO Japan Ltd are offered only to persons within its respective jurisdiction, and are not available to persons where provision of such products or services is unauthorized. Valuations of assets will fluctuate based upon prices of securities and values of derivative transactions in the portfolio, market conditions, interest rates and credit risk, among others. Investments in foreign currency denominated assets will be affected by foreign exchange rates. There is no guarantee that the principal amount of the investment will be preserved, or that a certain return will be realized; the investment could suffer a loss. All profits and losses incur to the investor. The amounts, maximum amounts and calculation methodologies of each type of fee and expense and their total amounts will vary depending on the investment strategy, the status of investment performance, period of management and outstanding balance of assets and thus such fees and expenses cannot be set forth herein.| PIMCO Canada Corp. (199 Bay Street, Suite 2050, Commerce Court Station, P.O. Box 363, Toronto, ON, M5L 1G2) services and products may only be available in certain provinces or territories of Canada and only through dealers authorized for that purpose. | No part of this publication may be reproduced in any form, or referred to in any other publication, without express written permission. PIMCO is a trademark of Allianz Asset Management of America L.P. in the United States and throughout the world.
©2018, PIMCO.
57234
CMR2018-0221-318171
© PIMCO
Read more commentaries by PIMCO