Ignore the Tweet, Invest for the Meat
Membership required
Membership is now required to use this feature. To learn more:
View Membership Benefits
We wrote a white paper in November 2014 titled “Tired of being scared yet? ”. We outlined 50 different topics investors consistently cited at the time as to why the stock market was very risky. Investors’ fear over the past several years led to near-historic flows into bond ETFs and bond mutual funds and, until more recently, outflows from equities. However, the S&P 500® returned 10.2% per year versus bonds’ 1.5% from November 2014 to May 2018 (see Chart 1).
Investment decisions should not be based on whether there are reasons to be scared because there are always reasons to be scared. Rather, investors must assess potential returns versus that ever- present fear. Successful financial investment and corporate capital investment has always depended on insightful risk/return analysis.
CHART 1:
S&P 500® vs. Bloomberg Barclays US Bond Aggregate
Nov 30, 2014 – May 31, 2018
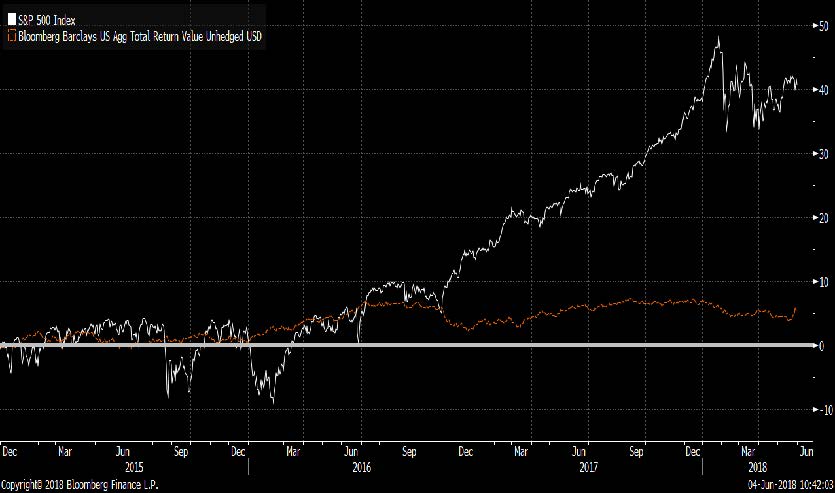
Source: Bloomberg Finance L.P. For Index descriptors, see "Index Descriptions" at end of document.
Today, investors seem bombarded with a daily flow of “hair on fire” events. Whether it is trade, international relations, oil, emerging market problems, interest rates, or many other issues, it has become extraordinarily difficult for investors to sift through the incessant noise to uncover true investment information.
Reading Twitter posts and reacting to every news event every day seems to us at RBA to be a sure route to investment underperformance. We prefer to stay disciplined and dispassionate, and invest based on fundamentals rather than noise.
One antidote for noise
It seems hackneyed to suggest that longer investment time horizons are beneficial to investment returns. However, it is true. The data clearly show that rapid-fire trading leads to inferior performance. Chart 2 shows the probability of a negative return for the S&P 500® for varying time horizons. The probability of losing money uniformly decreases for each longer time horizon.
CHART 2:
Probability of a Loss for the S&P 500®
(Rolling Price Returns, Jan.1930 thru May 2018)

Source: Richard Bernstein Advisors LLC, Standard and Poor's, Bloomberg Finance L.P.
Economies simply don’t change day by day. Therefore, risk decreases as one extends investment time horizons probably because longer time horizons allow fundamentals to develop, whereas short-term investing is largely based on meaningless noise.
Chart 3 compares the performance of “event-driven” strategies to that of global equities.Over the last five years, event-driven strategies have returned 1.2% per year versus the MSCI All Country World Index (ACWI) return of 9.5% per year. Chasing events certainly hasn’t been an outperforming strategy.
One might suggest that event-driven strategies protect against down markets. While that might indeed be true, Chart 2 pointed out that stocks provide negative returns only 31% of one-year periods and only 20% of five-year periods. One needs to remember that overall fundamentals improve more often than they deteriorate.
CHART 3:
HFRI Event Driven Index vs. MSCI ACWI Index
May 31, 2013 – May 31, 2018
Source: Bloomberg Finance L.P. For Index descriptors, see "Index Descriptions" at end of document.
Ignore the tweet. Invest for the meat.
Watching daily events unfold is always mesmerizing, but the data show that it is extraordinarily difficult to invest fruitfully attempting to time short-term events. At RBA, we try to stay dispassionate and disciplined and we extend our investment time horizons because the meat of the investment matter is fundamentals and not the hair-on-fire event of the day.
INDEX DESCRIPTIONS:
The following descriptions, while believed to be accurate, are in some cases abbreviated versions of more detailed or comprehensive definitions available from the sponsors or originators of the respective indices. Anyone interested in such further details is free to consult each such sponsor’s or originator’s website.
The past performance of an index is not a guarantee of future results.
Each index reflects an unmanaged universe of securities without any deduction for advisory fees or other expenses that would reduce actual returns, as well as the reinvestment of all income and dividends. An actual investment in the securities included in the index would require an investor to incur transaction costs, which would lower the performance results. Indices are not actively managed and investors cannot invest directly in the indices.
MSCI All Country World Index (ACWI®): The MSCI ACWI® Index is a widely recognized, free-float-adjusted, market-capitalization-weighted index designed to measure the equity-market performance of global developed and emerging markets.
S&P 500®: Standard & Poor’s (S&P) 500® Index. The S&P 500® Index is an unmanaged, capitalization-weighted index designed to measure the performance of the broad US economy through changes in the aggregate market value of 500 stocks representing all major industries.
Hedge Fund Research HFRI Event Driven (Total) Index: Hedge Fund Research HFRI Event Driven (Total) Index: Investment Managers who maintain positions in companies currently or prospectively involved in corporate transactions of a wide variety including but not limited to mergers, restructurings, financial distress, tender offers, shareholder buybacks, debt exchanges, security issuance or other capital structure adjustments. Security types can range from most senior in the capital structure to most junior or subordinated, and frequently involve additional derivative securities. Event Driven exposure includes a combination of sensitivities to equity markets, credit markets and idiosyncratic, company specific developments. Investment theses are typically predicated on fundamental characteristics (as opposed to quantitative), with the realization of the thesis predicated on a specific development exogenous to the existing capital structure.
Bloomberg Barclays US Aggregate Bond Index: The Bloomberg Barclays US Aggregate Bond Index is a broad-based flagship benchmark that measures the investment grade, US dollar- denominated, fixed-rate taxable bond market. The index includes Treasuries, government-related and corporate securities, MBS (agency fixed-rate and hybrid ARM pass-throughs), ABS and CMBS (agency and non-agency).
© Copyright 2018 Richard Bernstein Advisors LLC. All rights reserved. PAST PERFORMANCE IS NO GUARANTEE OF FUTURE RESULTS
Nothing contained herein constitutes tax, legal, insurance or investment advice, or the recommendation of or an offer to sell, or the solicitation of an offer to buy or invest in any investment product, vehicle, service or instrument. Such an offer or solicitation may only be made by delivery to a prospective investor of formal offering materials, including subscription or account documents or forms, which include detailed discussions of the terms of the respective product, vehicle, service or instrument, including the principal risk factors that might impact such a purchase or investment, and which should be reviewed carefully by any such investor before making the decision to invest. Links to appearances and articles by Richard Bernstein, whether in the press, on television or otherwise, are provided for informational purposes only and in no way should be considered a recommendation of any particular investment product, vehicle, service or instrument or the rendering of investment advice, which must always be evaluated by a prospective investor in consultation with his or her own financial adviser and in light of his or her own circumstances, including the investor’s investment horizon, appetite for risk, and ability to withstand a potential loss of some or all of an investment’s value. Investing is subject to market risks. Investors acknowledge and accept the potential loss of some or all of an investment’s value. Past performance is, of course, no guarantee of future results. Views represented are subject to change at the sole discretion of Richard Bernstein Advisors LLC. Richard Bernstein Advisors LLC does not undertake to advise you of any changes in the views expressed herein. w
Membership required
Membership is now required to use this feature. To learn more:
View Membership BenefitsSponsored Content
Upcoming Virtual Events View All


