Overheating Ahead
Membership required
Membership is now required to use this feature. To learn more:
View Membership BenefitsThe economy by itself is heading for higher inflation
Current US economic fundamentals suggest our portfolios remain correctly focused on assets that benefit from higher inflation. Late-cycle environments are generally characterized by rising inflation, and the current late-cycle is so far mimicking history. Chart 1 shows the increasing year-to-year change in the core and headline CPIs over the past year. The headline CPI is up 65% whereas the more stable core measure is up roughly one-third.
A late-cycle increase in inflation is normal. Product and labor markets tend to tighten, and delays and shortages become more common as increasing activity strains the limits of the economy. It took longer than normal for the recent US economy to reach these late-stage constraints because of the slow growth trajectory of the recovery and expansion. However, the business cycle has not been repealed, and inflation has been building as it always does during late-cycles.
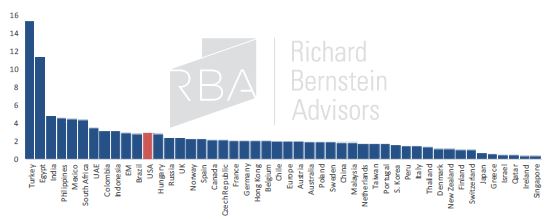
Investors appear unaware of how high US inflation already is relative to inflation rates around the world. Chart 2 shows that the US currently has the highest inflation rate in the world among developed nations.
CHART 1:
Core CPI and CPI YoY
(Jun. 2017 – May 2018)
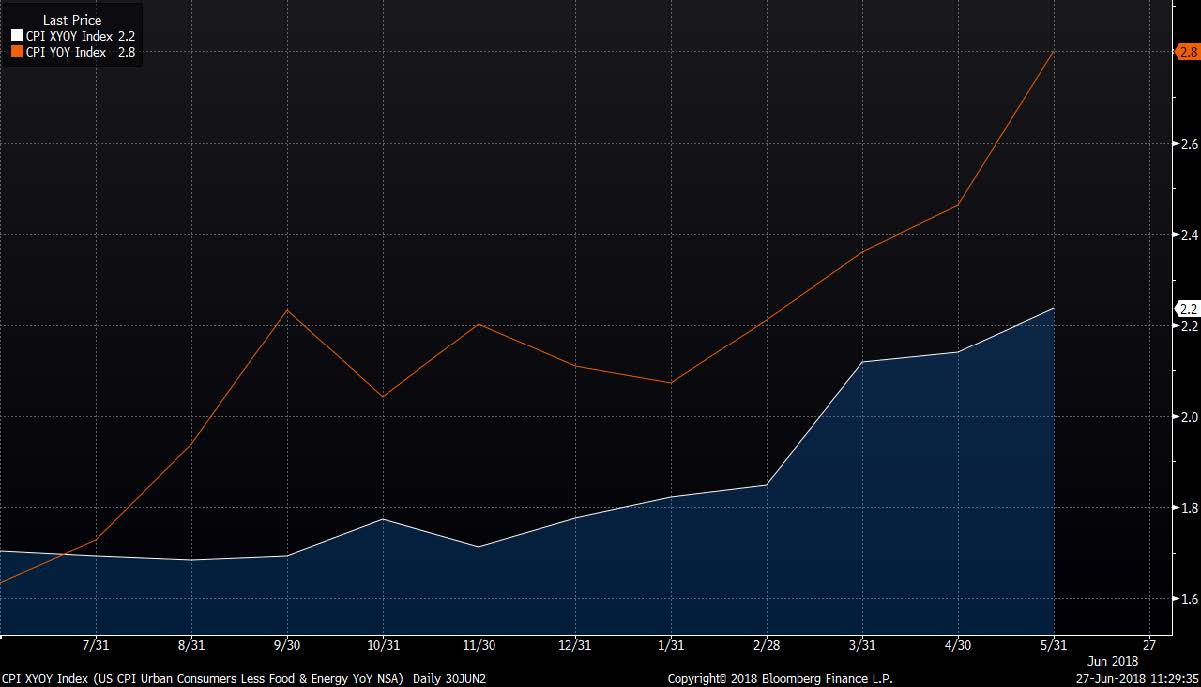
CHART 2:
Global CPI % YoY
(Latest Available as of Jun. 30 2018)
Source: Richard Bernstein Advisors LLC, Standard and Poor's, Bloomberg Finance L.P.
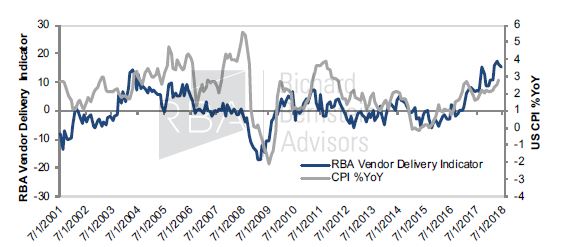
The limits of the US economy are quickly becoming evident. Product and labor markets have become extremely tight. Chart 3 shows our proprietary measure of vendor delivery time (i.e., how long does it take for a commercial order to be delivered). Longer vendor delivery times suggest demand is outstripping supply, and prices rise when demand is greater than supply. Vendor delivery times are not only lengthening, but are currently among the longest in the history of our data.
CHART 3:
US CPI % YoY vs. RBA Vendor Delivery Indicator
(Jul. 2001 - Jun. 2018)
Source: Richard Bernstein Advisors LLC, FRB, Bloomberg Finance L.P.
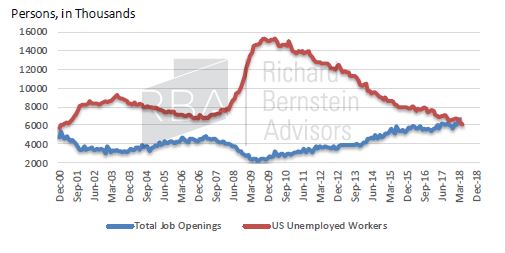
There simply isn’t enough available skilled labor within the US economy. Chart 4 demonstrates that job openings are now the best in the history of the data. Labor markets are like any other product market, and the price of labor (i.e., wages) generally increases when the demand for labor outstrips the supply. Anecdotal evidence regarding labor union activity also reflects the current tightness of the labor market. Workers typically don’t form unions and strike when they are worried about job security. However, union power is apparently gaining as workers realize replacement workers are very difficult to find.
CHART 4:
Job Openings vs. Job Seekers
(Dec. 2000 – Apr. 2018)
Source: Richard Bernstein Advisors LLC. BLS, Bloomberg Finance L.P. For Index descriptors, see "Index Descriptions" at end of document
Public policy is currently very pro-inflation
Public policy has become a difficult topic about which to discuss. Emotions run high these days, which means that investors must be even more dispassionate and objective when assessing investment opportunities. As mentioned in earlier commentary, RBA tries to solely focus on the investment implications of policy. We are not, in the comments that follow, expressing an opinion that policies are appropriate or not.
Typically, the government uses fiscal stimulus and deficit spending as tools to ameliorate a recession and not to further stimulate the economy during the 9th year of an economic expansion. It is somewhat surprising to us that investors seem more caught up in the political hype of fiscal stimulus than in assessing the investment implications of injecting significant stimulus into a late-cycle economy. It also appears to us as though public policies will exacerbate the late cycle’s bottlenecks, which could further spur inflation. We have considered the inflation potential caused by each of the following policies:
1. Government spending and tax cuts
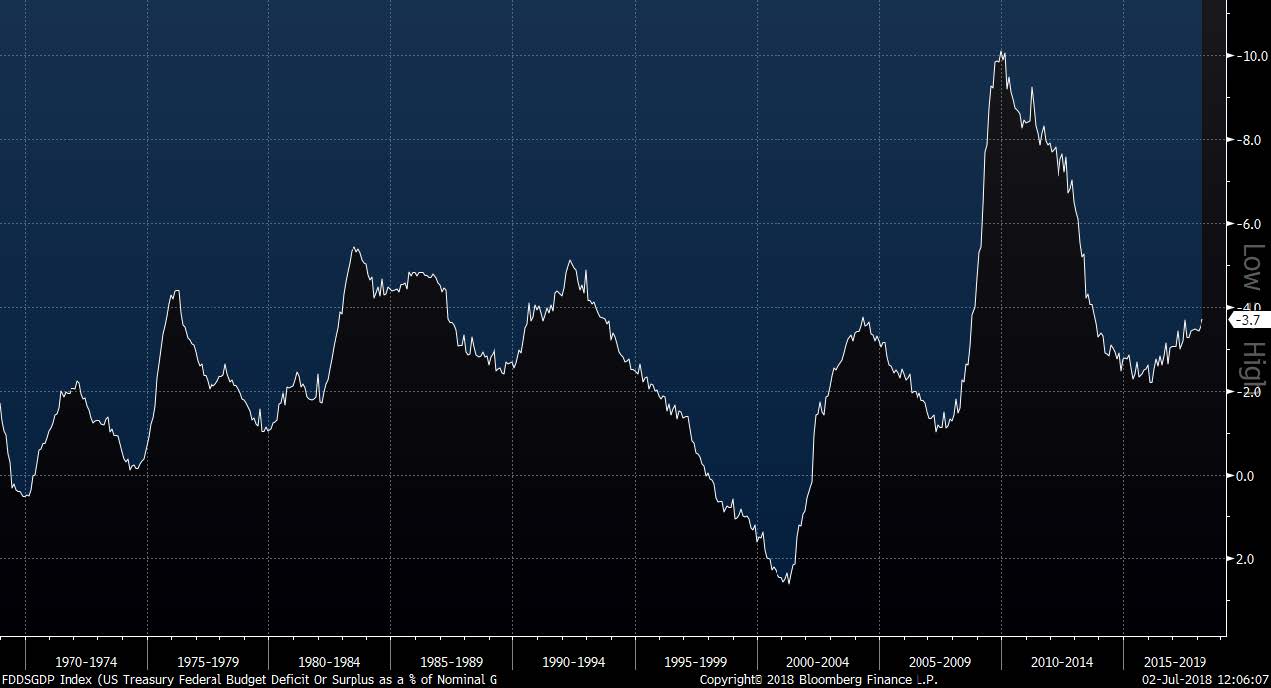
Both federal and state & local government spending is increasing. Evercore ISI has estimated that spending by the largest states is now rising roughly 6% year-to-year. The federal deficit as a percent of GDP is growing again after decreasing for about six years. Most important, Chart 5 shows that deficits normally contract during latter stages of an economic cycle, but the deficit is increasing during the current late-cycle. Stimulating a late-cycle economy with local, state, and federal stimulus seems likely to overheat an already tight economy and cause inflation that may be significantly higher than most investors are currently forecasting.
CHART 5:
Federal Budget Deficit or Surplus as a % of Nominal GDP
(Dec. 1968 – Mar. 2018)
 Source: Richard Bernstein Advisors LLC. US Treasury, BEA, Bloomberg Finance L.P.
2. Tariffs
Tariffs, by definition, are always inflationary because they are supposed to negate competitive advantage (whether fair or unfair) by taxing imported lower priced products so that those products’ prices are equal to higher priced domestic ones. Price increases could prove temporary if a tariff’s higher prices stymie demand, but that is less likely to happen now because the underlying economy is quite strong. Because product markets are already tight, tariffs’ impeded flow of goods and services could worsen existing shortages and extended delivery times.
3. Immigration
Of course, one should always want thorough, consistent, and meaningful immigration standards. However, US labor markets are tight, and current immigration discussions are not addressing the need within the US economy for additional labor. Current public policy seemingly ignores that the price of labor (i.e., wages) is already rising because of the growing scarcity of available qualified workers. Labor shortages could easily worsen given the stimulus previously mentioned, but immigration seems unlikely to alleviate even a dramatic labor shortage that could occur.
4. Iran & Oil
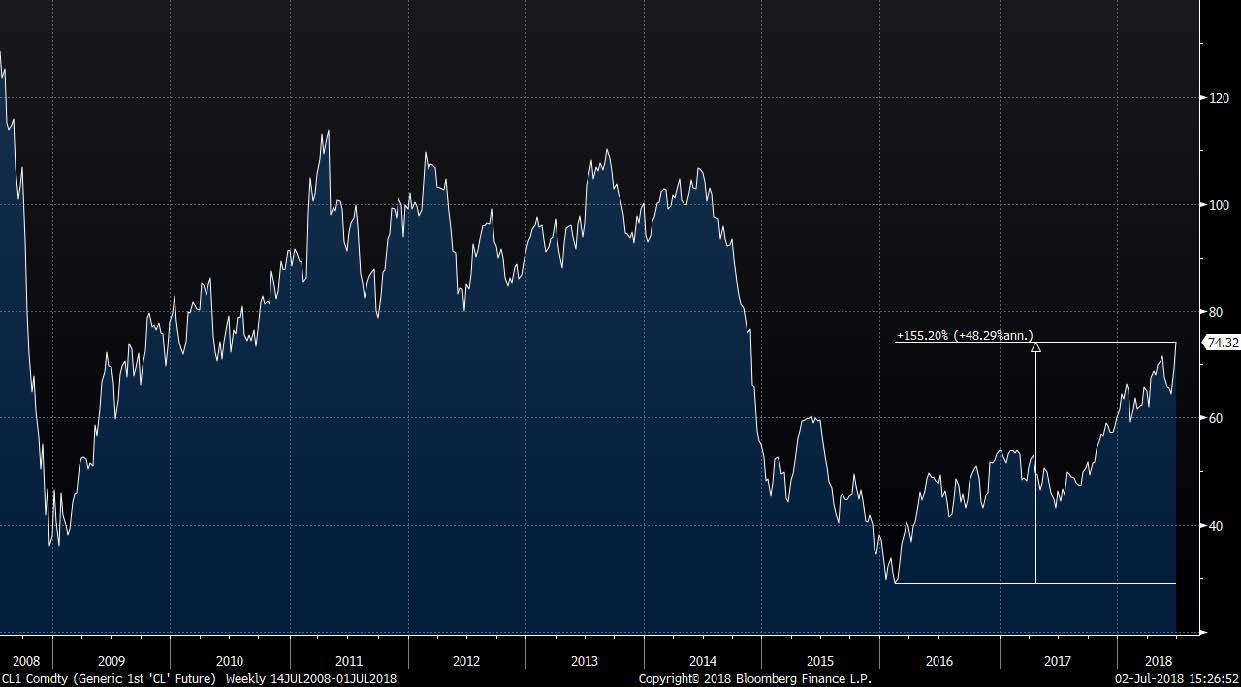
One could agree or disagree with the recent positions on Iran. However, oil supplies could be significantly constrained. Chart 6 highlights that oil prices (WTI) have more than doubled since early 2016 largely because of an improving economy. The combination of additional supply restrictions and a strong economy will likely further increase prices.
According to Cornerstone Analytics, a leading independent energy research firm, OPEC does not have enough spare capacity to make up for a full reduction in Iranian exports and non-OPEC production is running near full capacity. If their analysis is correct, then any supply constraints could result in meaningful higher prices.
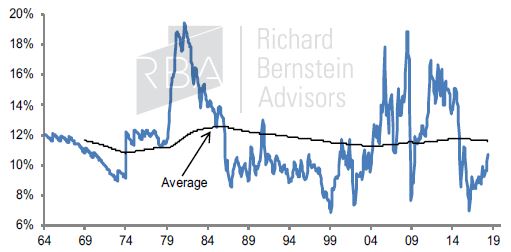
One should not assume that an increase in energy prices might be temporary. Energy prices would likely have to substantially increase before damaging the US economy. Chart 7 shows gasoline prices as a percent of hourly wages, and the significant increases in gasoline prices so far has equated to a relatively small proportion of wages.
CHART 6:
Weekly Oil (WTI) Prices
(Jul. 14 2008 – Jul. 1 2018)
 Source: Richard Bernstein Advisors LLC. Bloomberg Finance L.P.
CHART 7:
Price of a Gallon of Gas as a % of Wages
(Jan. 1964 – Jun. 2018)
 Source: Richard Bernstein Advisors LLC. US EIA, BLS, Bloomberg Finance L.P.
Our positioning for nominal growth still appears unique
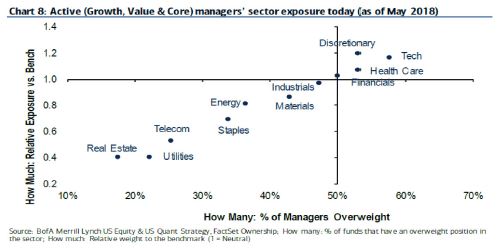
Significant investment opportunities may still exist in sectors that benefit from nominal growth. The chart below, courtesy of BofAML1, highlights that the majority of equity managers are underweighting the sectors that might benefit the most from accelerating nominal growth (Energy, Materials, and Industrials).
Similarly, a recent study by Evercore ISI2 noted that bond portfolio managers had lowered their portfolios’ durations by only a small amount in anticipation of higher interest rates. The latest data suggested that, in aggregate, bond portfolio managers were roughly 92% of benchmark duration versus RBA’s roughly 25-30% of benchmark duration. Overall, both our equity and fixed-income positions seem unique.
CHART 8:
Equity Managers underweight Energy, Materials & Industrials
It is unfortunate that so many investors are enthralled with Washington’s political show rather than remaining dispassionate and objective. At RBA our analyses suggest that accelerating nominal growth may be the next important investment theme, and few investors appear to be appropriately positioned should that occur.
1 Active managers’ holdings update, July 02, 2018, BofAML
2 Evercore ISI Investor Surveys|Institutional Bond and Equity Managers, June 27, 2018
INDEX DESCRIPTIONS:
The following descriptions, while believed to be accurate, are in some cases abbreviated versions of more detailed or comprehensive definitions available from the sponsors or originators of the respective indices. Anyone interested in such further details is free to consult each such sponsor’s or originator’s website.
The past performance of an index is not a guarantee of future results.
Each index reflects an unmanaged universe of securities without any deduction for advisory fees or other expenses that would reduce actual returns, as well as the reinvestment of all income and dividends. An actual investment in the securities included in the index would require an investor to incur transaction costs, which would lower the performance results. Indices are not actively managed and investors cannot invest directly in the indices.
CPI: The Consumer prices (CPI) for all Urban Consumers are a measure of prices paid by consumers for a market basket of consumer goods and services. The yearly (or monthly) growth rates represent the inflation rate.
Core CPI : Core Consumer prices are a measure of prices paid by consumers for a market basket of consumer goods and services excluding the Food and Energy categories. The yearly (or monthly) growth rates represent the core inflation rate.
Job Openings: Job Openings and Labor Turnover Survey (JOLTS). JOLTS defines Job Openings as all positions that are open (not filled) on the last business day of the month. A job is "open" only if it meets all three of the following conditions: A specific position exists and there is work available for that position. The position can be full-time or part-time, and it can be permanent, short-term, or seasonal, and The job could start within 30 days, whether or not the establishment finds a suitable candidate during that time, and There is active recruiting for workers from outside the establishment location that has the opening.
Job Seekers: Number of persons unemployed as reported monthly by the Bureau of Labor Statistics (BLS). Data is based on the Current Population Survey (CPS) to measure the extent of unemployment in the country. People are classified as unemployed if they do not have a job, have actively looked for work in the prior 4 weeks, and are currently available for work.
© Copyright 2018 Richard Bernstein Advisors LLC. All rights reserved. PAST PERFORMANCE IS NO GUARANTEE OF FUTURE RESULTS
Nothing contained herein constitutes tax, legal, insurance or investment advice, or the recommendation of or an offer to sell, or the solicitation of an offer to buy or invest in any investment product, vehicle, service or instrument. Such an offer or solicitation may only be made by delivery to a prospective investor of formal offering materials, including subscription or account documents or forms, which include detailed discussions of the terms of the respective product, vehicle, service or instrument, including the principal risk factors that might impact such a purchase or investment, and which should be reviewed carefully by any such investor before making the decision to invest. Links to appearances and articles by Richard Bernstein, whether in the press, on television or otherwise, are provided for informational purposes only and in no way should be considered a recommendation of any particular investment product, vehicle, service or instrument or the rendering of investment advice, which must always be evaluated by a prospective investor in consultation with his or her own financial adviser and in light of his or her own circumstances, including the investor’s investment horizon, appetite for risk, and ability to withstand a potential loss of some or all of an investment’s value. Investing is subject to market risks. Investors acknowledge and accept the potential loss of some or all of an investment’s value. Past performance is, of course, no guarantee of future results. Views represented are subject to change at the sole discretion of Richard Bernstein Advisors LLC. Richard Bernstein Advisors LLC does not undertake to advise you of any changes in the views expressed herein.
Membership required
Membership is now required to use this feature. To learn more:
View Membership BenefitsSponsored Content
Upcoming Virtual Events View All


