The ubiquitous word within 2019 outlook reports surely must be “uncertainty.” Whereas there are many uncertainties regarding 2019’s financial markets, there are also opportunities that we see emerging because of investors’ widespread, growing, and, in some cases, irrational fears.
We divide this year’s Year Ahead report into two parts. Part I discusses the roots of so much uncertainty and tries to dispassionately identify whether investors’ current level of fear is justified. Part II, which will be published in January, will focus on the opportunities in which we’ve invested.
Sentiment: Investors—and corporations—continue to be very skittish
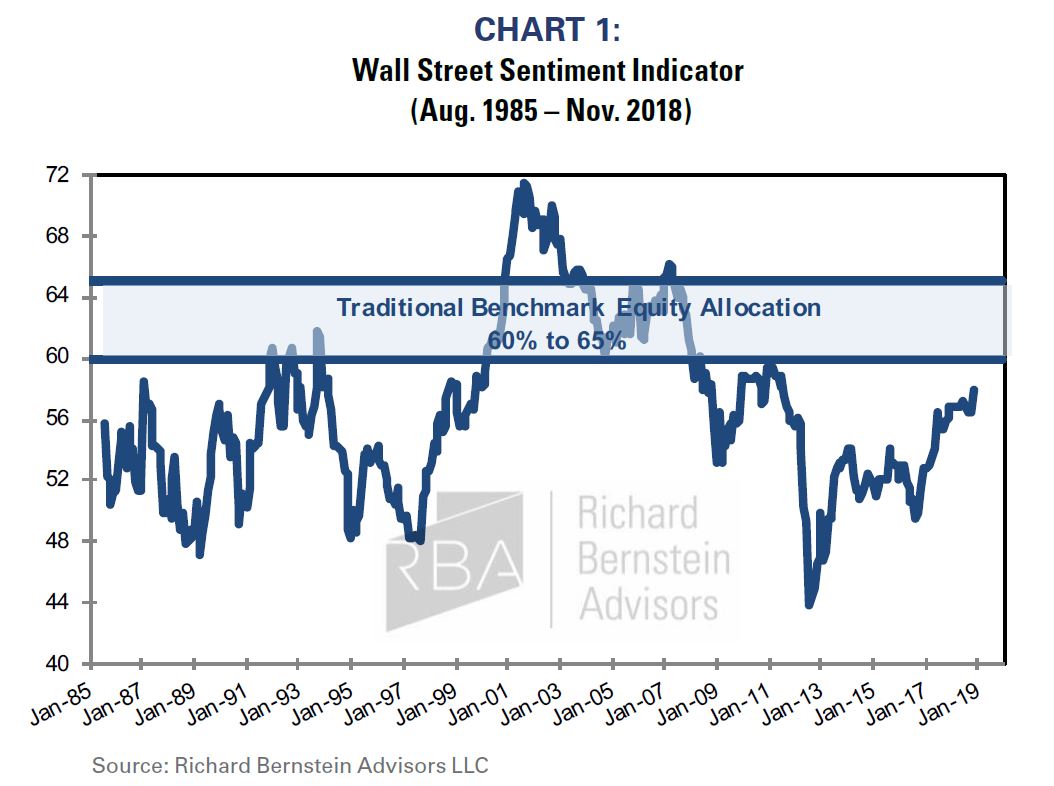
2008’s bear market generationally scarred investors, and a broad range of data clearly show that portfolio positioning has significantly changed from pre-2008 allocations. Since 2008, individuals have focused on income rather than capital appreciation, and institutional portfolios now regularly include allocations to “absolute return”, “hybrid”, and “independent return” at the expense of public equity. Chart 1 highlights that Wall Street has similarly recommended an underweight of public equity throughout the bull market despite that public equities have been an outperforming asset class.

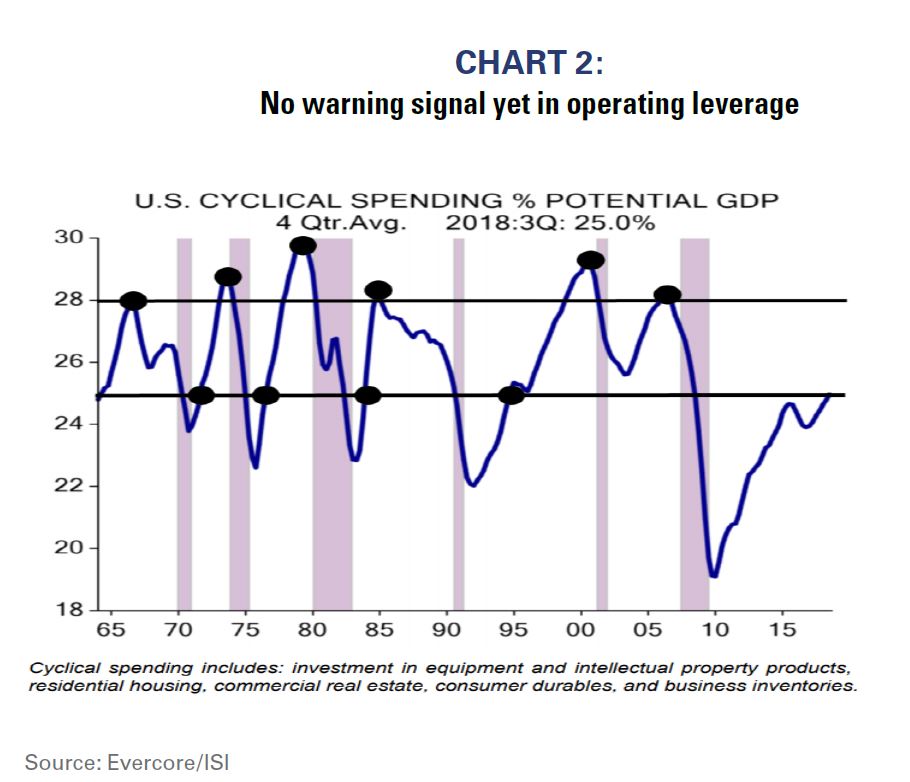
2008’s recession also scarred corporate planning. Investors seem to view the stock market as a unique entity, and forget that the stock market actually reflects the real economy. Investors get heady at the peak of a bull market, but so do households and corporations. Investors tend to be the most confident and add risk to their portfolios toward the end of a bull market, and history shows that households and companies tend to add risk to their balance sheets toward the end of an economic cycle. For example, companies’ operating leverage usually grows during a late-cycle environment, and that added business sensitivity subsequently accentuates a downturn.
Chart 2, courtesy of Evercore/ISI, shows that households and companies have not yet added unusual amounts of operating leverage to their balance sheets. The chart shows capital investment as a percent of potential GDP, and corporate and household capital spending trends do not seem to be sending a warning signal regarding potential excesses in the overall economy.
Liquidity is drying up, but not excessively so
Central banks remove liquidity from the economy during every late-cycle period, and the current tightening by the Fed seems normal within that context. Bull markets, however, don’t usually end when the Fed removes liquidity. Rather, they end when the Fed removes too much liquidity from the economy.
An inverted yield curve (short-term interest rates higher than longer- term ones) has historically been a reliable signal that the Fed has removed too much liquidity from the economy. Short-term interest rates move above longer-term rates as the markets begin to assess that future growth will be considerably slower than near-term economic growth. An inverted curve itself contributes to a slowdown as it stymies lending because the short-term cost of deposits becomes greater than the longer-term return from making loans.
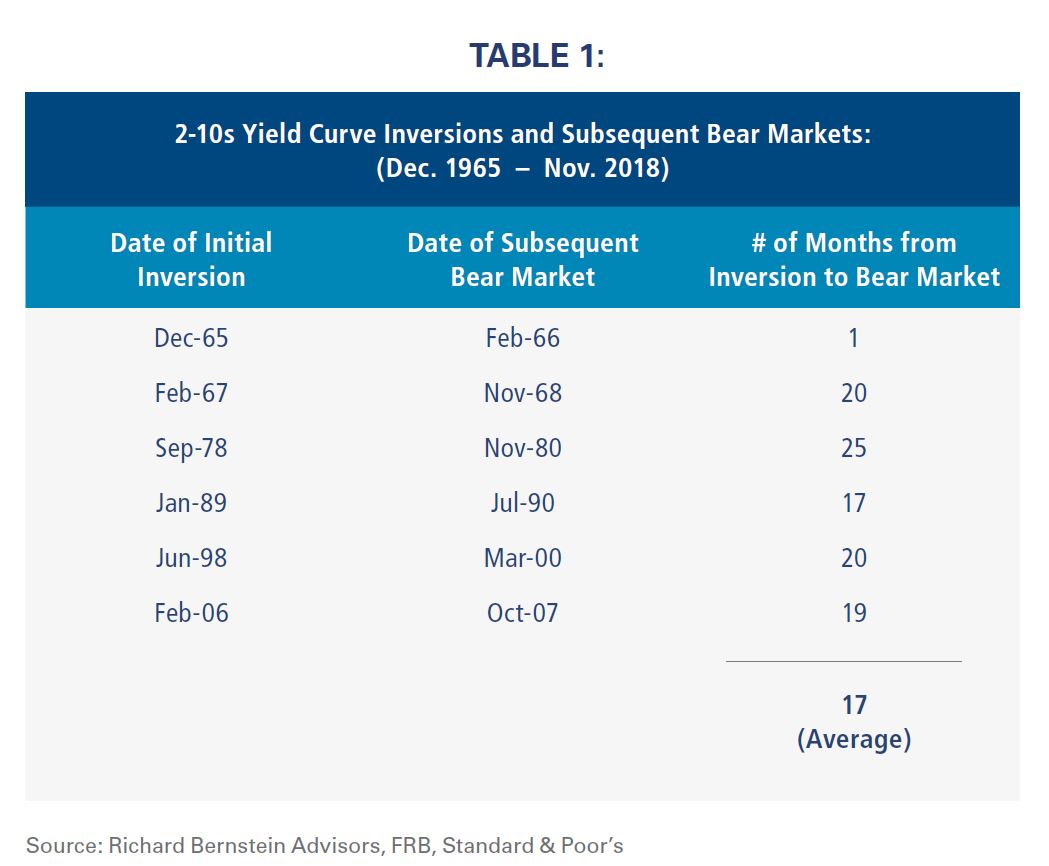
Investors are today focused on the yield curve because of the narrow spread between the 2-year note and 10-year note. Investors’ current fixation with the yield curve is extraordinarily unusual and may be another symptom of 2008’s market scarring investors because investors typically don’t pay attention to late-cycle yield curves despite the curve’s inversions and warning signs. However, investors are ignoring the yield curve’s lead time relative to bear markets. Table 1 shows that bear markets start on average about 17 months after the 2-to-10-year yield curve inverts.
Investors today also appear overly concerned that the Fed might preemptively curtail the current cycle despite the long history that demonstrates that such pro-active policies are quite unlikely. The Federal Reserve, except during the Volker era, has consistently been a lagging indicator of economic activity. The Fed reacts to data rather than anticipates it, but many have suggested the current market volatility is attributable to the Fed’s preemptive stance. Blaming the Fed for the markets’ ongoing volatility seems convenient but unjustified.
Corporate profits are still healthy
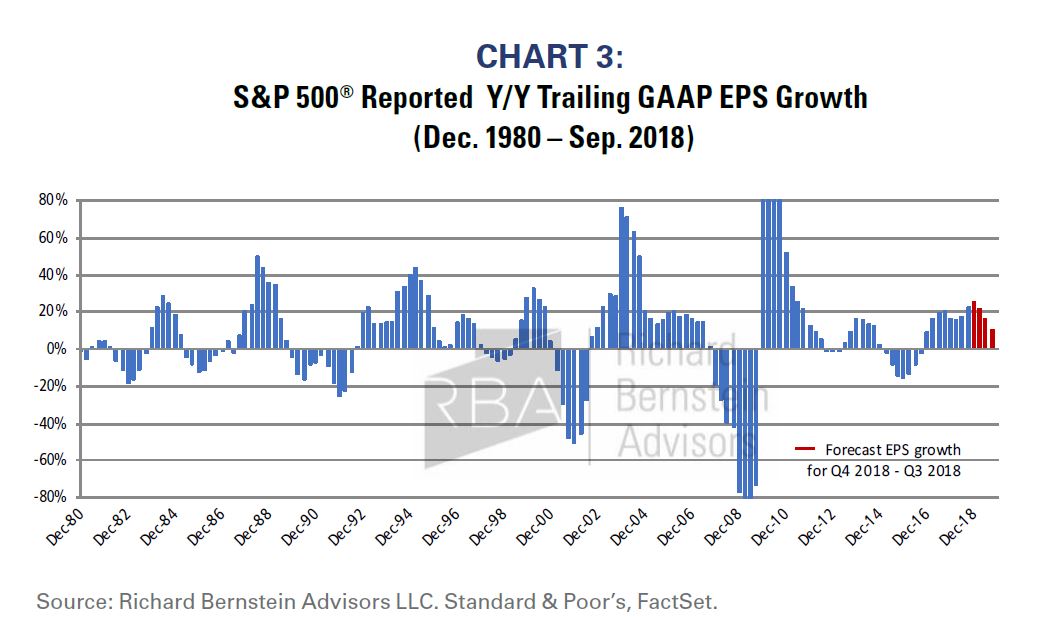
Profits recessions (multiple quarters of negative earnings growth) are one of the primary drivers of bear markets. RBA does see corporate profits growth slowing in 2019, but we do not see an imminent profits recession. Chart 3 shows the US profits cycle (based on reported GAAP EPS). 3Q18 profits growth looks to be about 22%, and our forecast for 4Q18 is about 24%. We think profits growth will slow, but remain healthy during 2019, and our current forecast for 3Q19 is 10%.
So why the anxiety?
Fundamentals, primarily earnings and liquidity, seem to be following their normal late-cycle paths. Sentiment still appears unusually scarred and wary. None of these factors would suggest the levels of volatility that are in the markets.
The prime sources of uncertainty for investors, in our view, are trade policy, tariffs, inconsistent foreign policy, and the frequency and impulsive nature of decisions that impact economic growth. Planning is normally difficult for corporations, but CFOs trying to plan employment and capital investment for 2019 must be having an unusually challenging time. It seems exceptionally difficult to assess credit risk when a borrowers’ input costs could be up 25% or down 10% and their export growth and market share could potentially be eroded by foreign retaliatory tariffs. Consumer confidence remains high, but leading indicators of employment seem to be losing some strength. How does a CFO plan capital allocation, how does a credit analyst assess risk, how does an investor assess profit margins, and how does a factory employee buy a car or a home when 2019’s economy could dramatically change with the stroke of a tweet?
The cause of market volatility does not appear to be primarily attributable to traditional fundamental variables such as profits or Fed policy. Those factors are following very normal late-cycle paths. It is much more likely that market volatility is increasing because household and corporate planning has become nearly impossible in a highly capricious political environment.
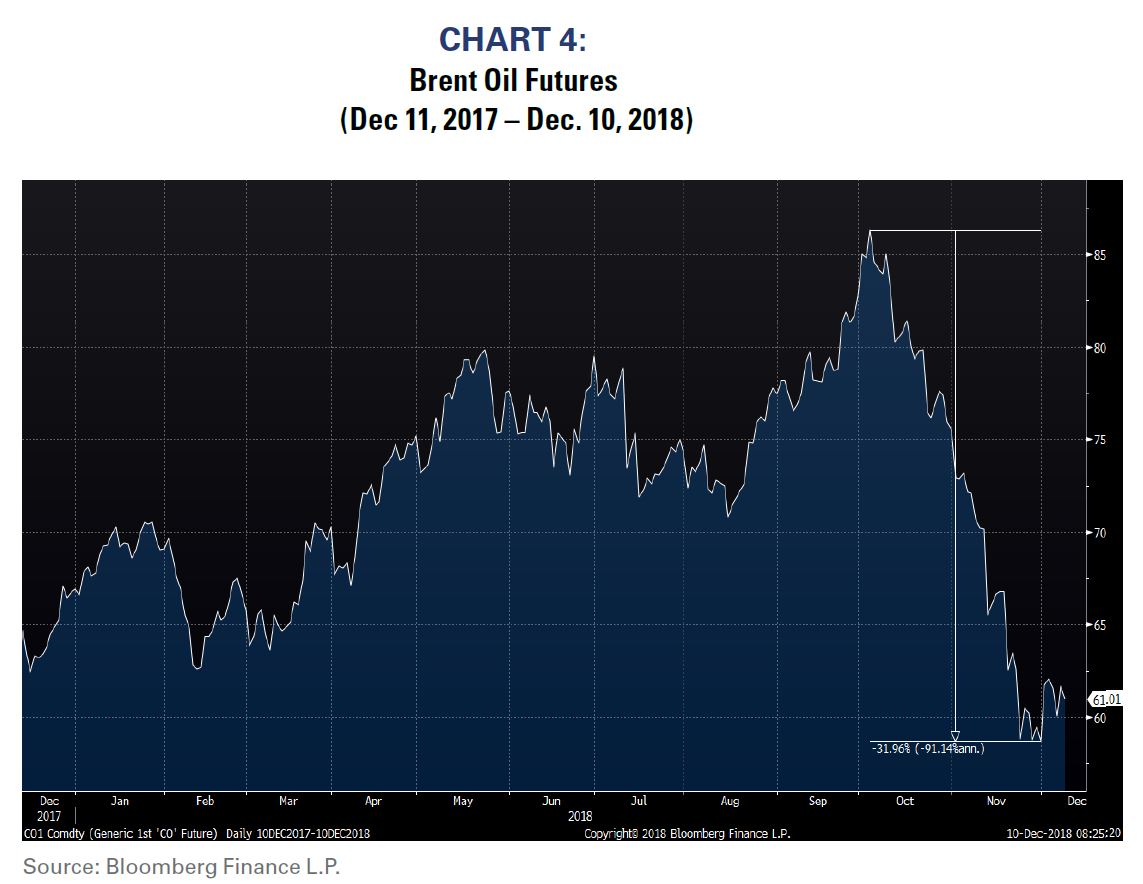
RBA prides itself on being dispassionate about our politics. Politics is about what should be, but investing is about what is. Our views regarding the causes of market volatility are not political. In fact, the recent volatility in the oil market strongly supports our contentions. Oil prices rose meaningfully when Washington claimed there would be significant oil sanctions against Iran, and energy producers were encouraged to plan for higher prices. Washington then granted sanctions to Iran’s biggest oil customers which caused more than a 30% collapse in oil prices (see Chart 4). Energy sector CEOs and CFOs who planned for reduced supply and higher prices were suddenly faced with oversupply, excess capacity, and falling prices.
It’s not all bad because politicians are still politicians.
One must remember that politicians are still politicians, and politicians typically have only one goal: get re-elected. Keeping that in mind, investors should keep their wits and realize there may be plenty of investment opportunities resulting from today’s uniquely unpredictable environment. In January, we’ll investigate those investment opportunities for 2019.
INDEX DESCRIPTIONS:
The following descriptions, while believed to be accurate, are in some cases abbreviated versions of more detailed or comprehensive definitions available from the sponsors or originators of the respective indices. Anyone interested in such further details is free to consult each such sponsor’s or originator’s website.
The past performance of an index is not a guarantee of future results.
Each index reflects an unmanaged universe of securities without any deduction for advisory fees or other expenses that would reduce actual returns, as well as the reinvestment of all income and dividends. An actual investment in the securities included in the index would require an investor to incur transaction costs, which would lower the performance results. Indices are not actively managed and investors cannot invest directly in the indices.
S&P 500®: Standard & Poor’s (S&P) 500® Index:
The S&P 500® Index is an unmanaged, capitalization-weighted index designed to measure the performance of the broad US economy through changes in the aggregate market value of 500 stocks representing all major industries.
Brent Oil Futures: The ICE Futures Europe Commodities Generic 1st CO Future:
Current pipeline export quality Brent blend as supplied at Sullom Voe. ICE Brent Futures is a deliverable contract based on EFP delivery with an option to cash settle. Date of launch: 23 June 1988. Unit of trading: One or more lots of 1,000 net barrels (42,000 US gallons) of Brent crude oil. Quotation: The contract price is in US dollars and cents per barrel. Trading period: A maximum of 72 consecutive months will be listed. Thereafter, the exchange will list an additional six contracts comprising of June and December contracts for a further three years. Twelve additional contract months will be added each year on the expiry of the prompt December contract month. (https://www.theice.com/products/219/Brent-Crude-FuturesProduct).
© Copyright 2018 © Richard Bernstein Advisors LLC. All rights reserved.
PAST PERFORMANCE IS NO GUARANTEE OF FUTURE RESULTS
Nothing contained herein constitutes tax, legal, insurance or investment advice, or the recommendation of or an offer to sell, or the solicitation of an offer to buy or invest in any investment product, vehicle, service or instrument. Such an offer or solicitation may only be made by delivery to a prospective investor of formal offering materials, including subscription or account documents or forms, which include detailed discussions of the terms of the respective product, vehicle, service or instrument, including the principal risk factors that might impact such a purchase or investment, and which should be reviewed carefully by any such investor before making the decision to invest. RBA information may include statements concerning financial market trends and/or individual stocks, and are based on current market conditions, which will fluctuate and may be superseded by subsequent market events or for other reasons. Historic market trends are not reliable indicators of actual future market behavior or future performance of any particular investment which may differ materially, and should not be relied upon as such. The investment strategy and broad themes discussed herein may be unsuitable for investors depending on their specific investment objectives and financial situation. Information contained in the material has been obtained from sources believed to be reliable, but not guaranteed. You should note that the materials are provided "as is" without any express or implied warranties. Past performance is not a guarantee of future results. All investments involve a degree of risk, including the risk of loss. No part of RBA’s materials may be reproduced in any form, or referred to in any other publication, without express written permission from RBA. Links to appearances and articles by Richard Bernstein, whether in the press, on television or otherwise, are provided for informational purposes only and in no way should be considered a recommendation of any particular investment product, vehicle, service or instrument or the rendering of investment advice, which must always be evaluated by a prospective investor in consultation with his or her own financial adviser and in light of his or her own circumstances, including the investor's investment horizon, appetite for risk, and ability to withstand a potential loss of some or all of an investment's value. Investing is subject to market risks. Investors acknowledge and accept the potential loss of some or all of an investment's value. Views represented are subject to change at the sole discretion of Richard Bernstein Advisors LLC. Richard Bernstein Advisors LLC does not undertake to advise you of any changes in the views expressed herein.
© Richard Bernstein Advisors
Read more commentaries by Richard Bernstein Advisors